

Abstract
Changes in physiological arousal frequently accompany cognitive performance. Many studies sought to identify the neural correlates of heightened arousal as indexed by skin conductance responses (SCR). However, the observed regional activations may be confounded by task events. We addressed this issue by recording SCR in 25 adults performing a stop signal task (SST) during functional magnetic resonance imaging. We compared only go trials with high and low SCR in order to isolate the event-independent processes. Furthermore, we distinguished go trials that followed another go, a stop success, or a stop error trial to examine whether the neural activities are contingent on the local context in which changes in SCR occurred. The results showed that the supplementary motor area responded to increased SCR irrespective of the preceding trial. The dorsal anterior cingulate cortex increased activation to heightened arousal most significantly in response to stop errors. The medial prefrontal cortex increased activation to SCR following a stop error but decreased activation following a go or stop success trial. These new findings specify the regional activations that accompany changes in physiological arousal during the SST and support distinct processes for the changes that occur under different local contexts. In particular, the MPFC shows opposing responses by increasing activation to changes in arousal evoked by salient stimuli and decreasing activation to the control of arousal.
Keywords: Electrodermal, galvanic skin response, arousal, attention, effort, cognitive control, fMRI
Introduction
Skin conductance response (SCR), or electrodermal response, is a physiological index of arousal. Via sympathetic innervations of the sweat glands, heightened arousal increases skin conductance (Critchley, 2002a; Naqvi and Bechara, 2006). Skin conductance measurements comprise a tonic and phasic component, which differ on their recorded timescales (Figner and Murphy, 2010). Tonic skin conductance, commonly measured by the skin conductance level (SCL), reflects the overall conductivity of the skin over a period of tens of seconds to minutes. The phasic component – SCR – represents a discrete fluctuation in skin conductance that lasts several seconds, as can be elicited by effort, environmental stimuli, and/or emotional responses.
Many brain imaging studies measured skin conductance as an index of task-related arousal during cognitive performance (Table 1). A wide array of brain regions alter activations to changes in skin conductance. However, it is not clear from most of these studies whether the observed cerebral activations were a response to changes in skin conductance or task specific events that evoked these changes. For instance, subjects showed greater activation in the anterior cingulate cortex (ACC), supplementary motor area (SMA), medial prefrontal cortex (MPFC), amygdala, and insula when viewing emotional as compared to neutral pictures (Williams et al., 2005). Some of these regional activations were specific to each emotion and may represent responses to cognitive/affective processes in addition to changes in arousal.
Table 1.
A summary of brain regions that respond to changes in skin conductance.
| 1 | 2 | 3 | 4 | 5 | 6 | 7 | 8 (SCR) | 9 (dSC) | 10 | 11 | 12 | |||||
|---|---|---|---|---|---|---|---|---|---|---|---|---|---|---|---|---|
|
|
||||||||||||||||
| SCL | SCL | SCL | SCL | dSC | SCR | SCR | SCR | Fear | Anger | Disgust | Gam | 2-back | SCL | SCL | SCR | |
| Medial prefrontal cortex | + | − | + | + | + | + | + | |||||||||
| Orbitofrontal cortex | + | − | + | |||||||||||||
| Inferior frontal cortex | + | |||||||||||||||
| Dorsolateral prefrontal cortex | + | + | ||||||||||||||
| Supplementary motor area | − | + | + | + | ||||||||||||
| Olfactory bulb | + | |||||||||||||||
| Insula | + | + | + | + | + | + | ||||||||||
| Anterior cingulate cortex | − | + | + | + | + | + | + | + | ||||||||
| Middle cingulate cortex | + | + | + | |||||||||||||
| Posterior cingulate cortex | + | + | + | |||||||||||||
| Hippocampus | + | + | ||||||||||||||
| Parahippocampal | + | |||||||||||||||
| Amygdala | + | + | + | + | ||||||||||||
| Calcarine sulcus | + | + | + | |||||||||||||
| Lingual gyrus | + | + | + | |||||||||||||
| Middle occipital cortex | + | |||||||||||||||
| Inferior occipital cortex | + | |||||||||||||||
| Fusiform gyrus | + | |||||||||||||||
| Postcentral gyrus | − | + | + | + | ||||||||||||
| Superior parietal lobule | − | − | ||||||||||||||
| Inferior parietal lobule | + | + | + | + | ||||||||||||
| Precuneus | − | |||||||||||||||
| Primary motor cortex | − | + | + | + | + | |||||||||||
| Superior temporal gyrus | + | + | ||||||||||||||
| Middle temporal gyrus | − | |||||||||||||||
| Thalamus | + | + | + | + | + | |||||||||||
| Hypothalamus | + | |||||||||||||||
| Pallidum/Putamen | − | + | ||||||||||||||
| Cerebellum | + | + | + | + | + | |||||||||||
Note: 1- (Critchley et al., 2000a); 2- (Critchley et al., 2002b); 3- (Critchley et al., 2001a); 4-(Nagai et al., 2004); 5- (Gamer et al., 2007); 6- (Macintosh et al., 2007); 7- (Williams et al., 2001); 8- (Williams et al., 2005); 9- (Patterson et al., 2002); 10- (Phelps et al., 2001); 11- (Milad et al., 2007); 12- (Spoormaker et al., 2011); dSC–derivative of SCL; Gam- Gambling task; 2-back- 2-back working memory task; ‘+’: positive related; ‘−’: negative related;
The current study sought to address this issue by examining the neural processes of SCR that are independent of task events. An additional aim is to explore whether the neural correlates of SCR may differ between processes that vary in preceding events. To this end, we recorded skin conductance during fMRI of a stop signal task (SST), a behavioral paradigm widely used to study response inhibition and cognitive control (Zhang and Li, 2012a). In the SST, participants typically slow down in go responses after encountering a stop trial (Li et al., 2008). Furthermore, because of the conflicting need to respond quickly to the go signal and monitor for the stop signal at the same time, participants vary in go trial reaction time even when the antecedent trial is a go trial (Li et al., 2009).
These observations suggest that the SST is effortful and thus likely to evoke changes in arousal. Moreover, changes in arousal could occur for a post-stop go trial, in response to an instruction to stop. Such changes in arousal are elicited by salient stimuli. Changes in arousal could also occur for a post-go go trial as participants “struggle” about how fast they should respond. In the latter scenario, the changes in arousal appear to be internally driven rather than elicited by a stimulus.
Thus, by examining the neural correlates of SCR associated with the same events (i.e., go trials), we could isolate the cerebral correlates of SCR without the confounding influence of task events. By comparing SCR related regional activations during post-go and post-stop go trials, we could distinguish the activations contingent on the local context.
Materials and methods
Subjects and behavioral tasks
Twenty-five adult healthy subjects (10 males, 19-52 years of age, all right-handed and using their right hand to respond) participated in this study. All subjects signed a written consent after details of the study were explained, in accordance to institute guidelines and procedures approved by the Yale Human Investigation Committee.
We employed a simple reaction time (RT) task in this stop-signal paradigm, as described in details in our previous studies (Chao et al., 2009; Li et al., 2009). Briefly, there were two trial types: “go” (~75%) and “stop” (~25%), randomly intermixed. A small dot appeared on the screen to engage attention at the beginning of a go trial. After a randomized time interval (fore-period) between 1 and 5 s, the dot turned into a circle, prompting the subjects to quickly press a button. The circle vanished at button press or after 1 s had elapsed, whichever came first, and the trial terminated. A premature button press prior to the appearance of the circle also terminated the trial. In a stop trial, an additional “X,” the “stop” signal, appeared after the go signal and instructed the subjects to withhold button press. Likewise, a trial terminated at button press or after 1 s had elapsed. There was an inter-trial-interval of 8 s to allow adequate spacing between events of interest and identification of SCR associated with these events. The SSD started at 200 ms and varied from one stop trial to the next according to a staircase procedure, increasing and decreasing by 64 ms, each after a successful and failed stop trial (Levitt, 1971; De Jong et al., 1990). With the staircase procedure, a “critical” SSD could be computed that represents the time delay required for the subject to succeed in half of the stop trials (Levitt, 1971). Subjects were instructed to respond to the go signal quickly while keeping in mind that a stop signal could come up in a small number of trials. Prior to the fMRI study each subject had a practice session outside the scanner. Each subject completed six 10-min runs of the task. Depending on the actual stimulus timing (e.g., trials varied in fore-period duration) and speed of response, the total number of trials varied slightly across subjects in an experiment. With the staircase procedure we anticipated that the subjects would succeed in withholding their response in approximately half of the stop trials.
Skin conductance acquisition and analysis
With a Biopac MP150 system, skin conductance was continuously recorded during fMRI from the palmer surfaces of the index and middle fingers of the left hand. The biopac system used a AcqKnowledge 4.1 software (Biopac Systems, USA) and the Biopac electrodermal activity amplifier module (Galvanic Skin Response [GSR] 100c) set at a channel sampling rate of 31 Hz and a gain of 5 μSiemens (μS) per volt (resulting in a resolution of 0.0015 μS). Recording of skin conductance is synchronized with behavioral task and image acquisition. A smoothing function with a moving average of 500ms was applied in order to eliminate high-frequency noise (Figner and Murphy, 2010). Because all trials were longer than 10 s, we used 10-s window aligned with go signal onset to compute the SCR associated with each trial. Importantly, the window was aligned with go signal onset to emulate the regression models of hemodynamic responses (see below). Thus, the SCR of each trial was defined as the onset-to-peak amplitude difference in skin conductance in this 10-s window (Gamer et al., 2007; Schiller et al., 2008; Figner and Murphy, 2010; Spoormaker et al., 2011).
Imaging protocol
Conventional T1-weighted spin echo sagittal anatomical images were acquired for slice localization using a 3T scanner (Siemens Trio). Anatomical images of the functional slice locations were next obtained with spin echo imaging in the axial plane parallel to the AC-PC line with TR = 300 ms, TE = 2.5 ms, bandwidth = 300 Hz/pixel, flip angle = 60°, field of view = 220 × 220 mm, matrix = 256 × 256, 32 slices with slice thickness = 4 mm and no gap. Functional, blood oxygenation level-dependent (BOLD) signals were then acquired with a single-shot gradient echo echoplanar imaging (EPI) sequence. Thirty-two axial slices parallel to the AC-PC line covering the whole brain were acquired with TR = 2000 ms, TE = 25 ms, bandwidth = 2004 Hz/pixel, flip angle = 85°, field of view = 220 × 220 mm, matrix = 64 × 64, 32 slices with slice thickness = 4 mm and no gap.
Imaging data preprocessing
Brain imaging data were preprocessed using Statistical Parametric Mapping version 8 (Wellcome Department of Imaging Neuroscience, University College London, U.K.). Images from the first five TRs at the beginning of each trial were discarded to enable the signal to achieve steady-state equilibrium between RF pulsing and relaxation. Images of each individual subject were first corrected for slice timing and realigned (motion corrected). A mean functional image volume was constructed for each subject for each run from the realigned image volumes. These mean images were normalized to an MNI (Montreal Neurological Institute) EPI template with affine registration followed by nonlinear transformation (Friston et al., 1995a; Ashburner and Friston, 1999). The normalization parameters determined for the mean functional volume were then applied to the corresponding functional image volumes for each subject. Finally, images were smoothed with a Gaussian kernel of 8 mm at Full Width at Half Maximum.
Imaging data modeling
Four main types of trial outcome were first distinguished: go success (G), go error (F), stop success (SS), and stop error (SE) trial. Stop trials are more salient, because they appear infrequently, in contrast to go trials. A stop trial involves incongruent goals between the prepotency to respond and the motor intention to withhold the response, and is thus “high-conflict,” compared to a go trial.
In order to eliminate condition (trial) related activity, we examined only the SCR of go success (G) trials. First, because approximately 75% of all trials were go trials, we would have adequate statistical power to observe differences in regional brain activations between G trials with high and low SCR. Second, we distinguished G trials by their preceding trial. Thus, G trials were divided into those that followed a G (pG), SS (pSS), or SE (pSE) trial. We hypothesized that neural responses to changes in SCR would differ between pG and pS (pSS and pSE combined) trials. Similarly, by comparing pSS and pSE trials, we expected to identify neural correlates of SCR that are specific to occurrence of errors.
We median-splitted pG, pSS or pSE trials into those with high (pGh, pSSh, and pSEh, respectively) and low (pGl, pSSl, and pSEl) SCRs in each session. A single statistical analytical design was constructed for individual subjects, using the general linear model (GLM) with the onsets of each of these trial types convolved with a canonical hemodynamic response function (HRF) and with the temporal derivative of the canonical HRF and entered as regressors in the model (Friston et al., 1995b). Realignment parameters in all six dimensions were also entered in the model. Serial autocorrelation of the time series was corrected by a first-degree autoregressive or AR(1) model (Friston et al., 2000; Della-Maggiore et al., 2002). The GLM estimated the component of variance that could be explained by each of the regressors.
In the first-level analysis, we constructed for each individual subject these contrasts: pGh>0, pGl>0, pSSh>0, pSSl>0, pSEh>0, pSEl>0, pSh (i.e., pSSh + pSEh)>0, and pSl (i.e., pSSl + pSEl)>0. In the second-level random effects analysis, we used a 2 by 2 ANOVA model on contrast images of pGh>0, pGl>0, pSh>0, and pSl>0 to identify SCR related activations during pG (pGh>pGl) and pS (pSh>pSl) trials and to directly compare these neural correlates: (pGh>pGl) vs. (pSh>pSl). Similarly, in a second 2 by 2 ANOVA, we identified SCR related activations specific to pSS (pSSh>pSSl) and pSE (pSEh>pSEl) trials and compared these activations.
In region of interest (ROI) analysis, we used MarsBaR (http://marsbar.sourceforge.net/) to derive for each individual subject the effect size of activity change for the ROIs. Functional ROIs were defined based on activated clusters from whole brain analysis. All voxel activations were presented in MNI coordinates.
Results
Behavioral performance and skin conductance responses
Behavioral results of the SST are listed in Table 2a. Participants succeeded in about half of the stop trials, indicating the success of the staircase procedure in tracking their performance.
Table 2.
Behavioral performance and trial-specific skin conductance response
| a. General performance in the Stop Signal Task | ||||||||
|---|---|---|---|---|---|---|---|---|
| Go RT (ms) |
Coefficient of variation in go RT |
%go | %stop | SSRT (ms) |
Critical SSD (ms) |
Post-error
slowing |
||
| 644±74 | 0.21±0.04 | 94.2±6.4 | 55.5±3.6 | 235±41 | 414±78 | 1.69±1.33 | ||
|
| ||||||||
| b. pG, pS, pSE, pSS trials | ||||||||
| pGh | pGl | pSh | pSl | pSSh | pSSl | pSEh | pSEl | |
|
| ||||||||
| SCR (μsiemens) | 0.30±0.32 | 0.03±0.04 | 0.33±0.39 | 0.05±0.09 | 0.32±0.36 | 0.06±0.09 | 0.35±0.49 | 0.05±0.10 |
| RT (ms) | 632±73 | 637±77 | 689±83 | 690±67 | 687±84 | 695±73 | 691±92 | 685±73 |
Note: %go and %stop = percentage of successful go and stop trials; RT = reaction time; SSRT = stop-signal reaction time; SSD = stop signal delay; pGh (pGl) = post-go go trials with high (low) SCR; pSh (pSl) = post-stop go trials with high (low) SCR; pSSh (pSSl) = post-stop success go trials with high (low) SCR; pSEh (pSEl) = post-stop error go trials with high (low) SCR; all numbers are mean ± standard deviation;
Skin conductance responses during the SST are shown in Figure 1b. Shortly after a trial onset, typically 1 to 3 seconds, skin conductance started to increase and reached the peak within 10 seconds. As described in the Methods, we quantified this change (SCR) by subtracting the amplitude at the baseline from the amplitude at the peak in a 10-second window after stimulus onset for each trial. Across all 25 subjects, G, SS, and SE trials showed significant differences in SCR (p = 0.003, one-way ANOVA), as did planned comparisons: SS vs. G (p = 0.01); SE vs. G (p = 0.0003); and SE vs. SS (p = 0.004), by two-sample t tests (Figure 1c).
Figure 1.

(a) An example of a subject’s raw skin conductance within one session. (b) The same subject’s averaged skin conductance of G (blue), SS (green), and SE (red) trials, aligned with the onset of the go signal and over a time window of 10 s. (c) The same subject’s averaged skin conductance response (SCR, mean ± S.E.) of G (blue), SS (green), and SE (red) trials. SCR was significantly different between G and SS (p = 0.0001), between G and SE (p < 0.0001), and between SS and SE (p < 0.0001) trials. (d) Post-go go (pG), post-stop success go (pSS), and post-stop error go (pSE) trials did not differ in SCR. Data bars show SCR (mean ± S.E.) across all 25 subjects.
We examined the SCR of post-go go (pG), post-stop go (pS), post-stop success go (pSS), and post-stop error go (pSE) trials. The SCR did not differ between pG and pS trials (p = 0.92, paired t test) or between pSS and pSE trials (p = 0.74). These latter results indicated that the SCR of go trials did not depend on whether they were preceded by a go, stop success, or stop error trials.
We separated pG, pS (pSS and pSE combined), pSS, and pSE trials according to a median split of the SCR (Table 2b and Figure 1d). As expected, significant differences in SCR were observed between high and low SCR trials each for pG, pS, pSS, and pSE (p = 0.0001, p = 0.0009, p = 0.0003, p = 0.006, respectively; paired t test). We observed that the RT did not differ between the high and low SCR trials for pG, pS (pSS and pSE combined), pSS, or pSE trials (p = 0.34, p = 0.91, p = 0.48, p = 0.61, respectively; paired t test; Table 2b).
Across subjects, we correlated SCR of pG and pS, and their difference (pS-pG) with the mean of go RT, coefficient of variation in go RT, SSRT, and post-error slowing. The results showed that the difference in SCR, pS-pG, was negatively correlated with the coefficient of variation in go RT (uncorrected p<0.03, R=−0.43, Pearson regression) at a trend level. Thus, a greater SCR elicited by stop as compared to go trials appear to be associated with less variability in go response time in the SST. None of the other correlations were significant (all p’s > 0.1).
Arousal related brain activation during post-go go and post-stop go trials
We examined arousal related brain regions by comparing all (both pG and pS) trials with high SCR to those with low SCR. Significant (p < 0.05, FWE corrected) main effect of high as compared to low SCR was observed in anterior/middle cingulate gyrus, supplementary motor area and precuneus (Figure 2A and Table 3). In a separate comparison for pG trials, pGh trials showed greater (p < 0.05, FWE corrected) activations in supplementary motor area, precuneus, and cerebellum compared to pGl trials (Figure 2B and Table 3). And pSh trials showed greater (cluster level p < 0.05, FWE corrected) activations in anterior/middle cingulate gyrus, supplementary motor area, and primary motor cortex, compared to pSl trials (Figure 2C and Table 3). No brain areas showed greater activation in the low as compared to high SCR trials, for pG, pS, or pG and pS trials combined, even at an uncorrected threshold of p<0.01.
Figure 2.

Brain regions showing greater activation for high compared to low SCR trials. Significant regional differences were identified for (A) the main effect of SCRh > SCRl in anterior cingulate cortex (ACC), supplementary motor area (SMA), and precuneus at p<0.05, corrected for FWE of multiple comparisons; (B) pGh > pGl in SMA, precuneus, and cerebellum at p<0.05, FWE corrected; (C) pSh > pSl in SMA and ACC at cluster-level p<0.05, FWE corrected; and (D) for the interaction effect of (pSh – pSl) > (pGh – pGl) in ACC at p<0.001, uncorrected and p<0.05, FWE with small volume correction for the anterior/middle cingulate gyrus mask from pSh > pSl.
Table 3.
Regional brain activations to high as compared to low SCR during pG and pS trials.
| Cluster size (mm3) |
Voxel Z value |
MNI coordinate (mm) | Identified region and approximate BA |
||
|---|---|---|---|---|---|
|
| |||||
| x | y | z | |||
| Main effect of SCRh > SCRl (p<0.05, FWE corrected) | |||||
| 1620 | 4.89 | 3 | 14 | 22 | Anterior/middle cingulate G |
| 972 | 4.95 | −6 | −4 | 73 | Supplementary motor area |
| 270 | 4.84 | 9 | −55 | 67 | Precuneus |
| pGh > pGl (p<0.05, FWE corrected) | |||||
| 3375 | 5.19 | 3 | 2 | 67 | Supplementary motor area |
| 2862 | 5.50 | 6 | −55 | 67 | Precuneus |
| 1107 | 4.94 | −3 | −79 | −14 | Cerebellum |
| pSh > pSl (p<0.001 uncorrected and cluster-level threshold of p<0.05, FWE corrected) | |||||
| 15741 | 4.77 | 3 | 14 | 22 | Anterior/middle cingulate G |
| 6426 | 4.21 | −6 | −7 | 70 | Supplementary motor area |
| 4.07 | −21 | −22 | 70 | Primary motor cortex | |
|
pSh – pSl > pGh – pGl (p<0.001, uncorrected and p<0.05, FWE corrected for SVC of anterior
cingulate G) | |||||
| 540 | 4.23 | 3 | 14 | 22 | Anterior cingulate G |
Note: G, gyrus; SVC, small volume correction
We contrasted the SCR related regional activations between pG and pS trials in an ANOVA and observed differences (p<0.05, FWE) in the dorsal anterior cingulate cortex (dACC) in the interaction: (pSh>pSl)>(pGh>pGl), using small volume correction for a mask involving the anterior/middle cingulate gyrus as obtained in the main effect of pSh > pSl (Figure 2D and Table 3). This difference was significant at p<0.001, uncorrected, without using small volume correction.
Supplementary Figure 1 showed the main effect of differences in regional activations for pG and pS trials.
Arousal related brain activation during post-stop success and post-stop error go trials
We further examined arousal related brain regions by comparing pSS and pSE trials with high and low SCR. pSSh in contrast to pSSl trials showed greater (cluster level p < 0.05, FWE corrected) activations in precuneus, cuneus, superior occipital gyrus, angular gyrus, inferior parietal lobule, and dorsolateral prefrontal gyrus (Figure 3A and Table 4). And pSEh as compared to pSEl trials showed greater (cluster level p < 0.05, FWE corrected) activations in anterior/middle cingulate gyrus (Figure 3B and Table 4).
Figure 3.

Brain regions showing greater activation for high compared to low SCR pSS and pSE trials (cluster-level p<0.05, FWE corrected). Significant regional differences were identified for (A) pSSh > pSSl in inferior parietal cortex/precuneus and left MFC; (B) pSEh > pSEl in ACC; and (C) the interaction effect of (pSEh – pSEl) > (pSSh – pSSl) in medial prefrontal cortex (MPFC) at p<0.001, uncorrected and p<0.05, FWE with small volume correction for the medial prefrontal cortex mask from AAL (Tzourio-Mazoyer et al., 2002).
Table 4.
Regional brain activations to high as compared to low SCR during pSS and pSE trials
| Cluster size (mm3) |
Voxel Z value |
MNI coordinate (mm) | Identified region and approximate BA |
||
|---|---|---|---|---|---|
|
| |||||
| x | y | z | |||
| pSSh > pSSl (p<0.001 uncorrected; cluster-levelp<0.05, FWE corrected) | |||||
| 11583 | 4.26 | 12 | −70 | 52 | Precuneus |
| 4.25 | 15 | −73 | 43 | Cuneus/Precuneus, superior occipital G, | |
| angular G, inferior parietal lobule | |||||
| 4158 | 4.15 | −42 | 47 | 19 | Dorsolateral prefrontal G |
| pSEh >pSEl (p< 0.001 uncorrected; cluster-levelp<0.05, FWE corrected) | |||||
| 5616 | 4.17 | 3 | 11 | 25 | Anterior/middle cingulate G |
|
pSEh – pSEl > pSSh – pSSl (p<0.001, uncorrected; and p<0.05, FWE corrected, SVC for medial
prefrontal cortex) | |||||
| 1890 | 4.49 | 3 | 29 | −11 | Medial prefrontal cortex |
Note: G, gyrus; SVC, small volume correction
Similarly, we contrasted the SCR related regional activations between pSE and pSS trials in an ANOVA and observed differences (p<0.05, FWE) in medial prefrontal cortex (MPFC) in the interaction: (pSEh>pSEl)>(pSSh>pSSl), using small volume correction for the AAL medial prefrontal cortex mask (Tzourio-Mazoyer et al., 2002) (Figure 3C and Table 4). This difference was significant at p<0.001, uncorrected, without using small volume correction. We computed the effect size of pSEh, pSEl, pSSh, and pSSl for the MPFC to highlight the opposing pattern of responses to SCR in pSE and pSS trials (Figure 3C). In planned comparisons of the effect size of activations, MPFC responded to increased arousal during pSE trials (pSEh > pSEl, p=0.004, paired t test), but to decreased arousal during pSS trials (pSSl > pSSh, p=0.02, paired t test).
Figure 4 and Figure 5 show the effect size of pGh, pGl, pSSh, pSSl, pSEh, and pSEl trials for each of these regions of interest identified from the group analyses. To test the hypothesis whether self control of arousal during errors is related to post-error slowing (PES), we correlated across subjects the effect size of PES with the effect size of MPFC in (pSEh – pSEl) – (pSSh – pSSl). The results showed a negative correlation in Pearson regression: p<0.04, r=−0.40. Note that this is equivalent to a positive correlation between the effect size of PES and the reverse contrast: (pSSh – pSSl) – (pSEh – pSEl) (see Discussion).
Figure 4.

Effect size of pGh, pGl, pSSh, pSSl, pSEh, and pSEl trials for each of the regions of interest (ROIs) that showed difference in activation between high (h) and low (l) SCR trials across all trials (SCRh>SCRl), pG trials (pGh>pGl), and pS trials (pSh>pSl). Vertical bars represent standard error of the mean. The insets showed the ROIs.
Figure 5.
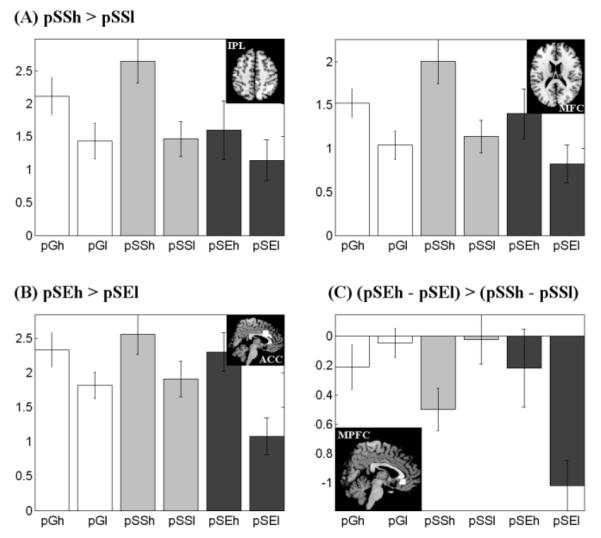
Effect size of pGh, pGl, pSSh, pSSl, pSEh, and pSEl trials for each of the regions of interest (ROIs) that showed difference in activation between high (h) and low (l) SCR trials across pSS trials (pSSh>pSSl), pSE trials (pSEh>pSEl), and their interaction (pSEh>pSEl)>(pSSh>pSSl). . Vertical bars represent standard error of the mean. The insets showed the ROIs.
Discussion
Cerebral correlates of arousal during the stop signal task
Considering all go trials, heightened arousal as indexed by greater SCR is associated with increased activations of the dorsal anterior cingulate cortex (dACC), supplementary motor area (SMA), and precuneus. Because the trials under comparison are all go trials, and those with high and low SCR do not differ in RT, these regional brain activations appear specific to changes in SCR. When go trials are broken down according to their preceding trials, greater SCR during go trials preceded by another go (pG) is associated with activations of the SMA, precuneus, and cerebellum, but not dACC; in contrast, greater SCR during go trials preceded by a stop trial (pS) is associated with activations of the dACC and SMA, but not precuneus or cerebellum. Furthermore, a direct contrast showed greater activations of the dACC in association with arousal in pS as compared to pG trials. Because we are comparing both go trials that are indistinguishable in the difference (high vs. low) of SCR and RT, the observed differences in dACC activity reflect a correlate of SCR specific to what preceded these go trials. That is, dACC activations as associated with high arousal are elicited with an antecedent conflict. In contrast, the supplementary motor area (SMA) responded to an increase in arousal irrespective of what happened approximately 12 seconds before. These results suggest that the cerebral correlates of physiological arousal vary with the local context in which changes in arousal occurs. Fluctuations in SCR during pG trials are driven by participants’ effort in negotiating between speed and accuracy. In contrast, changes in SCR during pS trials are in response to an antecedent conflict.
Regional activations during endogenous SCR
The dorsal precuneus and the posterior cerebellar vermis activate to increased SCR during pG but to a lesser extent during pS trials. Therefore, these areas appear to be specifically engaged during changes in skin conductance elicited spontaneously rather than by an external stimulus.
The finding of dorsal precuneus responding to increased SCR is seemingly inconsistent with precuneus as part of the default model network, which deactivates to mental effort (Raichle et al., 2001; Fox and Raichle, 2007). Our recent study of connectivity mapping showed that only the ventral precuneus is within the default network (Zhang and Li, 2012b; see also Buckner et al., 2008). In contrast, dorsal precuneus is connected to brain regions in control of attention and visual spatial information processing. In particular, the dorsal precuneus appears to play a role in mediating behavioral engagement (Zhang and Li, 2010). We observed that the fractional amplitude of low frequency fluctuation (fALFF) of the dorsal precuneus accounted for approximately 10% of the variance in prefrontal activations related to attentional monitoring and response inhibition in stop signal task. Thus, the current finding of greater activation in the dorsal precuneus during increased arousal provides additional evidence in support of its role in mental effort.
Cerebellum was shown to alter activations to changes in arousal in a number of earlier studies (Critchley et al., 2000a; Patterson et al., 2002; Nagai et al., 2004; Gamer et al., 2007). As part of the central autonomic network (Spyer, 1994, 1999), the posterior cerebellar vermis is involved in cardiovascular control (Ghelarducci et al., 1996; Harper et al., 1998; Nisimaru et al., 1998; Critchley et al., 2000b) and autonomic processes of emotional behaviors (Martner, 1975). For instance, electrical microstimulation of the posterior cerebellar vermis evoked changes in cardiovascular responses in cats and rabbits (Bradley et al., 1987; 1991). Surgically removing this brain region early during development affected bradycardic responses in adult animals (Ghelarducci et al., 1996). The finding that the cerebellar activation to SCR is more significant during pG than pS trials suggests its role in endogenous control of arousal.
Regional activations to stimulus-elicited increase in SCR
The dorsal anterior cingulate cortex (dACC) activates to increased SCR during post-go stop but not post-go go trials, suggesting that, in contrast to the cerebellar vermis and precuneus, it mediates changes in arousal following exposure to external stimuli. A relationship between dACC activity and autonomic bodily responses (e.g., skin conductance, heart rate, blood pressure) has been highlighted in a series of neuroimaging studies. For instance, dACC activity correlated with blood pressure during motor exercise (Critchley et al., 2000b; 2001b), and predicted heart rate in reaction time (Critchley et al., 2005b) and working memory tasks (Critchley et al., 2003). Activation of the dACC was related to arousal responses in subjects viewing emotional pictures (Williams et al., 2005; Milad et al., 2007). Critchley et al. (2005a) quantified changes in arousal from changes in pupil size and found that dACC activity reflected both performance error and papillary responses in a Stroop task.
Thus, our findings confirmed the role of the dACC in the generation of autonomic arousal in response to cognitive and affective events (Critchley, 2005c, 2009) and as a shared central representation of arousal and attention (Critchley et al., 2001a).
Medial prefrontal cortex and arousal
The medial prefrontal cortex (MPFC) showed greater activation to increased SCR during post-stop error than post-stop success trials, indicating its broad relevance in mediating error-elicited changes in arousal. The MPFC is consistently implicated in the regulation of arousal during decision making (Critchley et al., 2000a), working memory (Patterson et al., 2002), affective processing (Williams et al., 2001; 2005), and biofeedback relaxation training (Nagai et al., 2004). Patients with lesions in this brain region have deficits in generating electrodermal responses and showed a reduction in anticipatory arousal (Tranel and Damasio, 1994; Zahn et al., 1999). Interestingly, while these patients do not show anticipatory arousal during a risky decision, they respond and increase skin conductance to physical stimuli such as loud noises (Bechara et al., 1996; Zahn et al., 1999; Tranel, 2000). These findings suggest that MPFC is causally involved in endogenous or anticipatory regulation of arousal but not necessary for changes in arousal evoked by environmental stimuli. MPFC increases activation to arousing stimuli and engage in the self control of arousal by decreasing activation.
Notably, Nagai et al. (2004) observed a negative association between MPFC activity and skin conductance when participants engaged in control of arousal. While skin conductance covaried negatively during biofeedback that engaged participants’ control of arousal (Nagai et al., 2004), it correlated positively with activations of the MPFC in a decision-making task (Critchley et al. 2000a). Similarly, our results showed activations of the MPFC in association with higher arousal during pSE trials but with lower arousal during pSS and pG trials (Figure 5C). This contrasting pattern of activities again indicates the importance of distinguishing the context in identifying the neural correlates of arousal. In particular, MPFC may alter activation in opposing directions to stimuli-evoked changes in arousal and endogenous control of arousal. The role of the MPFC in the endogenous control of arousal specifies a function of the MPFC akin to the default mode network (Raichle et al., 2001; Fox and Raichle, 2007). This finding perhaps also suggests that stop success and go success share neural processes in distinction to stop error trials. Participants are routinely cautious in responding during the SST and would commit an error when they deviate from this modus operandi at a time when a stop trial occurs.
Arousal and stop signal task performance including post-error slowing
Post-error slowing (PES) is generally considered to be a component process of cognitive control, in which an error signals greater control and prolongs reaction time in subsequent trials (Li et al., 2008). On the other hand, studies have also provided evidence for an “orientation” account of PES (Castellar et al., 2010; Notebaert et al., 2009). It is posited that PES occurs because errors alert and re-orient participants’ attention away from resources dedicated to motor responses, thereby slowing down the response. In this scenario, one would expect heightened arousal or increased SCR in association with PES. For instance, an evoked potential study investigated the relationship between autonomic responses and the error-related positivity (Pe), a positive potential elicited by errors, in a two-choice reaction time task (Hajcak et al., 2003). Errors were associated with greater SCRs and heart rate deceleration, and SCR was significantly correlated with post-error slowing. This latter finding needs to be reconciled with our results that the RT did not differ between post-stop error trials with high and low SCR. Furthermore, we observed a significant positive correlation across subjects between the extent of PES and the differences in MPFC activation to changes in SCR during pSS and pSE trials: (pSSh – pSSl) – (pSEh – pSEl) (see Figure 5C). Because this contrast effectively reflects how well one controls arousal elicited by an error, a positive correlation suggests that those who are better controllers of physiological responses demonstrate greater performance monitoring and behavioral adjustment following an error. These findings of inter-subject variation in arousal control are in direct contrast to an orientation account of PES.
Conclusion
Regional brain activations accompany task-related events and changes in physiological arousal in association with these events. By examining go trials of high and low SCR in the stop signal task, we demonstrate neural correlates that appear to be independent of task events. These neural processes are distinct with respect to the local context in which changes in arousal occurs. In particular, the ventromedial prefrontal cortex alters activations in opposing directions depending on whether the preceding trial is a go or stop trial. These results suggest a potential role of the ventromedial prefrontal cortex in regulating arousal and may have implications for our understanding of the etiology of anxiety and mood disorders.
Supplementary Material
Table 5.
A summary of areal activations associated with changes in SCR in this study.
| Contrast | SCR/SCR differences (μsiemens) |
Identified Brain regions | |
|---|---|---|---|
| (A > B) | A | B | |
| SCRh > SCRl | 0.31±0.34 | 0.04±0.06 | Anterior/Middle cingulate G; Supplementary motor area; Precuneus; |
| pGh > pGl | 0.30±0.32 | 0.03±0.04 | Supplementary motor area; precuneus; cerebellum |
| pSh > pSl | 0.33±0.39 | 0.05±0.09 | Anterior/Middle cingulate G; Supplementary motor area; Primary motor cortex |
| pSh-pSl > pGh-pGl | 0.27±0.36 | 0.28±0.29 | Anterior cingulate G |
| pSSh > pSSl | 0.32±0.36 | 0.06±0.09 | Precuneus; Dorsolateral prefrontal G; Cuneus/Precuneus; Superior occipital G; Angular; Inferior parietal lobule |
| pSEh > pSEl | 0.35±0.49 | 0.05±0.10 | Anterior/Middle cingulate G |
| pSEh-pSEl > pSSh-pSSl | 0.30±0.49 | 0.26±0.31 | Medial prefrontal cortex |
Note: G- gyrus; h- high SCR group; l- low SCR group; SCR: mean ± standard deviation;
Acknowledgements
This study was supported by NIH grants R01DA023248, R21AA018004, K02DA026990, R03CA138121, Tourette Syndrome Association, William O. Seery Foundation, and a Yale Cancer Center translational pilot grant. The content is solely the responsibility of the authors and does not necessarily represent the official views of the National Institute of Drug Abuse, National Center for Research Resources or the National Institutes of Health. We thank Sarah Bednarski and Emily Erdman in subject recruitment and assessment as well as running of some of the imaging studies.
Footnotes
Publisher's Disclaimer: This is a PDF file of an unedited manuscript that has been accepted for publication. As a service to our customers we are providing this early version of the manuscript. The manuscript will undergo copyediting, typesetting, and review of the resulting proof before it is published in its final citable form. Please note that during the production process errors may be discovered which could affect the content, and all legal disclaimers that apply to the journal pertain.
Reference
- Ashburner J, Friston KJ. Nonlinear spatial normalization using basis functions. Hum Brain Mapp. 1999;7:254–266. doi: 10.1002/(SICI)1097-0193(1999)7:4<254::AID-HBM4>3.0.CO;2-G. [DOI] [PMC free article] [PubMed] [Google Scholar]
- Bechara A, Tranel D, Damasio H, Damasio AR. Failure to respond autonomically to anticipated future outcomes following damage to prefrontal cortex. Cereb Cortex. 1996;6:215–225. doi: 10.1093/cercor/6.2.215. [DOI] [PubMed] [Google Scholar]
- Bradley DJ, Ghelarducci B, Spyer KM. The role of the posterior cerebellar vermis in cardiovascular control. Neurosci Res. 1991;12:45–56. doi: 10.1016/0168-0102(91)90099-k. [DOI] [PubMed] [Google Scholar]
- Bradley DJ, Pascoe JP, Paton JF, Spyer KM. Cardiovascular and respiratory responses evoked from the posterior cerebellar cortex and fastigial nucleus in the cat. J Physiol. 1987;393:107–121. doi: 10.1113/jphysiol.1987.sp016813. [DOI] [PMC free article] [PubMed] [Google Scholar]
- Buckner RL, Andrews-Hanna JR, Schacter DL. The brain’s default network: anatomy, function, and relevance to disease. Ann N Y Acad Sci. 2008;1124:1–38. doi: 10.1196/annals.1440.011. [DOI] [PubMed] [Google Scholar]
- Chao HH, Luo X, Chang JL, Li CS. Activation of the pre-supplementary motor area but not inferior prefrontal cortex in association with short stop signal reaction time--an intra-subject analysis. BMC Neurosci. 2009;10:75. doi: 10.1186/1471-2202-10-75. [DOI] [PMC free article] [PubMed] [Google Scholar]
- Critchley HD. Electrodermal responses: what happens in the brain. Neuroscientist. 2002a;8:132–142. doi: 10.1177/107385840200800209. [DOI] [PubMed] [Google Scholar]
- Critchley HD. Neural mechanisms of autonomic, affective, and cognitive integration. J Comp Neurol. 2005c;493:154–166. doi: 10.1002/cne.20749. [DOI] [PubMed] [Google Scholar]
- Critchley HD. Psychophysiology of neural, cognitive and affective integration: fMRI and autonomic indicants. Int J Psychophysiol. 2009;73:88–94. doi: 10.1016/j.ijpsycho.2009.01.012. [DOI] [PMC free article] [PubMed] [Google Scholar]
- Critchley HD, Mathias CJ, Dolan RJ. Neural activity in the human brain relating to uncertainty and arousal during anticipation. Neuron. 2001a;29:537–545. doi: 10.1016/s0896-6273(01)00225-2. [DOI] [PubMed] [Google Scholar]
- Critchley HD, Mathias CJ, Dolan RJ. Neuroanatomical basis for first- and second-order representations of bodily states. Nat Neurosci. 2001b;4:207–212. doi: 10.1038/84048. [DOI] [PubMed] [Google Scholar]
- Critchley HD, Elliott R, Mathias CJ, Dolan RJ. Neural activity relating to generation and representation of galvanic skin conductance responses: a functional magnetic resonance imaging study. J Neurosci. 2000a;20:3033–3040. doi: 10.1523/JNEUROSCI.20-08-03033.2000. [DOI] [PMC free article] [PubMed] [Google Scholar]
- Critchley HD, Corfield DR, Chandler MP, Mathias CJ, Dolan RJ. Cerebral correlates of autonomic cardiovascular arousal: a functional neuroimaging investigation in humans. J Physiol. 2000b;523(Pt 1):259–270. doi: 10.1111/j.1469-7793.2000.t01-1-00259.x. [DOI] [PMC free article] [PubMed] [Google Scholar]
- Critchley HD, Melmed RN, Featherstone E, Mathias CJ, Dolan RJ. Volitional control of autonomic arousal: a functional magnetic resonance study. Neuroimage. 2002b;16:909–919. doi: 10.1006/nimg.2002.1147. [DOI] [PubMed] [Google Scholar]
- Critchley HD, Tang J, Glaser D, Butterworth B, Dolan RJ. Anterior cingulate activity during error and autonomic response. Neuroimage. 2005a;27:885–895. doi: 10.1016/j.neuroimage.2005.05.047. [DOI] [PubMed] [Google Scholar]
- Critchley HD, Rotshtein P, Nagai Y, O’Doherty J, Mathias CJ, Dolan RJ. Activity in the human brain predicting differential heart rate responses to emotional facial expressions. Neuroimage. 2005b;24:751–762. doi: 10.1016/j.neuroimage.2004.10.013. [DOI] [PubMed] [Google Scholar]
- Critchley HD, Mathias CJ, Josephs O, O’Doherty J, Zanini S, Dewar BK, Cipolotti L, Shallice T, Dolan RJ. Human cingulate cortex and autonomic control: converging neuroimaging and clinical evidence. Brain. 2003;126:2139–2152. doi: 10.1093/brain/awg216. [DOI] [PubMed] [Google Scholar]
- De Jong R, Coles MG, Logan GD, Gratton G. In search of the point of no return: the control of response processes. J Exp Psychol Hum Percept Perform. 1990;16:164–182. doi: 10.1037/0096-1523.16.1.164. [DOI] [PubMed] [Google Scholar]
- Della-Maggiore V, Chau W, Peres-Neto PR, McIntosh AR. An empirical comparison of SPM preprocessing parameters to the analysis of fMRI data. Neuroimage. 2002;17:19–28. doi: 10.1006/nimg.2002.1113. [DOI] [PubMed] [Google Scholar]
- Figner B, Murphy RO. Using skin conductance in judgment and decision making research. In: Schulte-Mecklenbeck M, Kuehberger A, Ranyard R, editors. A handbook of process tracing methods for decision research. Psychology Press; New York, NY: 2010. pp. 163–184. [Google Scholar]
- Fox MD, Raichle ME. Spontaneous fluctuations in brain activity observed with functional magnetic resonance imaging. Nat Rev Neurosci. 2007;8:700–711. doi: 10.1038/nrn2201. [DOI] [PubMed] [Google Scholar]
- Friston K, Ashburner J, Frith C, Polone J, Heather J, Frackowiak R. Spatial registration and normalization of images. Hum Brain Mapp. 1995a;2:165–189. [Google Scholar]
- Friston K, A H, K W, J P, Frith C, Frackowiak R. Statistical parametric maps in functional imaging: a general linear approach. Hum Brain Mapp. 1995b;2:189–210. [Google Scholar]
- Friston KJ, Josephs O, Zarahn E, Holmes AP, Rouquette S, Poline J. To smooth or not to smooth? Bias and efficiency in fMRI time-series analysis. Neuroimage. 2000;12:196–208. doi: 10.1006/nimg.2000.0609. [DOI] [PubMed] [Google Scholar]
- Gamer M, Bauermann T, Stoeter P, Vossel G. Covariations among fMRI, skin conductance, and behavioral data during processing of concealed information. Hum Brain Mapp. 2007;28:1287–1301. doi: 10.1002/hbm.20343. [DOI] [PMC free article] [PubMed] [Google Scholar]
- Ghelarducci B, Salamone D, Simoni A, Sebastiani L. Effects of early cerebellar removal on the classically conditioned bradycardia of adult rabbits. Exp Brain Res. 1996;111:417–423. doi: 10.1007/BF00228730. [DOI] [PubMed] [Google Scholar]
- Hajcak G, McDonald N, Simons RF. To err is autonomic: error-related brain potentials, ANS activity, and post-error compensatory behavior. Psychophysiology. 2003;40:895–903. doi: 10.1111/1469-8986.00107. [DOI] [PubMed] [Google Scholar]
- Harper RM, Gozal D, Bandler R, Spriggs D, Lee J, Alger J. Regional brain activation in humans during respiratory and blood pressure challenges. Clin Exp Pharmacol Physiol. 1998;25:483–486. doi: 10.1111/j.1440-1681.1998.tb02240.x. [DOI] [PubMed] [Google Scholar]
- Li CS, Chao HH, Lee TW. Neural correlates of speeded as compared with delayed responses in a stop signal task: An indirect analog of risk taking and association with an anxiety trait. Cereb Cortex. 2009;19:839–848. doi: 10.1093/cercor/bhn132. [DOI] [PMC free article] [PubMed] [Google Scholar]
- Li CS, Huang C, Yan P, Paliwal P, Constable RT, Sinha R. Neural Correlates of Posterror Slowing during a Stop Signal Task: A Functional Magnetic Resonance Imaging Study. J Cogn Neurosci. 2008;20(6):1021–1029. doi: 10.1162/jocn.2008.20071. [DOI] [PMC free article] [PubMed] [Google Scholar]
- Macintosh BJ, Mraz R, McIlroy WE, Graham SJ. Brain activity during a motor learning task: an fMRI and skin conductance study. Hum Brain Mapp. 2007;28:1359–1367. doi: 10.1002/hbm.20351. [DOI] [PMC free article] [PubMed] [Google Scholar]
- Milad MR, Quirk GJ, Pitman RK, Orr SP, Fischl B, Rauch SL. A role for the human dorsal anterior cingulate cortex in fear expression. Biol Psychiatry. 2007;62:1191–1194. doi: 10.1016/j.biopsych.2007.04.032. [DOI] [PubMed] [Google Scholar]
- Nagai Y, Critchley HD, Featherstone E, Trimble MR, Dolan RJ. Activity in ventromedial prefrontal cortex covaries with sympathetic skin conductance level: a physiological account of a “default mode” of brain function. Neuroimage. 2004;22:243–251. doi: 10.1016/j.neuroimage.2004.01.019. [DOI] [PubMed] [Google Scholar]
- Naqvi NH, Bechara A. Skin conductance: a psychophysiological approach to the study of decision making. In: Senior C, Russell T, Gazzaniga MS, editors. Methods in mind. The MIT Press; 2006. pp. 103–122. [Google Scholar]
- Nisimaru N, Okahara K, Yanai S. Cerebellar control of the cardiovascular responses during postural changes in conscious rabbits. Neurosci Res. 1998;32:267–271. doi: 10.1016/s0168-0102(98)00094-7. [DOI] [PubMed] [Google Scholar]
- Notebaert W, Houtman F, Opstal FV, Gevers W, Fias W, Verguts T. Post-error slowing: an orienting account. Cognition. 2009;111:275–279. doi: 10.1016/j.cognition.2009.02.002. [DOI] [PubMed] [Google Scholar]
- Patterson JC, 2nd, Ungerleider LG, Bandettini PA. Task-independent functional brain activity correlation with skin conductance changes: an fMRI study. Neuroimage. 2002;17:1797–1806. doi: 10.1006/nimg.2002.1306. [DOI] [PubMed] [Google Scholar]
- Phelps EA, O’Connor KJ, Gatenby JC, Gore JC, Grillon C, Davis M. Activation of the left amygdala to a cognitive representation of fear. Nat Neurosci. 2001;4:437–441. doi: 10.1038/86110. [DOI] [PubMed] [Google Scholar]
- Schiller D, Levy I, Niv Y, LeDoux JE, Phelps EA. From fear to safety and back: reversal of fear in the human brain. J Neurosci. 2008;28:11517–11525. doi: 10.1523/JNEUROSCI.2265-08.2008. [DOI] [PMC free article] [PubMed] [Google Scholar]
- Spoormaker VI, Andrade KC, Schroter MS, Sturm A, Goya-Maldonado R, Samann PG, Czisch M. The neural correlates of negative prediction error signaling in human fear conditioning. Neuroimage. 2011;54(3):2250–2256. doi: 10.1016/j.neuroimage.2010.09.042. [DOI] [PubMed] [Google Scholar]
- Spyer KM. Annual review prize lecture. Central nervous mechanisms contributing to cardiovascular control. J Physiol. 1994;474:1–19. doi: 10.1113/jphysiol.1994.sp019997. [DOI] [PMC free article] [PubMed] [Google Scholar]
- Spyer KM. Central nervous control of the cardiovascular system. In: Mathias CJ, Bannister R, editors. Autonomic failure: a textbook of clinical disorders of the autonomic nervous system. Oxford UK: 1999. pp. 45–55. [Google Scholar]
- Tranel D, Damasio H. Neuroanatomical correlates of electrodermal skin conductance responses. Psychophysiology. 1994;31:427–438. doi: 10.1111/j.1469-8986.1994.tb01046.x. [DOI] [PubMed] [Google Scholar]
- Tzourio-Mazoyer N, Landeau B, Papathanassiou D, Crivello F, Etard O, Delcroix N, Mazoyer B, Joliot M. Automated anatomical labeling of activations in SPM using a macroscopic anatomical parcellation of the MNI MRI single-subject brain. Neuroimage. 2002;15:273–289. doi: 10.1006/nimg.2001.0978. [DOI] [PubMed] [Google Scholar]
- Williams LM, Das P, Liddell B, Olivieri G, Peduto A, Brammer MJ, Gordon E. BOLD, sweat and fears: fMRI and skin conductance distinguish facial fear signals. Neuroreport. 2005;16:49–52. doi: 10.1097/00001756-200501190-00012. [DOI] [PubMed] [Google Scholar]
- Williams LM, Phillips ML, Brammer MJ, Skerrett D, Lagopoulos J, Rennie C, Bahramali H, Olivieri G, David AS, Peduto A, Gordon E. Arousal dissociates amygdala and hippocampal fear responses: evidence from simultaneous fMRI and skin conductance recording. Neuroimage. 2001;14:1070–1079. doi: 10.1006/nimg.2001.0904. [DOI] [PubMed] [Google Scholar]
- Zahn TP, Grafman J, Tranel D. Frontal lobe lesions and electrodermal activity: effects of significance. Neuropsychologia. 1999;37:1227–1241. doi: 10.1016/s0028-3932(99)00020-2. [DOI] [PubMed] [Google Scholar]
- Zhang S, Li CS. A neural measure of behavioral engagement: task-residual low-frequency blood oxygenation level-dependent activity in the precuneus. Neuroimage. 2010;49:1911–1918. doi: 10.1016/j.neuroimage.2009.09.004. [DOI] [PMC free article] [PubMed] [Google Scholar]
- Zhang S, Li CS. Functional networks for cognitive control in a stop signal task: Independent component analysis. Hum Brain Mapp. 2012a;33:89–104. doi: 10.1002/hbm.21197. [DOI] [PMC free article] [PubMed] [Google Scholar]
- Zhang S, Li CS. Functional connectivity mapping of the human precuneus by resting state fMRI. Neuroimage. 2012b;59(4):3548–3562. doi: 10.1016/j.neuroimage.2011.11.023. [DOI] [PMC free article] [PubMed] [Google Scholar]
Associated Data
This section collects any data citations, data availability statements, or supplementary materials included in this article.