

Abstract
Advanced bone imaging with quantitative computed tomography (QCT) has had limited success in significantly improving fracture prediction beyond standard areal bone mineral density (aBMD) measurements. Thus, we examined whether a machine learning paradigm, gradient boosting machine (GBM) modeling, which can incorporate diverse measurements of bone density and geometry from central QCT imaging and of bone microstructure from high-resolution peripheral QCT imaging, can improve fracture prediction. We studied two cohorts of postmenopausal women: 105 with and 99 without distal forearm fractures (Distal Forearm Cohort) and 40 with at least one grade 2 or 3 vertebral deformity and 78 with no vertebral fracture (Vertebral Cohort). Within each cohort, individual bone density, structure, or strength variables had areas under receiver operating characteristic curves (AUCs) ranging from 0.50 to 0.84 (median 0.61) for discriminating women with and without fracture. Using all possible variables in the GBM model, the AUCs were close to 1.0. Fracture predictions in the Vertebral Cohort using the GBM models built with the Distal Forearm Cohort had AUCs of 0.82–0.95, while predictions in the Distal Forearm Cohort using models built with the Vertebral Cohort had AUCs of 0.80–0.83. Attempts at capturing a comparable parametric model using the top variables from the Distal Forearm Cohort resulted in resulted in an AUC of 0.81. Relatively high AUCs for differing fracture types suggest that an underlying fracture propensity is being captured by this modeling approach. More complex modeling, such as with GBM, creates stronger fracture predictions and may allow deeper insights into information provided by advanced bone imaging techniques.
Keywords: BONE DENSITY, BONE QUALITY, QCT, VERTEBRAL FRACTURE, DISTAL FOREARM FRACTURE, GRADIENT BOOSTING
Introduction
Advanced bone imaging methodologies, such as quantitative computed tomography (QCT) and high-resolution peripheral QCT (HRpQCT), can measure numerous bone macro- and microstructural properties, along with volumetric bone mineral density (vBMD) of cortical and trabecular bone separately (1,2). Recent publications examining the relative ability of these different measurements to assess fracture risk have focused primarily on each measurement individually, which is helpful to better understand whether certain attributes of bone can discriminate between those with and without fractures (3–11). The focus has generally been on bone imaging measurements that are better understood, such as vBMD or cortical thickness. However, there is a potential for increased predictive ability when all available measurements are used in a multivariable approach, including measurements produced by these scanners that are less understood but which also may relate to the structural and biomechanical properties of bone. Additionally, more complex modeling allows for non-linear relationships and interactions between variables. Statistical learning is a framework used extensively in finance and industry to predict outcomes, such as the price of a stock in six months (12). Many of these approaches, of which gradient boosting machines (GBM) are a particular instance, focus on improved prediction by combining information from many variables that individually may not be significant but together are very informative; of less concern is the functional form of any one variable. Indeed, these methods have often been successful even when the predictors are highly related. The goal of our study was to use GBM to determine whether prediction of specific fractures can be improved by incorporating additional information available from the scanners and to assess whether the resulting models that are useful for one kind of fracture are equally robust for predicting fractures of another type. Moreover, we hoped to evaluate the potential usefulness of underutilized measurements available from newer bone imaging devices.
Methods
Study subjects
As previously described,(13) we identified 99 postmenopausal community women ≥ 50 years of age who were newly diagnosed with a distal forearm (Colles’) fracture in 2001–08. The fracture cases were frequency matched to 105 postmenopausal controls recruited from an age-stratified random sample of Olmsted County, MN women (Distal Forearm Cohort). None of the controls had a history of an osteoporotic fracture, ie, a hip, spine or forearm fracture that occurred after age 35 years.
Similarly, we recruited 40 postmenopausal Olmsted County women ≥ 50 years of age who had a moderate-to-severe vertebral fracture that was clinically diagnosed within the past 5 years.(14) They were compared to 78 controls with no vertebral fracture who were recruited from the same age-stratified random sample of community women (Vertebral Cohort). The 78 controls were also controls in the Distal Forearm Cohort. Seven subjects were cases in both the Distal Forearm Cohort and in the Vertebral Cohort. Thoracic and lumbar vertebral body fractures were assessed according to the semiquantitative method(15) from the QCT lateral localizer images, which have no projection distortion and a nominal resolution of 0.5 mm. Deformities were classified as mild (grade 1), moderate (grade 2) or severe (grade 3), although only the latter two groups were included in this analysis.
Women with distal forearm or vertebral fractures due to severe trauma or to a specific pathological process were excluded, as was anyone who had undergone vertebroplasty or intermittent parathyroid hormone therapy. Women treated with antiresorptive drugs (bisphosphonates, hormone therapy or selective estrogen receptor modulators [SERM]) were included, however, as these agents do not appear to greatly alter bone structure.(16) Each subject at the time of study visit also underwent anthropometric assessment, which included measurement of height to the nearest 0.1 cm and weight in light clothes without shoes to the nearest 0.1 kg. Written informed consent was obtained from all subjects.
Bone density and structure measurements
Hip, forearm, and total body areal BMD (aBMD) were made by dual-energy x-ray absorptiometry (DXA) using the Lunar Prodigy system (GE Healthcare, Madison, WI), and evaluated according to technical criteria from the International Society of Clinical Densitometry.(17) Osteoporosis and osteopenia were defined by World Health Organization criteria,(18) using femoral neck (FN) T-scores from the Lunar device. In addition to aBMD measurements, approximately 60 other bone and soft tissue parameters were available from DXA scans, as documented in the Appendix.
FN and LS vBMD and geometry were assessed by single-energy spiral QCT using a 64-channel system (Somatom Sensation 64, Siemens Healthcare, Forcheim, Germany). In addition to total vBMD, we also measured trabecular vBMD in the central 70% of the midportion of the vertebral bodies and non-dominant FN. A number of bone macrostructure measurements were derived, including total cross-sectional area, moment-of-inertia, section modulus and cortical thickness, recognizing that thickness of the cortical shell is overestimated in the vertebrae due to volume averaging artifacts.(19,20) In addition to overall summaries for a mid-portion of the FN and vertebrae, many of the measurements were summarized within quadrants (posterior [P], superior [S], anterior [A], and inferior [I]). Finally, we included in the analysis a large number of additional variables as defined in the Appendix.
In lieu of detailed trabecular microstructure data for the spine or hip, we evaluated the non-dominant distal radius and tibia by HRpQCT (XtremeCT, Scanco Medical AG, Brüttisellen, Switzerland). As described elsewhere, (21) distal radius or tibia trabecular bone volume/total volume fraction (BV/TV) was derived from trabecular vBMD. A thickness-independent structure extraction was used to identify three-dimensional ridges (centers of the trabeculae), and trabecular number (Tb.N) was then taken as the inverse of the mean spacing of the ridges.(22) Analogous with standard histomorphometry,(23) trabecular thickness (Tb.Th) was calculated as BV/TV ÷ Tb.N, and trabecular separation (Tb.Sp) as (1-BV/TV) ÷ Tb.N. Tb.Sp.SD, the standard deviation of Tb.Sp, is a measure of trabecular variation.(24) Validation studies show excellent correlation (R≥0.96) of these parameters with gold standard ex vivo μCT.(25) Trabecular architectural disruption was also assessed by connectivity density (Conn.D), and the structure model index (SMI) indicated whether trabeculae were more plate-like (lower values) or more rod-like (higher values). We recognize that there may be significant limitations to measuring SMI using HRpQCT. Thus, MacNeil and Boyd (26) found relatively poor correlations (R2 = 0.075) for SMI measured by HRpQCT versus μCT. By contrast, unpublished data from Scanco Medical AG (Brüttisellen, Switzerland) suggests that SMI measured by HRpQCT correlates well with that measured using μCT. For this, 15 different 1 cm x1 cm x 1 cm radius cubes (BV/TV range, 0.04–0.19) from human donors were scanned with μCT (20 microns) and then with HRpQCT using the standard patient protocol resolution (82 microns); SMI showed an R2 of 0.94 between the results from the two scanners. The distal radius or tibia cortex was segmented from the gray scale image with a Gaussian filter and threshold.(22) Cortical vBMD and area were measured directly and the periosteal circumference calculated from the contour; cortical thickness (Ct.Th) was then calculated as Area ÷ Circumference. Excellent correlation (R=0.98) has also been shown with Ct.Th measurements by μCT (26). Total and cortical section modulus, as well as components of these measurements, were also included. Again, we also included numerous additional variables produced by the device as defined in the Appendix.
Statistical analysis
Before fitting the GBM models, each bone variable was age-standardized by fitting a linear regression model using all subjects in both study cohorts, extracting the residuals, then adding to that the overall mean, ie, presenting the variables as if they were all measured on 68-year-old women (overall mean age of the cohorts). We used the R package GBM (27) to build separate prediction models for distal forearm and for vertebral fractures. The shrinkage penalization, which controls the rate of optimization in the model, was set at 0.01 (values closer to 1 are computationally faster but less accurate). Tree complexity controls the maximum number of interactions, and in these models, was set at three (ie, 2 and 3-way interactions were allowed) for the main analysis. The number of steps or terms in the fit was determined by cross-validation to prevent overfitting. Note that the GBM program utilizes a stochastic (random) component in the fitting process; stochastic methods are well established, but are normally only necessary for the most difficult maximization problems. One consequence of this is that the final solution will differ slightly from one run to another on the data. Multiple runs were done to verify that this had only minor impact on the results. Resulting models were further evaluated by exploration of functional form plots (ie, looking for indications of non-linearity or interactions).
Models were fit predicting fracture status (case versus control) using both the Distal Forearm Cohort and the Vertebral Cohort. Separate models were fit using the HRpQCT variables, the spiral QCT variables, the DXA variables, or all three sets of variables as indicated in Figure 1. All models included height, weight, body mass index (BMI), and FN aBMD since these are standard measurements used to assess fracture risk. The GBM model developed to predict distal forearm fractures in the Distal Forearm Cohort was then used to predict vertebral fracture status in the Vertebral Cohort and vice versa. As a secondary analysis, the top 10 variables from the model using all three sets of variables were used to create a logistic regression model using interactions and splines to determine whether the predictive ability of these variables could be captured in a more standard model. Logistic regression and stepwise model selection were used when attempting to build this model. As an expression of fracture discrimination, the area under a receiver operating characteristic curve (AUC) was assessed using the predictive values from the various GBM and logistic models.(28) Analyses were performed using R version 2.11.0 (R Foundation for Statistical Computing, Vienna, Austria) and SAS 9.2 (SAS Institute Inc., Cary, NC).
Figure 1.
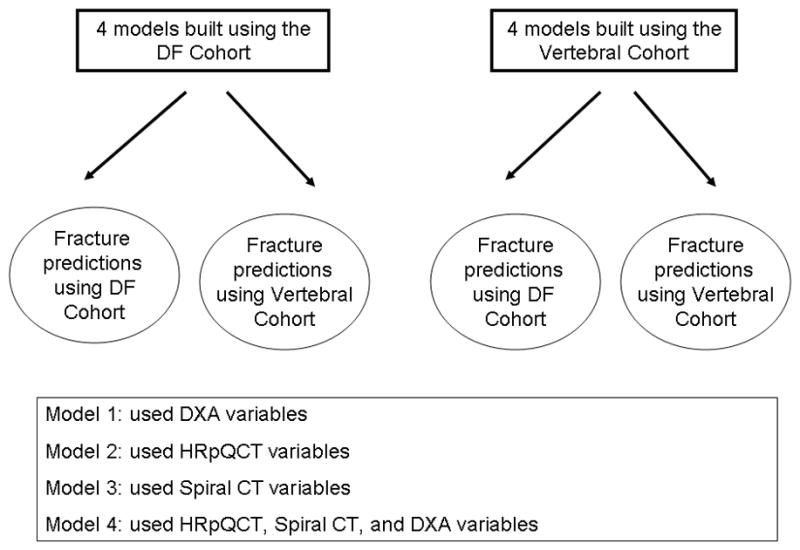
Design of the analysis whereby a model predicting distal forearm fractures in the Distal Forearm Cohort was also used to predict fractures in Vertebral Cohort and vice versa.
Results
Table 1 summarizes the AUCs when the various distal forearm fracture models were used to extract predictions for the Distal Forearm Cohort and for the Vertebral Cohort. For the Distal Forearm Cohort there were 267 bone density, structure, or strength variables available for use in the analysis (Appendix); individually they had AUCs for predicting forearm fracture outcomes ranging from 0.50 to 0.71 (median 0.61). FN aBMD, a standard measurement used clinically, had an AUC of 0.68. When only HRpQCT variables along with FN aBMD, height, weight and BMI were used in the GBM modeling, the AUC was significantly higher at 0.96. Similarly, when only DXA variables or only spiral QCT variables were used instead of HRpQCT variables, the resulting AUCs were quite high (0.95 and 1.0, respectively). Using all 267 variables (DXA, HRpQCT, spiral QCT) also produced an AUC of 1.00.
Table 1.
Area under the curve (AUC) as obtained for each of the ten fracture prediction models, as derived either from the Distal Forearm Cohort or the Vertebral Cohorts and then applied to both cohorts.
| Endpoint used to create prediction model | Predictors used in models | Models applied to Distal Forearm Cohort | Models applied to Vertebral Cohort |
|---|---|---|---|
| Distal forearm fracture in Distal Forearm Cohort | DXA FN aBMD* | 0.68 | 0.68 |
| DXA variables | 0.95 | 0.88 | |
| HRpQCT variables | 0.96 | 0.82 | |
| Spiral QCT variables | 1.00 | 0.94 | |
| HRpQCT, Spiral QCT, and DXA variables | 1.00 | 0.95 | |
| Vertebral fracture in Vertebral Cohort | DXA FN aBMD* | 0.69 | 0.69 |
| DXA variables | 0.78 | 0.99 | |
| HRpQCT variables | 0.80 | 0.95 | |
| 5Spiral QCT variables | 0.80 | 1.00 | |
| HRpQCT, Spiral QCT, and DXA variables | 0.83 | 1.00 |
The model including only femoral neck aBMD was fit using univariate logistic regression; all other models were fit using GBM. The GBM models all included femoral neck aBMD, BMI, height, and weight in the list of candidate variables.
Because AUC values are artificially high when models and predictions are based on the same data, we also applied the prediction models developed from the Distal Forearm Cohort models to data from the Vertebral Cohort. When the distal forearm fracture GBM model with only HRpQCT variables was applied to the Vertebral Cohort, the AUC for predicting vertebral fractures dropped considerably, to 0.82. The AUC was 0.88 when the distal forearm GBM model using only DXA variables was applied to the Vertebral Cohort. The distal forearm GBM model using all three sets of variables provided the best overall prediction of vertebral fractures, with an AUC of 0.95.
Table 1 also summarizes the AUCs when the various vertebral fracture models were used to generate predictions for the Vertebral Cohort and the Distal Forearm Cohort. For the Vertebral Cohort, the 267 available variables used in the GBM models had AUCs ranging from 0.50 to 0.84 (median=0.61) for discriminating those with and without vertebral fractures when used individually. For predicting vertebral fracture, the AUC for FN aBMD was 0.69. Using the HRpQCT measurements alone in the GBM model improved the AUC markedly to 0.95. Using the DXA measurements alone in the GBM model resulted in an AUC of 0.99. Using the spiral QCT variables alone or using the combination of DXA, HRpQCT, and spiral QCT variables, the AUCs were 1.00. Although the GBM model fit using only DXA variables produced a high AUC, the spiral QCT variables dominated the top 20 list when all HRpQCT, spiral QCT, and DXA variables were included in the modeling process.
As shown in Table 1, when the vertebral fracture GBM models derived from the Vertebral Cohort were applied to the Distal Forearm Cohort, the AUCs for predicting a distal forearm fracture ranged from 0.78 to 0.83.
Figure 2 shows the predicted probability of a distal forearm fracture for subjects, grouped by the traditional FN aBMD T-score classification (osteoporotic, osteopenic, normal). The predictions come from the GBM model using the HRpQCT variables plus BMI, height, weight, and FN aBMD as applied to the Distal Forearm Cohort. Higher probabilities of fracture were observed for those subjects who experienced a distal forearm fracture; and, as might be expected, the subset of osteoporotic subjects (as defined by FN aBMD T-score) had the highest predicted probability of fracture. Similarly, women defined as osteoporotic who had not yet developed a fracture were identified as being at higher risk for fracture compared with women who were defined as osteopenic or having normal FN aBMD but had not yet developed a fracture.
Figure 2.
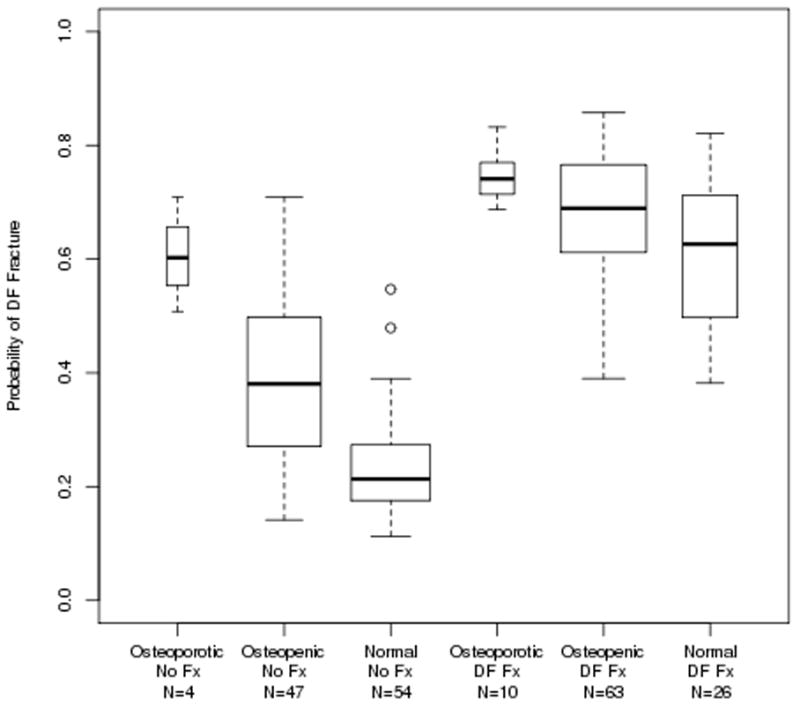
Boxplots of the probability of a distal forearm fracture as predicted by the model fit using the Distal Forearm Cohort using the HRpQCT variables, plus BMI, height, weight, and femoral neck aBMD. The box boundaries show the 25th and 75th percentiles of the values and the middle line is drawn at the median value.
Interestingly, women with normal FN aBMD who had experienced a distal forearm fracture were clearly identified as being at high risk for fracture and were distinguished from women with normal FN aBMD but no forearm fracture. Based on the fracture predictions derived from the GBM model using the spiral QCT variables plus BMI, height, weight, and FN aBMD and applied to the Vertebral Fracture Cohort, Figure 3 shows an even stronger separation between vertebral fracture and non-fractured subjects, irrespective of FN aBMD T-score group.
Figure 3.
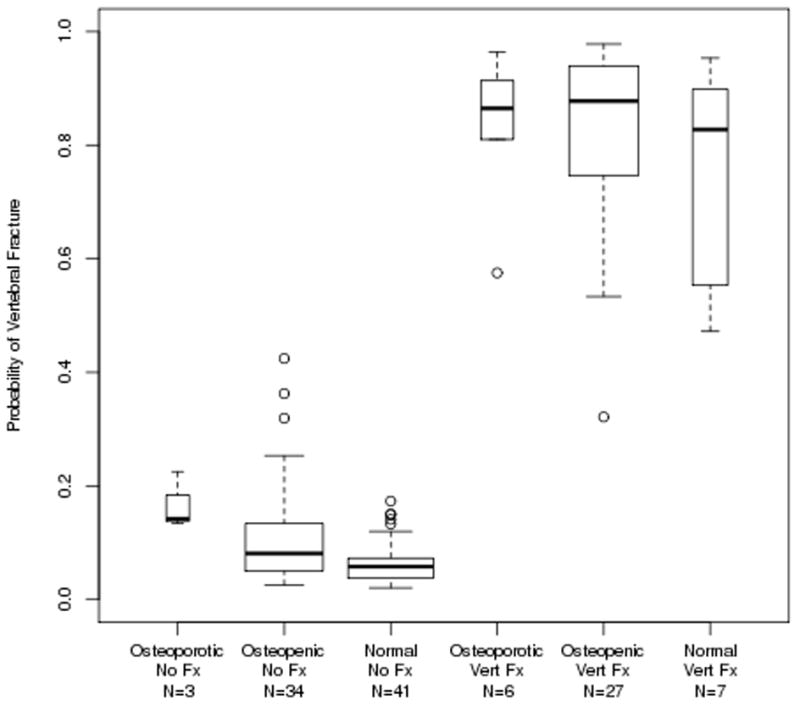
Boxplots of the probability of a moderate-to-severe vertebral fracture as predicted by the model fit using the Vertebral Cohort using the spiral QCT variables, plus BMI, height, weight, and femoral neck aBMD.
Table 2 lists the top twenty variables included in each of the four GBM models fit using the Distal Forearm Cohort. Given the stochastic approach used in this modeling, the variables chosen differed somewhat each time the model was fit; however, the predictive ability was consistent when the modeling process was repeated 100 times. Additionally, for the model fit using the HRpQCT variables, the tibia structure model index (SMI) was consistently the top variable listed when the models were run multiple times, while radius cortical density and SMI were consistently among the top variables. Less familiar variables such as Radius Imin/Cmin (mm^3), the radius total section modulus relative to the larger main axis of inertia, and Radius Imax (mm^4), also appeared in the top 20 variables. When the models were fit using only these 20 variables, the resulting AUC values were quite similar to those using all variables, due in part to the strong correlation between all of these measurements. When only the 9 top variables were used, the AUC dropped slightly to 0.94, suggesting that there may be a minimum number of variables necessary to create these models. When these reduced distal forearm models were applied to the Vertebral Cohort, the AUC similarly dropped slightly to 0.80. When all HRpQCT, spiral QCT, and DXA variables were included in the modeling process, the spiral QCT variables dominated the top 20 list.
Table 2.
Top 20 variables (defined in the Appendix) from the GBM models predicting distal forearm fractures that were fit using the Distal Forearm Cohort. All models included femoral neck aBMD (fnbmd), BMI, height, and weight in the list of candidate variables; these 4 variables are included in the variable count. See Appendix for a definition of each of the variables.
| 67 HRpQCT variables | 144 Spiral QCT variables | 62 DXA variables | 267 HRpQCT, Spiral QCT, and DXA variables | |||||
|---|---|---|---|---|---|---|---|---|
| Variable | Relative influence | Variable | Relative influence | Variable | Relative influence | Source of Variable | Variable | Relative influence |
| smi_tib | 10.7 | vmncdist2 | 5.5 | duubmc | 8.7 | SpiralCT | vcentx | 5.7 |
| cdens_rad | 6.2 | vcentx | 5.3 | duubmd | 7.2 | SpiralCT | vmncdist2 | 4.7 |
| smi_rad | 6.2 | vsdcdist3 | 4.5 | ftarea | 4.8 | SpiralCT | vsdcdist3 | 4.2 |
| weight | 4.4 | vtmaxbmdv | 4.1 | fhipbmd | 4.3 | HRpQCT | smi_tib | 3.7 |
| d100_tib | 4.0 | nlength | 3.8 | du13area | 4.2 | SpiralCT | vtmaxbmdv | 3.0 |
| bmi | 3.8 | vsdcdist1 | 3.6 | fnbmd | 4.0 | SpiralCT | vsdcth2 | 2.5 |
| fnbmd | 3.5 | vwtcentx | 3.4 | fhiparea | 3.8 | SpiralCT | nsdcdist2 | 2.4 |
| dtrab_tib | 3.2 | vsdcth2 | 3.1 | blegsbmd | 3.5 | SpiralCT | vwtcentx | 2.4 |
| cdens_tib | 2.8 | nsdcdist2 | 3.0 | blegsfat | 2.5 | SpiralCT | nlength | 2.3 |
| moi_cort_mn_tib | 2.6 | vmndist2 | 2.8 | barmsarea | 2.5 | SpiralCT | ncstdbmdv | 2.2 |
| ttbn_rad | 2.5 | ncstdbmdv | 2.6 | fwbmd | 2.4 | HRpQCT | smi_rad | 2.2 |
| ttbsp_tib | 2.4 | fnbmd | 2.0 | bodybmc | 2.3 | SpiralCT | vsdcdist1 | 2.1 |
| ttbth_rad | 2.3 | nhentr | 1.8 | du13bmd | 2.2 | SpiralCT | nsdcdist3 | 1.9 |
| connd_tib | 2.3 | nsdcdist3 | 1.8 | ftbmd | 2.2 | SpiralCT | vmndist2 | 1.9 |
| ttb1_nsd_rad | 2.1 | ncbmdv | 1.7 | dulnaarea | 2.2 | SpiralCT | vcminbmdv | 1.5 |
| imin_cmin_tot_mn_rad | 2.1 | nctmaxbndv | 1.7 | bodybmd | 2.0 | DXA | duubmc | 1.4 |
| imax_tot_mn_rad | 2.0 | ncminbmdv | 1.5 | dulnabmd | 1.8 | DXA | duubmd | 1.3 |
| ttbn_tib | 2.0 | vsdcdist4 | 1.5 | drubmd | 1.8 | SpiralCT | vsdcdist2 | 1.2 |
| imax_cmax_tot_mn_tib | 1.8 | nctstdbmdv | 1.4 | barmsfat | 1.7 | SpiralCT | vmncdist4 | 1.2 |
| ctpm_rad | 1.7 | vmncdist | 1.4 | btotln | 1.7 | SpiralCT | vctminbmdv | 1.1 |
| AUC | 0.96 | 1.0 | 0.95 | 1.0 | ||||
Table 3 shows the top twenty variables included in each of the four the GBM models fit using the Vertebral Cohort. As was true with the Distal Forearm Cohort, variables such as cortical density and SMI were among the top listed HRpQCT variables. The strongest predictor among the models fit using only the spiral QCT variables was a measure of variability within the FN cortical vBMD measurement, followed by vertebral histogram entropy and overall vertebral trabecular vBMD. When the model building was limited to these three variables, the AUC for predicting a vertebral fracture was essentially unchanged. The strongest predictor among the models fit using only the DXA variables was ultradistal ulna aBMD followed by the area of the femoral shaft and total fat measured in the arms. Although the GBM model fit using only DXA variables produced a high AUC, the spiral QCT variables dominated the top 20 list when all HRpQCT, spiral QCT, and DXA variables were included in the modeling process.
Table 3.
Top 20 variables (defined in the Appendix) from the GBM models predicting vertebral fractures that were fit using Vertebral Cohort. All models included femoral neck aBMD (fnbmd), BMI, height, and weight in the list of candidate variables. See Appendix for a definition of each of the variables.
| 67 HRpQCT variables | 144 Spiral QCT variables | 62 DXA variables | 267 HRpQCT, Spiral QCT, and DXA variables | |||||
|---|---|---|---|---|---|---|---|---|
| Variable | Relative influence | Variable | Relative influence | Variable | Relative influence | Source of Variable | Variable | Relative influence |
| d100_tib | 11.0 | ncstdbmdv | 14.5 | duubmd | 9.7 | SpiralCT | ncstdbmdv | 14.2 |
| smi_rad | 7.5 | vhent | 10.8 | fsarea | 6.8 | SpiralCT | vtbmdv | 8.4 |
| ttbth_rad | 5.3 | vtbmdv | 9.3 | barmsfat | 5.9 | SpiralCT | vhent | 8.3 |
| cdens_tib | 5.3 | vsdcdist3 | 5.1 | fnarea | 5.4 | SpiralCT | vsdcdist3 | 4.8 |
| fnbmd | 5.0 | vbmdv | 4.7 | ftbmd | 4.2 | SpiralCT | vbmdv | 4.4 |
| imax_cmax_tot_mn_rad | 4.2 | ntminbmdv | 2.8 | drubmd | 4.0 | SpiralCT | vsdcth4 | 2.2 |
| ttb1_nsd_tib | 4.2 | vsdcth4 | 2.7 | barmsarea | 3.9 | SpiralCT | ntminbmdv | 2.0 |
| d100_rad | 3.9 | ncmaxbmdv | 2.3 | blegsarea | 3.5 | HRpQCT | cdens_tib | 2.0 |
| imax_cmax_cort_mn_tib | 3.2 | ntbmdv | 2.2 | du13area | 3.2 | SpiralCT | ncmaxbmdv | 1.8 |
| imin_cmin_tot_mn_tib | 3.2 | vsdcdist2 | 2.1 | bodyarea | 2.9 | SpiralCT | vsdcdist2 | 1.7 |
| dtrab_rad | 3.0 | nsdcth3 | 1.7 | duubmc | 2.7 | DXA | drubmd | 1.5 |
| trabarea_rad | 2.8 | ntstdbmdv | 1.6 | dr13area | 2.6 | DXA | fsarea | 1.5 |
| cth_tib | 2.5 | vmncdist2 | 1.5 | dtubmd | 2.5 | HRpQCT | d100_tib | 1.4 |
| cortarea_rad | 2.1 | vmncth1 | 1.5 | fhipbmd | 2.3 | DXA | duubmd | 1.4 |
| imax_cort_mn_rad | 1.9 | vsdcth | 1.3 | dulnaarea | 2.1 | SpiralCT | nsdcth3 | 1.3 |
| dtrab_tib | 1.8 | vwtcentx | 1.3 | blegsbmd | 2.1 | SpiralCT | vmncdist2 | 1.3 |
| ctpm_tib | 1.7 | vtrac | 1.2 | blegsfat | 1.9 | DXA | fnarea | 1.3 |
| connd_tib | 1.7 | nhent | 1.1 | bspibmc | 1.8 | SpiralCT | vcentx | 1.2 |
| weight | 1.5 | nmncth3 | 1.0 | duuarea | 1.8 | HRpQCT | smi_rad | 1.1 |
| height | 1.5 | vcenty | 1.0 | fsbmd | 1.8 | DXA | dr13bmc | 1.0 |
| AUC | 0.95 | 1.00 | 0.99 | 1.00 | ||||
As a secondary analysis, an attempt was made to mimic the distal forearm prediction model using a traditional logistic regression approach, with interactions and quadradic and cubic terms to capture the non-linearity, using the top ten HRpQCT variables listed in Table 2 (first column). As applied to the Distal Forearm Cohort, the model it was built with, the AUC was 0.81 compared to 0.96 using the GBM approach. When this alternative Distal Forearm model was applied to data from the Vertebral Cohort, the AUC dropped to 0.73. Additionally, the need for interactions within the GBM framework was investigated by fitting a GBM model with a tree complexity setting of one. This resulted in an AUC of 0.88 in the Distal Forearm Cohort, indicating that interactions play an important role in the GBM model.
Discussion
Using the GBM modeling approach and taking advantage of all of the variables produced by the DXA, HRpQCT and spiral QCT scanners, we were able to differentiate fracture and non-fracture subjects with surprisingly high predictive ability, with AUCs near 1.0 for predicting distal forearm fractures in the Distal Forearm Cohort and vertebral fractures in the Vertebral Cohort. There is, of course, a possibility that the models may be overfitted, thereby producing results better than would be obtained applying these models to new data; however, prediction was still strong when each model was applied to the other fracture type, suggesting that these models may be capturing underlying fracture susceptibility attributes, regardless of fracture type. Of particular note, using parameters derived from these advanced bone imaging measurements, and no clinical information, GBM models predicted the increased fracture risk among women who were considered osteopenic or had normal bone density by DXA (Figs. 2 and 3). These results suggest that there are structural parameters assessed by QCT and/or HRpQCT which have unique biomechanical interactions that are contributing to diminished bone strength and predisposing these women to fracture; these are clearly not being captured by aBMD T-scores. On the other hand, use of all DXA measurements together may prove more useful than relying on only a handful of standard DXA values.
These results further illustrate the utility of such novel modeling approaches to help better identify previously understudied measurements currently being captured by DXA, QCT and HRpQCT scanners that may allow us to improve our understanding of the factors contributing to bone fragility. Indeed, the data presented in Tables 2 and 3 strongly suggest that potentially important information is being ignored when we focus only on the well characterized skeletal parameters such as aBMD, vBMD and cortical thickness. Although it is unclear at present what attributes some of the HRpQCT variables are capturing, our results provide the rationale for additional biomechanical analyses that will be needed to better understand the implications of relatively understudied skeletal parameters such as radius mean Imax. Moreover, one of the important concepts in data mining is that small contributions from many variables can lead to high quality predictions (29). Thus, rather than devise ever newer imaging techniques, there may be opportunities for better analysis of currently available data.
There are many possible machine learning methods available, such as neural networks and support vector machines (12), but we chose GBM for three primary reasons: there is evidence that boosting methods are one of the approaches least affected by overfitting; the models can accommodate both continuous and categorical variables; and software is readily available in the R statistical package (27). Moreover, GBM models have the advantage over logistic regression in that non-linearity and interactions between variables can be captured without prior specification, which is of obvious importance in the search for new fracture prediction parameters. Moreover, GBM incorporates the stochastic component, eg falling, that is so important in fracture pathogenesis. No intimation is implied or intended that ours is the “best” method: the point made here is that important information is contained within the currently collected variables which analytic methods such as this may be able to extract.
“Boosting” is a process that combines many separate prediction rules, some of which may be quite weak on their own, to produce a more powerful combined classifier. It is an important concept that has been discussed in the machine learning literature for the past twenty years (29). Gradient boosting, which combines ideas of boosting with classification trees, was introduced by Friedman in 1999, who clarified its relation to several other important statistical methods including lasso, bagging, and stage-wise models.(30–32). Applications of the GBM approach to deal with complex sets of variables can be seen in the ecology literature, (33–35), but this approach has rarely been applied in the analysis of medical data.
In several of our models, SMI derived from the HRpQCT parameters appeared as a significant predictive parameter for fracture. As noted earlier in the Methods, HRpQCT may not accurately measure SMI (26). Despite this limitation, we chose to include SMI in our models as it likely does reflect some “quality” of trabecular bone that is being assessed by HRpQCT, even if that quality is not the true SMI as assessed by μCT.
In this report, we have demonstrated the potential power of the GBM approach to provide better fracture prediction models by re-analyzing existing information. It must be recognized, of course, that the resulting models were derived from our own specific datasets and need to be validated by others both in a case-control study such as this and using longitudinal cohort data. As such, our work represents mathematical prediction models that require further validation for the prospective clinical prediction of fractures. Nonetheless, our results provide some sense of an upper bound on how well we might expect to do with a given set of variables. Moreover, by including heretofore underutilized information provided not only by newer imaging devices but also existing DXA scanners, we were able to identify new variables for exploration. Although it is highly unlikely that DXA, HRpQCT and spiral QCT assessments would all be combined in routine clinical practice, the goal of this preliminary study was instead to illustrate the potential of a novel statistical approach for obtaining deeper insights into predictor variables that might improve fracture risk assessment. Ultimately, the hope is that an approach such as this would be used by researchers to incorporate new prediction algorithms into scanners in order to provide increased predictive ability of fractures within the clinical setting.
Supplementary Material
Acknowledgments
This work was supported by research grants R01-AR027065 and UL1-RR024150 (Center for Translational Science Activities) from the National Institutes of Health, U.S. Public Health Service. The authors would like to thank Margaret Holets for the HRpQCT, DXA, and Spiral QCT measurements, Lisa McDaniel, R.N., and Louise McCready, R.N., for their assistance in recruitment and management of the study subjects, and James Peterson for assistance with data management and file storage.
Footnotes
Conflict of interest: The authors have no relevant conflicts of interest to disclose.
Authors’ roles
Study design: EJA, SK, TMT. Study conduct: EJA, SK, TMT. Data collection: SJA, JJC, EJA. Data analysis: EJA, TMT. Data interpretation: EJA, TMT, SK. Drafting manuscript: EJA. Revising manuscript: SK, TMT, LJM, SA. Approving final version: EJA, TMT, LJM, JJC, SJA, SA, SK. Responsibility for integrity of data analysis: EJA.
References
- 1.Genant HK, Jiang Y. Advanced imaging assessment of bone quality. Ann N Y Acad Sci. 2006;1068:410–28. doi: 10.1196/annals.1346.038. [DOI] [PubMed] [Google Scholar]
- 2.van Lenthe GH, Müller R. CT-based visualization and quantification of bone microstructure in vivo. IBMS BoneKEy. 2008;5:410–425. [Google Scholar]
- 3.Boutroy S, Bouxsein ML, Munoz F, Delmas PD. In vivo assessment of trabecular bone microarchitecture by high-resolution peripheral quantitative computed tomography. J Clin Endocrinol Metab. 2005;90(12):6508–15. doi: 10.1210/jc.2005-1258. [DOI] [PubMed] [Google Scholar]
- 4.Melton LJ, 3rd, Riggs BL, van Lenthe GH, Achenbach SJ, Müller R, Bouxsein ML, Amin S, Atkinson EJ, Khosla S. Contribution of in vivo structural measurements and load/strength ratios to the determination of forearm fracture risk in postmenopausal women. Journal Bone Miner Res. 2007;22(9):1442–1448. doi: 10.1359/jbmr.070514. [DOI] [PubMed] [Google Scholar]
- 5.Melton LJ, 3rd, Riggs BL, Keaveny TM, Achenbach SJ, Hoffmann PF, Camp JJ, Rouleau PA, Bouxsein ML, Amin S, Atkinson EJ, Robb RA, Khosla S. Structural determinants of vertebral fracture risk. J Bone Miner Res. 2007;22(12):1885–92. doi: 10.1359/jbmr.070728. [DOI] [PubMed] [Google Scholar]
- 6.Sornay-Rendu E, Boutroy S, Munoz F, Delmas P. Alterations of cortical and trabecular architecture are associated with fractures in postmenopausal women, partially independent of decreased BMD measured by DXA: the OFELY Study. J Bone Miner Res. 2007;22(3):425–433. doi: 10.1359/jbmr.061206. [DOI] [PubMed] [Google Scholar]
- 7.Boutroy S, Van Rietbergen B, Sornay-Rendu E, Munoz F, Bouxsein ML, Delmas PD. Finite element analysis based on in vivo HR-pQCT images of the distal radius is associated with wrist fracture in postmenopausal women. J Bone Miner Res. 2008;23(3):392–9. doi: 10.1359/jbmr.071108. [DOI] [PubMed] [Google Scholar]
- 8.Vico L, Zouch M, Amirouche A, Frere D, Laroche N, Koller B, Laib A, Thomas T, Alexandre C. High-resolution pQCT analysis at the distal radius and tibia discriminates patients with recent wrist and femoral neck fractures. J Bone Miner Res. 2008;23 (11):1741–50. doi: 10.1359/jbmr.080704. [DOI] [PubMed] [Google Scholar]
- 9.Radspieler H, Frieling I, Dambacher MA, Neff M. In vivo assessment of 3-dimensional bone micro architecture with HR-pQCT in patients with and without fractures. Abstract. Journal of Bone and Mineral Research. 2008;23:S310. [Google Scholar]
- 10.Ladinsky GA, Vasilic B, Popescu AM, Wald M, Zemel BS, Snyder PJ, Loh L, Song HK, Saha PK, Wright AC, Wehrli FW. Trabecular structure quantified with the MRI-based virtual bone biopsy in postmenopausal women contributes to vertebral deformity burden independent of areal vertebral BMD. J Bone Miner Res. 2008;23(1):64–74. doi: 10.1359/JBMR.070815. [DOI] [PMC free article] [PubMed] [Google Scholar]
- 11.Sornay-Rendu E, Cabrera-Bravo J-L, Boutroy S, Munoz F, Delmas PD. Severity of vertebral fractures is associated with alterations of cortical architecture in postmenopausal women. Journal of Bone and Mineral Research. 2009;24:737–743. doi: 10.1359/jbmr.081223. [DOI] [PubMed] [Google Scholar]
- 12.Hastie TTR, Friedman J. The Elements of Statistical Learning, Data Mining, Inference, and Prediction Springer Series in Statistics. 2. Springer; New York: 2009. [Google Scholar]
- 13.Melton LJ, 3rd, Christen D, Riggs BL, Achenbach SJ, Muller R, van Lenthe GH, Amin S, Atkinson EJ, Khosla S. Assessing forearm fracture risk in postmenopausal women. Osteoporos Int. 2010;21(7):1161–9. doi: 10.1007/s00198-009-1047-2. [DOI] [PMC free article] [PubMed] [Google Scholar]
- 14.Melton LJ, 3rd, Riggs BL, Keaveny TM, Achenbach SJ, Kopperdahl D, Camp JJ, Rouleau PA, Amin S, Atkinson EJ, Robb RA, Therneau TM, Khosla S. Relation of vertebral fractures to bone density, structure and strength. J Bone Miner Res. 2010;25:1922–1930. doi: 10.1002/jbmr.150. [DOI] [PMC free article] [PubMed] [Google Scholar]
- 15.Genant HK, Jergas M. Assessment of prevalent and incident vertebral fractures in osteoporosis research. Osteoporosis International. 2003;14(Suppl 3):S43–55. doi: 10.1007/s00198-002-1348-1. [DOI] [PubMed] [Google Scholar]
- 16.Seeman E, Delmas PD. Bone quality--the material and structural basis of bone strength and fragility. N Engl J Med. 2006;354(21):2250–61. doi: 10.1056/NEJMra053077. [DOI] [PubMed] [Google Scholar]
- 17.ISCD. Official Positions of the International Society for Clinical Densitometry. 2007 doi: 10.1210/jc.2004-0124. updated 2007. Available from http://www.iscd.org/visitors/positions/OPReferences.cfm. [DOI] [PubMed]
- 18.Kanis JA, Melton LJ, III, Christiansen C, Johnston CC, Khaltaev N. The diagnosis of osteoporosis. Journal of Bone & Mineral Research. 1994;9(8):1137–41. doi: 10.1002/jbmr.5650090802. [DOI] [PubMed] [Google Scholar]
- 19.Silva MJ, Wang C, Keaveny TM, Hayes WC. Direct and computed tomography thickness measurements of the human, lumbar vertebral shell and endplate. Bone. 1994;15 (4):409–14. doi: 10.1016/8756-3282(94)90817-6. [DOI] [PubMed] [Google Scholar]
- 20.Prevrhal S, Fox JC, Shepherd JA, Genant HK. Accuracy of CT-based thickness measurement of thin structures: modeling of limited spatial resolution in all three dimensions. Med Phys. 2003;30(1):1–8. doi: 10.1118/1.1521940. [DOI] [PubMed] [Google Scholar]
- 21.Kirmani S, Christen D, van Lenthe GH, Fischer PR, Bouxsein ML, McCready LK, Melton LJ, 3rd, Riggs BL, Amin S, Müller R, Khosla S. Bone structure at the distal radius during adolescent growth. J Bone Miner Res. 2009;24(6):1033–1042. doi: 10.1359/JBMR.081255. [DOI] [PMC free article] [PubMed] [Google Scholar]
- 22.Laib A, Hauselmann HJ, Ruegsegger P. In vivo high resolution 3D-QCT of the human forearm. Technol Health Care. 1998;6(5–6):329–37. [PubMed] [Google Scholar]
- 23.Parfitt AM, Drezner MK, Glorieux FH, Kanis JA, Malluche H, Meunier PJ, Ott SM, Recker RR. Bone histomorphometry: standardization of nomenclature, symbols, and units. Report of the ASBMR Histomorphometry Nomenclature Committee. J Bone Miner Res. 1987;2(6):595–610. doi: 10.1002/jbmr.5650020617. [DOI] [PubMed] [Google Scholar]
- 24.Laib A, Newitt DC, Lu Y, Majumdar S. New model-independent measures of trabecular bone structure applied to in vivo high-resolution MR images. Osteoporos Int. 2002;13 (2):130–6. doi: 10.1007/s001980200004. [DOI] [PubMed] [Google Scholar]
- 25.Laib A, Ruegsegger P. Calibration of trabecular bone structure measurements of in vivo three-dimensional peripheral quantitative computed tomography with 28-μm-resolution microcomputed tomography. Bone. 1999;24(1):35–9. doi: 10.1016/s8756-3282(98)00159-8. [DOI] [PubMed] [Google Scholar]
- 26.MacNeil JA, Boyd SK. Accuracy of high-resolution peripheral quantitative computed tomography for measurement of bone quality. Med Eng Phys. 2007;29(10):1096–105. doi: 10.1016/j.medengphy.2006.11.002. [DOI] [PubMed] [Google Scholar]
- 27.Ridgeway G. Generalized Boosted Regression Models. CRAN; 2007. [Google Scholar]
- 28.DeLong ER, DeLong DM, Clarke-Pearson DL. Comparing the areas under two or more correlated receiver operating characteristic curves: A nonparametric approach. Biometrics. 1988;44(3):837–45. [PubMed] [Google Scholar]
- 29.Schapire RE. The strength of weak learnability. Machine Learning. 1990;5(2):197–227. [Google Scholar]
- 30.Friedman JH. IMS 1999 Reitz Lecture. 1999. Greedy function approximation: A gradient boosting machines. [Google Scholar]
- 31.Friedman JH. Stochastic gradient boosting Computational Statistics & Data Analysis. 2002;38 (4):367–378. [Google Scholar]
- 32.Friedman JH, Meulman JJ. Multiple additive regression trees with application in epidemiology. Stat Med. 2003;22(9):1365–81. doi: 10.1002/sim.1501. [DOI] [PubMed] [Google Scholar]
- 33.Elith JLJR, Hastie T. A working guide to boosted regression trees. Journal of Animal Ecology. 2008;77:802–813. doi: 10.1111/j.1365-2656.2008.01390.x. [DOI] [PubMed] [Google Scholar]
- 34.Hjort JMM. Periglacial distribution modelling with a boosting method. Permafrost and Periglacial Processes. 2008;20(1):15–25. [Google Scholar]
- 35.Jalabert SSMMMP, Renaud JP, Boulonne L, Jolivet C, Montanarella L, Arrouays D. Estimating forest soil bulk density using boosted regression modelling. Soil Use and Management. 2010;26(4):516–528. [Google Scholar]
Associated Data
This section collects any data citations, data availability statements, or supplementary materials included in this article.