

Abstract
Real-world objects can be viewed at a range of distances and thus can be experienced at a range of visual angles within the visual field. Given the large amount of visual size variation possible when observing objects, we examined how internal object representations represent visual size information. In a series of experiments which required observers to access existing object knowledge, we observed that real-world objects have a consistent visual size at which they are drawn, imagined, and preferentially viewed. Importantly, this visual size is proportional to the logarithm of the assumed size of the object in the world, and is best characterized not as a fixed visual angle, but by the ratio of the object and the frame of space around it. Akin to the previous literature on canonical perspective, we term this consistent visual size information the canonical visual size.
Keywords: canonical perspective, canonical viewpoint, visual size, physical size, object representation
In the real world, the particular view of an object (i.e., its projected retinal image) depends on where the observer is standing with respect to that object. This fact is implicitly understood by observers choosing where to sit in a movie theatre, where to stand in an art gallery, or where to move to get a better view of an item of interest. When observers walk around an object, changing the viewing angle of an object without changing its distance, this image transformation is called a perspective change. Similarly, when observers approach or back away from an object to change its retinal size within their visual field without changing the viewing angle, the image transformation is called a visual size change. Given the many possible object views that can be experienced by an observer, what information about perspective and size is present in object representations?
Seminal research by Palmer, Rosch, and Chase (1981) examined how object viewpoint information was accessed in a number of different tasks, and found evidence for consistently preferred viewpoints. For example, during goodness judgments of photographs of objects over different viewpoints, three quarter perspectives (in which the front, side, and top surfaces were visually present) were usually ranked highest.1 The “best” view was also the perspective imagined when given the name of the object, the view most photographed, and enabled fastest naming of objects. The consistencies across observers and across tasks led Palmer, Rosch, and Chase (1981) to term this view the “canonical perspective.”
Two main explanations have been suggested for why objects have a preferred, canonical perspective. One account is motivated by object properties, where the canonical perspective maximizes surface information visible with the least degree of self-occlusion. The other account argues that canonical perspective arises based on the distribution of visual experience. Evidence for the latter involves studies that control exposure with novel objects, and find speeded recognition arises at more-often experienced viewpoints (e.g., Bülthoff & Edelman, 1992; Tarr, 1995; Tarr & Pinker, 1989). However, canonical viewpoints can be found for novel objects that have been experienced equally from all angles in the viewing sphere (Edelman & Bulthoff, 1992), suggesting that a purely experiential account cannot fully predict the occurrence of canonical viewpoints. These explanations for canonical viewpoints reflect a trade-off between constraints of object-centered properties, where shape and orientation determines the best viewing angle, and viewer-centered properties, where accumulated episodes with that object influence the preferred viewing angle. Likely, both of these factors contribute to canonical perspective (Blanz, Tarr, & Bulthoff, 1999).
Perspective is determined by the physical orientation of the object relative to the direction of gaze of the observer. Similarly, visual size is determined by the physical size of the object relative to the distance of the observer to the object. Given that there is evidence for canonical perspective, is there similar evidence for canonical visual size? Here, we used memory, imagery, and perceptual preference tasks and asked whether these different mental processes yield consistent visual sizes across observers. In addition, we examined the contributions of two factors that might influence an object’s canonical visual size, real-world size and framing.
First, we might expect knowledge about the real-world size of the object to matter for an object’s canonical size. Intuitively, smaller objects in the world subtend smaller visual angles on average than larger objects in the world. For example, a typically sized car would subtend about 30 degrees visual angle at a typical viewing distance of ~9 m. For a penny to subtend that same visual angle it would have to be held only ~3 cm away from one eye; at a more typical arms-length viewing distance, it subtends 3.5 degrees. Thus, natural experience with objects might predict a systematic relationship between real-world size and canonical visual size. Alternatively, maximizing the available object information could determine canonical size, for example, if the object is centered in the high-acuity foveal or parafoveal region of the visual field. Such an account might predict that all objects would have the same canonical visual size that is related to acuity falloff with eccentricity, possibly modulated by the internal complexity of the surfaces features of the object.
Second, size judgments are strongly influenced by the relative size of an object within a fixed frame of space. In typical real-world viewing situations, a chair looks the same physical size as we approach it, despite the increasing visual size it projects on the retina—a phenomenon known as size constancy. However, failures of size constancy can be found when the frame of space around an object is manipulated. For example, Rock and Ebenholtz (1959) had observers adjust the length of one line to match the length of a standard line. The standard line was framed in a small rectangle, while the adjustable line was framed in a larger rectangle. Observers were strongly biased to preserve the ratio of the line within the frame, adjusting the line to be much larger than the standard, even though the task was to match the physical length of the two lines (see also Kunnapas, 1955).
This framing effect occurs not only for simple stimuli but also for objects in the real world, and is known as the vista paradox (Walker, Rupick, & Powell, 1989; see also Brigell, 1977; Senders, 1966). Approaching an object makes it physically closer, but approaching that object through the view of a window creates an illusion that the object is both shrinking in physical size and getting farther away. On the retina, both the visual size of the frame and the visual size of the object increase as one approaches; however, the ratio of the object in the frame decreases because the frame grows much more quickly than the more distant object. This illusion demonstrates that our perception of an object’s physical size and distance away are subject to relative framing ratios, and are not derived from visual angle alone.
In the current experiments, we examined whether or not existing object representations show evidence for a canonical visual size. Using a drawing task (Experiment 1), an imagery task (Experiment 2), and a perception task (Experiments 3, 4, and 5), we found that all these tasks gave rise to consistent visual sizes across observers and mental processes. We also observed a systematic and reliable correlation between canonical visual size of objects and the logarithm of their assumed size in the world. Further, we demonstrate that this canonical visual size is best characterized not as a fixed visual angle, but as a ratio reflecting the object size relative to the frame of space within which it is viewed.
Size Ranking
Observers have prior knowledge about the size of objects in the world, often referred to as “assumed size” (e.g. Ittleson, 1951; Baird, 1963; Epstein 1963). In the following experiments, we aimed to assess whether the assumed size of objects influences the visual size at which objects are accessed across different tasks. Thus, first we gathered 100 images of real-world objects and had observers sort these objects into 8 groups of increasing real-world size. These data will give us size ranks that reflect the assumed size of objects in the real world, and will be used in the rest of the experiments. The object images spanned the range of real-world sizes from small objects (e.g. a paper clip) to large objects (e.g. the Eiffel Tower; see Figure 1). Additionally, we examined how the size ranks compared with the actual real-world size of such objects.
Figure 1.

Left: Database of 100 objects. Right: All objects were sorted into 8 groups based on their assumed size in the world. These ranks are plotted as a function of the actual real-world size of the object (centimeters), on a logarithmic scale. The graph shows is a systematic logarithmic relationship between the actual physical size of the object and the size ranks.
Method
Six observers (age range 18–35) gave informed consent and received $5 for their participation. One hundred color pictures of real-world objects were selected from a commercial database (Hemera Photo-Objects, Vol. I and II), and all objects appeared on a white background (see Figure 1). The sorting procedure was adopted from Oliva and Torralba, 2001. Thumbnails of 100 objects were arrayed on a 30 in (64.5 × 40.5 cm) screen, with a line separating the left and right half of the screen. Participants were instructed to drag and drop the objects so that the large objects (large in their real-world size) were on one half of the screen and the small objects (small in real-world size) were on the other half of the screen. Next, the screen divided into fourths, and participants refined the two sets of objects into four groups. This processes repeated one more time so that the objects were divided into 8 groups, ranked by their size in the real world. Here, a rank of 1 represents the smallest object size and a rank of 8 represents the largest object size. Participants were told that they did not have to have an equal number of objects in each group and that instead they should make sure each category of objects had roughly the same physical size in the world. Participants could double click on a thumbnail to view a larger image of that object (15 × 15 cm). Stimuli were presented using software written in MATLAB.
Observers were instructed to sort objects based on their “real-world size”, and we did not explicitly instruct observers how to think of real-world size (e.g. volume, area, extent). To obtain a measure of the “actual size” of each depicted object, we used the following procedure. For each image a corresponding real-world object was measured or approximated. In the case of the larger objects, the dimensions were found using internet searches. The actual size of the object was quantified in centimeters (rather than cubic centimeter), measured as the diagonal of its bounding box (i.e., the smallest rectangle that completely enclosed the object), ignoring the depth of the object.2
Results
The left panel of Figure 1 shows thumbnails of the object set. We defined the size rank of each object as the mode of its rank distribution over the six observers. There were 9 to 23 objects for each size rank (mean 13 objects/size rank). Next we examined the relationship between the size ranks and the actual size of such objects in the world. The right panel shows the actual size of each object, plotted as a function of its size rank, with the actual size plotted on a logarithmic axis. The graph shows that size ranks and actual size are related by a logarthmic function. The correlation between size rank and log10 (actual size) is r2 = .91, p < .001.
These results suggest that when sorting objects by assumed size, judgments about which sizes are similar follow Weber-Fechner-like scaling (as do judgments about most other psychophysical variables, e.g. weight, sound intensity, frequency, etc; Stevens, 1957). For example, two objects at 1 and 10 m in size are more different that two objects at 1,001 and 1,010 m. Similar ranking procedures and results were found by Paivio (1975) and Moyer (1975).
These size ranks formed 8 groups of objects that were used in subsequent experiments. While we could use the actual size measured from real-world objects, the size ranks are used because (1) they reflect empirically gathered data about assumed size, and (2) provide natural bins of the assumed size dimension. However, it should be noted that the size rank reflects a logarithmic scaling of real-world size, thus any systematic relationship found with size rank also shows a similar systematic relationship with the logarithm of the real-world size of the object.
Experiment 1: Drawings from Memory
In Experiment 1, we used a drawing task to probe existing object representations, which is a task that requires reconstruction from long-term memory. Similar tasks have been used for studies of visual memory, but have typically been used as a measure of visual free recall of a previously studied image (e.g. Carmichael, Hogan, & Walters, 1932; Intraub & Richardson, 1989). Here, we instead probed preexisting long-term memory representations. The observers’ task was simply to draw a picture of the named object on the page. Unbeknownst to the observers, we were interested in the size at which they drew these objects.
One possibility is that all objects would be drawn at the same size on the page (or at the same visual angle). This might be predicted by classic alignment models of object recognition, which assume that all objects are stored at a specified visual size in memory, and recognition proceeds by first mentally scaling the input or the fixed template (e.g., Ullman, 1989). Another possibility is that there will simply be no consistent relationship between the drawn size of objects and the assumed size of those objects. Alternatively, there may be a systematic relationship between drawn size and assumed size, where a number of quantitative relationships are possible. Importantly, the task of drawing objects does not require explicit reasoning about the assumed size of the object nor does it require making judgments about the drawn size.
We also examined the role of the frame of space in which the object was drawn by manipulating the paper size across observers. If the frame serves as a ceiling for drawn object sizes, then we might predict that the physically small objects would be drawn the same size across paper sizes, but the physically larger objects would be drawn increasingly larger with bigger paper sizes. However, another possibility is that objects might be drawn with a consistent ratio of the object to the frame across paper sizes. This might be predicted if object representations are reactivated from long-term memory representations relative to a space around them.
Method
Sixty-four naïve observers (age range 18–35) participated in Experiment 1. All gave informed consent and received a candy bar and a beverage for their participation. Twenty observers drew on the small paper size, 22 observers draw on the medium paper size, and 22 observers drew on the large paper size.
Participants sat at a table and were given 18 sheets of paper (all of the same size) and a list of items to draw. They were instructed to draw one object per page and were explicitly told that we were not interested in artistic skills. We told participants to draw each object relatively quickly (within 1 min). When delivering the instructions, the word “size” was never used.
The list of items contained 16 different objects that spanned the range of real-world sizes, with two objects at each size rank. The objects were: paperclip, key, pet goldfish, apple, hairdryer, running shoe, backpack, computer monitor, German shepherd, chair, floor lamp, soda machine, car, dump truck, 1-story house, light house. The order of objects was randomized for each observer. After all 16 objects had been drawn, observers next drew two scenes, a beach and a park, in random order.
Across observers, we manipulated the size of the drawing paper. Observers were not aware of this manipulation. The small paper size was 7.6 × 11.4 cm (3 × 4.5 inches), the medium size 18.5 × 27.9 cm (was 7.3 × 11 inches), and the large size was 30.5 × 45.7 cm (12 × 18 inches), thus all three sizes had approximately the same aspect ratio. All observers used a fine black Sharpee marker to draw (i.e., the pen width was fixed, and did not scale with the paper size).
To measure the drawn size of the objects, all drawings were scanned at a fixed resolution (150 dots per inch). Custom software was written in MATLAB to automatically find the bounding box around the object in the image, and these dimensions were converted from pixels into centimeters using the known resolution. Drawn size was calculated as the length of the diagonal of the bounding box around the object. Using the diagonal, rather than as the height or width alone, better takes into account variation in aspect ratio and has been shown to account for more explained variance in relative size measures than height, width, principle axis, and area (Kosslyn, 1978). The software proceeded one drawing at a time, and each object’s identity and the corresponding bounding box was verified by eye.
Results
The first author and one additional observer used a strict criterion to filter any drawings with extraneous objects (e.g. trash bins behind the dump truck, a worm sticking out of the apple, cords connecting the floor lamps, headlight beams on cars, air coming out of the hairdryer), which constituted 21% of the images. The analysis reported below was conducted on the filtered data set (887 drawings).3
Figure 2 (left panel) shows the drawn size of the objects (in centimeters) plotted as a function of the size rank of the object. The three lines represent the three different paper sizes. A two-way ANOVA was conducted on drawn size with paper size as a between-subject factor and object size rank as a within-subject factor. There was a significant main effect of the size rank of the object on the drawn size of the object (F(7, 391) = 30.1, p < .001, ). That is, objects that are small in the world were drawn smaller on the page than objects that are large in the world. There was also a significant effect of paper size on drawn size (F(2, 41) = 70.9, p < .001, ), where the average drawn size of objects increased as the paper size increased. Additionally, there was a significant interaction between the paper size and the effect of the object size (F(14, 391) = 4.3, p < .001, ). In other words, there was a smaller range of drawn object sizes on the small paper, with progressively greater ranges of drawn sizes on the medium and large paper.
Figure 2.

Left: Drawn size of objects (measured in centimeters) as a function of their size rank, for small, medium, and large paper sizes. Right: Drawn size of objects (measured as the ratio of the drawn object and paper diagonal length), as a function of size rank for small, medium, and large paper size. There was a separate group of observers for each paper size. Error bars represent ± 1 SEM.
These data show a clear linear relationship between the drawn size and the size rank (r2 = 0.88, p < .001, collapsing across paper size). Thus, this also demonstrates that the drawn size of an object is proportional to the logarithm of its real-world size. For each participant, a regression analysis was used to estimate a slope and intercept for their drawn sizes as a function of the size rank. ANOVAs were conducted on these slopes and intercepts, with paper-size as a between-subject factor. There was a significant effect of paper size on slope (F(2, 61) = 28.7, p < .001, η2 = .48), and a significant effect of paper size on intercept (F(2, 61) = 15.1, p < .001, η2 = .33).
Across the 16 objects, the systematic variation in the drawn object sizes was highly consistent. The effective reliability R, which is the aggregate reliability from a set of judges (see Rosenthal & Rosnow, 1991) was R = .97.
Figure 2 (right panel) contains the same data as in the left panel, replotted to show the ratio of the drawn size of the object to the paper size. This was calculated as the diagonal length of the drawing divided by the diagonal length of the paper size. When considering the drawn size ratio, there was no longer an effect of paper size (F(2, 41) = 1.01, n.s.), whereas size rank still significantly influenced the drawn size of the object in the frame (F(7, 391) = 38.19, p < .001, ). However, there was a small, but significant, interaction between paper size and size rank (F(14, 391) = 1.82, p < .05, ), which indicates that some of the items had a slightly different ratio from small to medium to large paper sizes. For example, the smallest objects drawn on the smallest paper size show slightly larger ratios than for the medium or large paper. One possible explanation is that because all observers used the same Sharpee marker for drawing across paper size, they may have drawn the smallest objects on the small paper size somewhat larger than on the larger paper sizes. Separate ANOVAs conducted on the single subject regression fits revealed no difference between the slopes across paper sizes (F(2, 61) = 2.1, n.s.), nor any difference between the intercepts (F(2, 61) < 1, n.s.). Figure 3 shows example drawings, both to scale and with normalized paper sizes.
Figure 3.
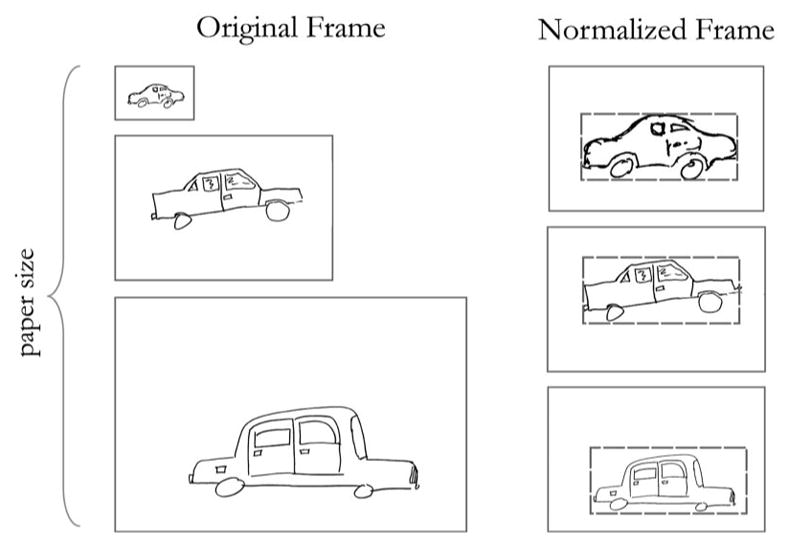
Example drawings of a car from three separate participants. Left: small, medium, and large drawings, to scale. Right: the same drawings, normalized to the size of the frame. The dashed bounding box is the same size in all three normalized drawings for reference.
Discussion
When observers are instructed to draw an object from an existing representation in visual long-term memory, the drawn size of the object depends on at least two factors. First, the drawn size of the object depends on the assumed size of the object in the world. Small objects in the world are drawn small on the page; large objects in the world are drawn larger on the page. Further, this relationship is systematic: the drawn size of an object is proportional to the size rank (and thus to the logarithm of its actual real-world size). Second, the drawn size of the object depends on the scale of the space it can occupy. Small objects such as a keys occupied 27% of the image (as measured by the diagonal of their bounding boxes relative to the diagonal of the paper), whereas large objects like houses occupied 41%. Critically, the raw size at which objects were drawn (and thus the visual angle which the drawn images subtended in an observer’s visual field) were very different for the small, medium, and large paper sizes, whereas the ratio of the object within the frame was constant across paper sizes. This strongly suggests that when objects are reconstructed from memory, the drawn size is best characterized not by raw visual angle measurements but as a relative proportion between the object and a frame of space.
It is interesting that observers did not fill the page, even for the objects with the largest size, which were only about 40% of the scale of the frame. That is, observers preserved space around the edges of the objects, even on the smallest paper sizes. However, it is not the case that observers always leave blank space around all drawings; when observers drew a beach scene and a park scene, which do not necessarily have clear edges as do objects, the average drawn size was 81% of the frame (SEM 1.8%).4 Further, this preserved ratio of the object and the frame is especially striking when considering the drawings of the small objects on the large paper sizes. In this condition, a paperclip was drawn at an average size of 14.0 cm on the large paper (SEM 1.6 cm), which is dramatically larger than its actual size in the world (~3–5 cm). Thus, one intriguing possibility is that internal object representations contain information about the relative visual size of objects and a spatial envelope around them. For example, when drawing an object, the object is not scaled to the paper; rather, the object and its envelope are scaled to the paper. A representation of this kind would produce consistent ratios across different frame sizes.
An important open question is whether the observed relationship between the drawn size and the assumed size of objects reflects a conceptual (nonvisual) bias or a perceptual (visual) bias. In other words, are these results driven by explicit knowledge that, for example, cars are typically 5 m long? Whereas semantic (nonvisual) knowledge of an object’s physical size likely plays a role, several points suggest that there is also a strong visual component. First, the relationship between assumed size and drawn size is systematically logarithmic, which is a classic quantitative relationship between perceptual properties and physical stimulus properties (e.g. Weber-Fechner’s law; see also Moyer, 1975). Second, this adjustment of drawing small objects smaller and large objects larger was not the same across paper sizes; the range of drawn sizes on the large paper was 11.2 cm, with only a 6.9 cm range for the medium paper and only a 2.5 cm range for the small paper. However, when normalized by the frame, the ratios of the object to the paper size were remarkably consistent. Although this does not rule out a purely conceptual (nonvisual) representation driving these results, it is unclear why explicit knowledge of the physical size would be influenced by a frame, whereas it is known that perceptual tasks (e.g., adjusting the physical size of a line in a frame) are biased by framing ratios (Rock & Ebenholtz, 1959). Neither the current study, nor the subsequent studies can adequately answer the question about whether physical size information is represented visually or conceptually, but we believe that both are probably involved (see Hart, Lesser, & Gordon, 1992). The important points for the current study are that object information accessed from long-term memory representations contains visual size information that is consistent across observers, is related to real-world size, and is best characterized as a ratio with respect to the space or frame it occupies.
Experiment 2: Imagery
Here, we used an imagery paradigm to probe size information in existing long-term memory representations of objects. Specifically, we examined the visual size at which objects were imagined within the frame of a computer monitor. Imagery processes can be thought of as instantiating visual long-term memory representations (i.e., stored knowledge about the visual properties of an object or class of objects) in perceptual buffers (see Kosslyn, 1999). Thus mental imagery, like drawing, relies on accessing existing object representations. If observers imagine objects at a size within the frame of the computer screen that matches the size they drew objects relative to the page size, this would show converging evidence using an alternate method of probing existing visual object representations.
Previous work examining the imagined size of real-world objects is consistent with these predictions (Hubbard & Baird, 1988; Hubbard, Kall, & Baird, 1989; Kosslyn, 1978). For example, Kosslyn (1978) used a mental distance estimation procedure to calculate the visual angle at which animals of various sizes were spontaneously imagined. Interestingly, he found that small animals were spontaneously imagined at closer distances than larger animals, and that the visual angle subtended in the mind’s eye was positively correlated with the size of the animal. In other words, small animals were imagined at smaller visual angles than large animals. He also noted that observers were not preserving an absolute scaling of the animals’ physical size in their mental images, as the largest animals were imagined at less than twice the angle of the smallest animals despite being an order of magnitude bigger in size. Kosslyn’s study was aimed at quantifying the extent of the mind’s eye and not the relationship between object size and spontaneously imagined size; however, these results provide suggestive evidence that imagined size of objects might show convergent patterns with the drawn size ratio of objects we observed in Experiment 1.
Method
A separate group of nine naïve observers were recruited from the MIT participant pool (age range 18 –35), gave informed consent, and received $5 for their participation. Stimuli were presented using MATLAB with the Psychophysics toolbox extensions (Brainard, 1997; Pelli, 1997).
At the start of each trial, the name of an object appeared at the center of the computer screen. Observers pressed a key to continue, and the screen blanked for 2 s. Observers were instructed to form a clear mental image of the object on the screen during that time. After 2 s, the mouse cursor appeared at the center of the screen. As observers moved the mouse, a rectangular box centered on the screen was drawn automatically: one corner of the rectangle was at the current mouse position and the opposite corner of the rectangle was at the same distance from the center of the screen in the opposite direction. Observers adjusted this rectangle by moving the mouse, and then clicked when the rectangle “formed a tight bounding box” around their mental image of that object. After the response, the screen blanked for 2 s and the name of the next object appeared. The names of the 100 objects in the object set were displayed in a random order. Observers were given a demonstration of how to adjust the size of the bounding rectangle before the experiment began.
Results
The left panel of Figure 4 shows the average size of imagined real world objects, plotted as a function of object size rank. Here, the imagined size was calculated as the visual angle subtended by the diagonal of the bounding box. The average imagined size for two sample objects, an egg and a refrigerator, is illustrated in the right panel of Figure 4. Averaging over the size rank of objects, observers imagined objects at 15.4 degrees visual angle (SEM = 4.5 degrees). Taking into account size rank, there was systematic positive relationship with imagined size (slope = 2.8 degrees/size rank, r2 = 0.98, p < .001).
Figure 4.

The average imagined size of objects on the computer screen is plotted as a function of the size rank of the object (black line). Error bars represent ± 1 SEM. The average imagined sizes of two objects (upper: egg, lower: refrigerator) are shown on the right.
Importantly, across the 100 objects, this systematic variation in the imagined object size was again quite consistent across observers. The effective reliability was R = .96. Thus, despite the subjectivity of the task to simply imagine the object, some objects were consistently imagined smaller and others were consistently imagined larger.
The imagery data can be converted into a ratio between the imagined size and the size of the monitor. This allows for comparison between the drawing data (Experiment 1) and the imagery data. Collapsing across size rank, there was no significant difference in the average imagined ratio and average drawn ratio, (imagery: 34%, SEM 3.1%; drawing: 36%, SEM 1.2%; t(71) = 0.6, n.s.). However, the slope between size rank and imagined size was steeper than in the in the drawing study (6.3% per size rank in Experiment 2 vs. 2.7% per size rank in Experiment 1; t(71) = 6.2, p < .0001).
Discussion
The data show that the imagined size of real-world objects scales with the assumed size of the object: physically small objects are imagined at smaller visual angles than physically large objects. Further, when the imagined visual size was normalized by the monitor visual size, the resulting ratios were fairly compatible with those found in Experiment 1. Thus, the relative measure between the object and frame holds across different observers, different tasks, and different kinds of frames.
In the imagery experiment, the slope of the relationship between size rank and imagined size was actually steeper than the corresponding slope in Experiment 1. One speculative account of this finding is that during the drawing task, perception of the drawn objects constrains the dynamic range of the drawn size, and imagery processes are not constrained in the same way. Indeed, Kosslyn (1978) found that objects imagined from existing long-term memory were imagined at larger sizes than when pictures of those animals were shown and then subsequently imagined. Further, in his estimation of the “extent of the mind’s eye,” larger estimates (~50 degrees) were obtained using imagined objects from existing long-term memory than when the same method was used on images of objects (~20 degrees).
Hubbard and Baird (1988) extended Kosslyn’s study by quantifying the relationship between the physical size of objects and the distance at which they are spontaneously imagined (“first-sight” distance). They found evidence for a power-law relationship between object size and first-sight distance (see also Hubbard, Kall, & Baird, 1989). For comparative purposes, this relationship between first-sight distance and object size can be transformed to reveal the corresponding relationship between the imagined visual angle and object size (as in Figure 4). Interestingly, this relationship is roughly linear with log object size, consistent with our findings.
To assess whether a visible frame is required to drive the relationship between imagined size and assumed size, we ran another imagery experiment in which there was no visual frame. Ten observers were blindfolded and asked to imagine an object (spoken aloud by the experimenter). After observers had formed a mental image, they remained blindfolded and traced a tight bounding box around the object in their mental image on a wall-sized blackboard in front of them. The 16 objects from Experiment 1 were used, and observers were guided to a new part of the blackboard for each object. Here, there was no visually present frame, but we again found a consistent linear relationship with the imagined size and size rank (r2 = 0.89, p < .001), with an average slope of 3 deg/rank, though there was much more variability across individual’s slopes (min: 1 deg/rank, max: 6.2 deg/rank). Thus, both imagery tasks on a monitor (with a frame) and blindfolded (without a frame) showed reliable and systematic influences of assumed size on the imagined size of real world objects.
Experiment 3: Perception
Experiment 1 and 2 used tasks that require observers to know what objects look like to draw and imagine them. In other words, they require retrieval of existing visual object representations. In Experiment 3, observers simply had to view images of real-world objects on the monitor and determine the size at which the objects “looked best.” Similar tasks have been used on studies of viewpoint preferences (e.g., Palmer, Rosch, & Chase, 1981) and the aesthetics of spatial composition (Palmer, Gardner, & Wickens, 2008).
Because this is a perceptual task, one possibility is that the best visual size of the objects is driven by visual acuity constraints. One might predict that all objects will be sized at the fovea or parafovea (e.g., 2 to 8 degrees visual angle), perhaps modulated by the complexity of the image, without any systematic variation because of prior knowledge about the real-world size of the object. Alternatively, we might predict converging evidence with the results from Experiment 1 and 2. In this case, the visual size at which an object looks “best” might be systematically related to the logarithm of the real-world size of the object.
Method
A separate group of ten naïve observers were recruited from the MIT participant pool (age range 18 –35), gave informed consent, and received $5 for their participation. One hundred color pictures of real-world objects were used (see Figure 1). Larger versions of a few example images can be seen in the Appendix, and the image database can be downloaded from the first author’s website. The experimental setup was the same as in Experiment 2.
At the start of each trial, the mouse position was set to the right side of the screen at a random height. Then, observers were presented with one picture of an object centered on a white background. The initial size of the object was determined by the height on the screen where the observer clicked to start the trial. Observers were told to select their preferred size to view the objects. Specifically, observers were shown a sample object at the smallest possible size of ~2 pixels (“intuitively, this size is too small or too far away”) and at the largest size such that the edges of the object extended beyond the monitor edges (“intuitively, this is too large or too close”). Observers were shown that they could freely move the mouse up and down to adjust the size of the object, and clicked the mouse to select their preferred view (“choose the view that’s not too big or too small, but the one that looks best”). Each observer resized all 100 objects, with the order of objects randomized across observers.
Results
Data from one observer was excluded because they did not complete the task for all objects. The left panel of Figure 5 shows the average preferred visual size of the objects, plotted as a function of the size rank of those objects. As in previous experiments, the preferred visual size was calculated as the visual angle subtended by the diagonal of the bounding box. The average preferred size for two sample objects, an egg and a refrigerator, is illustrated in the right panel of Figure 5. The data show that as the assumed size of the objects increases, the preferred visual size at which to view them on the screen also increases systematically (r2 = 0.96, p < .001). Thus, we again find a consistent relationship between the preferred visual size of the object and the size rank of that object in the world.
Figure 5.

The average preferred size of objects, in degrees visual angle, is plotted as a function of the size rank of the objects (left). Error bars represent ± 1 SEM. The average preferred size of two objects from different size ranks are shown on the right.
Across the 100 objects, the systematic variation in the preferred visual size was again very consistent across observers. The effective reliability was R = .84. Thus, despite the subjectivity of the task to select the “best view,” smaller objects were consistently sized smaller and larger objects were consistently sized larger across observers.
These data can be converted into a ratio between the preferred visual size and the size of the monitor. Collapsing across the size ranks, the average preferred size ratio was 36% (SEM 3.6%), which was not significantly different from the average imagined size ratio or the average drawn size ratio (Experiment 1-drawing: t(71) = 0.17, n.s.; Experiment 2-imagery: t(16) = 0.56, n.s.). The slope of the regression line between size rank and preferred visual size was 3.9% per size rank (SEM 0.8%), which was significantly shallower than the imagery slope in Experiment 2 (mean: 6.3% per size rank, t(16) = 2.25, p < .05) with a trend toward being steeper than the drawn slope in Experiment 1 (mean: 2.7% per size rank, t(71) = 1.99, p < .06).
Discussion
These data show that when observers can freely resize objects on the screen, the preferred view of the object is proportional to the logarithm of its real-world size. These data rule out the simple account that acuity constraints drive visual preferences, because objects were not all resized to subtend equal visual angles at the maximal extent of the fovea or parafovea. Instead, we find that knowledge about the physical size of objects systematically influences the visual size at which objects are preferentially viewed. Similarly, the preferred visual sizes within the frame of the monitor match the ratios observed in the drawing experiment well. Thus, these data suggest that perceptual preferences about objects are related to the representations invoked by drawing and imagery tasks.
The current experiment required subjective judgments about the size at which pictures of objects “look best” (see also Palmer, Gardner, & Wickens, 2008). Despite the subjectivity of this task, observers were remarkably consistent in their preferred visual sizes, with high inter-rater reliability. One interpretation of what drives the preferred view of an object is the view with the best representational fit to existing long-term memory representations (Palmer, Schloss, and Gardner, in press). Specifically, the visual size at which a refrigerator looks best is the visual size (and the space around it) that matches with existing object representations, that is, those that guided the drawing and imagery tasks. Perceptual preference tasks have also been conceptualized as a consequence of memory processes reflecting the output of the human inference system (Weber & Johnson, 2006). Akin to the previous literature on canonical perspective, we term this consistent visual size information the canonical visual size. This visual size depends on the assumed size of the object and is best specified not in terms of visual angle but in terms of visual size ratios between the object and a frame of space.
Experiment 4: Miniatures
In Experiment 4, we manipulated the size observers assumed an object to be in the world by presenting them with an image of a real-world object but telling them that it was a miniature version of that object, fit for a highly detailed architectural model. If the visual size ratio is truly a consequence of the physical size the observer believes the object to be in the world, then a “miniature” object should be preferentially viewed at a smaller size than its larger real-world counterpart.
An alternate account that predicts the data from Experiment 3 is that perhaps observers prefer to see all objects at a certain average visual size, but tend to modulate their settings around this size based on knowledge about the physical size of the object in the world. On this account, in this experiment observers who are viewing “miniature” objects should not show any difference in their preferred size ratios compared to observers who believed the objects to be typically sized real-world objects. They should have the same mean size setting, and should modulate around that preferred size by the same or perhaps a smaller dynamic range.
Further, the preferred visual sizes found in Experiment 3 could have been driven by image-level information solely (e.g., resolution, downward viewing angle, aspect ratio). The converging evidence from Experiment 1 and 2 make this unlikely. However, the miniature experiment serves as a control, as it uses exactly the same images and task as in Experiment 3, with only instructional variations. Thus, any differences in the preferred visual size between objects and miniature objects cannot be attributed to image-level effects.
Method
A separate group of ten naïve observers were recruited from the MIT participant pool (age range 18 –35), gave informed consent, and received $5 for their participation. Stimuli and procedures were identical to those in Experiment 3, except for the instructions given. Here, the participants were told that they were looking at pictures of “toys” from a “highly detailed architectural model” (i.e., the kind of model that might have a toy cheese grater and a toy basketball). As before, participants were instructed to resize the objects on the screen so that they “looked the best.”
Results
The left panel of Figure 6 shows the average preferred size of the objects that are thought of as “toys” (black line). For comparative purposes, these are plotted as a function of the same size rank used previously. The data from Experiment 3 is replotted for comparison (gray line). The average preferred size for two sample toy objects, a toy egg and a toy refrigerator, is illustrated in the right panel, along side the preferred size of the “typically sized” egg and refrigerator from Experiment 3.
Figure 6.

Left: The average preferred size to see images of “toy” objects on the screen is plotted as a function of the size rank of the object (black line). The data from Experiment 3 is replotted for comparison (gray line), in which a different set of observers resized the same images but thought of them as regular objects. Error bars represent ± 1 SEM. Right: The average preferred sizes of two toy objects are shown next to the average preferred sizes of those objects when assumed to be a typical real-world size.
Overall, the average preferred size of toy objects on the screen was 5.5 degrees (SEM = 2.13 deg), whereas the average preferred size of the same objects from Experiment 3 was 13.1 degrees (SEM = 3.3 deg; t(18) = 4.65, p < .001). As before, the preferred size of the objects, when seen “as toys” by the observers, still preserve the strong correlation with the size rank of the objects (r2 = 0.99, p < .001). The slopes of the regression lines between Experiment 3 sizing regular objects and Experiment 4 sizing toy objects were not significantly different (Object: 3.9% per rank, Toy: 3.1% per rank, t(18) = 0.9, n.s.). Further, observers were very consistent in the relative sizes across all 100 objects, with an effective rater reliability of R = 0.94.
Discussion
When observers think objects are smaller in the world, the preferred sizes of those objects are smaller on the screen. This is true even though separate groups of observers participated in Experiments 3 and 4. Further, this experiment demonstrates that preferred visual sizes are not driven solely by the image-level differences or the relationship between objects in the set, because the images in Experiment 3 and 4 were the same. Additionally, the relationship between preferred size and assumed size is preserved when observers think of the objects as miniatures. Likely this reflects the instructions that these objects were for a model, that is, made “to scale” but at a smaller physical size. The largest miniature objects (e.g., houses, statue) were sized on the screen at around 27%. Thus, we can estimate that observers likely thought of these images as having a physical size of around 30 – 60 cm (e.g., a coffeemaker or backpack), based on the Experiment 3 size ratios.
The current data also have interesting implications about how assumed real-world size influences preferred visual size, and what kind of information is stored in object representations. Likely, we don’t have much visual experience with toy cheese graters, but we do have experience with cheese graters and with toys. It is also likely that learning from experience operates at multiple levels of abstraction (e.g., this specific cheese grater, all cheese graters, all kitchen appliances; and this toy, toys in general). Thus, such learned attributes can flexibly combine to generate a representation of, for example, a toy cheese grater, without ever having seen one before. As evidence that this is learned over experience, 18 to 30 month-old children sometimes make scale-errors, in which they attempt to get into a toy car or sit in a dollhouse chair, indicating that they can recognize a toy version of the object, but fail to incorporate its apparent physical size and instead carry out the associated actions with the typically sized objects (DeLoache, 2004).
Another implication of this result is that assumed size modulates expectations about visual size. Put more strongly, a cheese grater on a white background will look more like a miniature cheese grater if it has a small ratio on the screen. Even though there were completely different observers between Experiment 3 and 4, the preferred visual size of miniatures was smaller than the preferred visual size of real-world objects. This further reinforces the main result that smaller objects in the world have smaller canonical visual sizes.
Experiment 5: Size Range
An additional factor that may be influencing the preferred size is the range of real-world object sizes in the image set. In all of the experiments reported here, participants were exposed to the whole range of real-world sizes (ranks 1– 8, from very small to very large size). Here, we tested the impact of stimulus set in the perceptual preference task using a between-subjects design, where three groups of observers are exposed to a restricted range of objects sizes (e.g., only small objects in the world, only objects of medium size, or only large objects). If observers simply use a minimum small visual size for the smallest object and a maximum visual size for the largest objects, and scale the other objects between these two extremes, then the visual sizes we observe will be largely because of the stimulus set and not because of the absolute assumed size of the object. However, if there are reliable differences in the preferred visual sizes between the observer groups, even when the groups are exposed to a restricted range of real-world object sizes, then this would show that observers are guided by a common canonical visual size representation.
Method
Three groups of 11 naïve observers were recruited from the MIT participant pool (age range 18 –35), gave informed consent, and received $5 for their participation. Observers completed the same procedure as in Experiment 3, but were exposed to only a subset of the items, with one group seeing only small items (ranks 1– 4), another group seeing only medium items (ranks 3– 6), and the final group seeing only large items (ranks 5– 8).
Results
First, we examined if there were reliable differences between the three groups of observers on the averaged preferred size. We found a significant effect of group on the preferred size ratio (F(2, 30) = 4.4, p < .05, η2 = .22), consistent with our predictions from Experiments 1– 4: smaller visual sizes were preferred for the group seeing smaller real-world objects and larger visual sizes were preferred for the group seeing larger real-world objects.
We next compared the preferred visual sizes of each group with the original experiment in which observers were exposed to all size ranks 1– 8. Three ANOVAs were conducted on the size ratios, one for each group of observers, with size rank as a within-subject factor, and stimulus set range as a between-subject factor (e.g., data from the observers seeing only the smallest objects were compared with data from Experiment 3 for only the object size ranks of 1, 2, 3, and 4, and similarly for those seeing medium sized objects or large sized objects). The results are shown in Figure 7. Overall, the average preferred size for small objects was the same whether observers were only exposed to that range or the full physical size range (ranks 1– 4; means: 32% and 29%; F(1, 18) = 0.7, n.s.). The same held for observers seeing only medium size objects (ranks 3–6; means: 39% and 38%; F(1, 18) = 0.0, n.s.) and for those seeing large objects only (ranks: 5–8; means: 45% and 45%; F(1, 18) = 0.0, n.s.). However, observers who saw only medium-sized objects or only large objects used a larger range of ratios on the screen than observers exposed to the whole range of objects physical sizes (medium ranks 3–6: experiment × size rank interaction: F(1, 18) = 8.2, p < .01, η2 = .31; large ranks 5–8: experiment × size rank interaction: F(1, 18) = 4.2, p = .055, η2 = .19).
Figure 7.
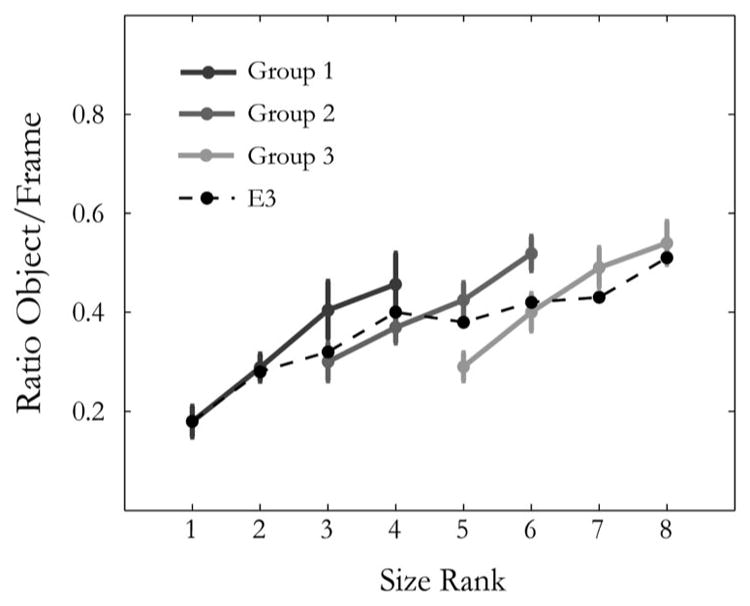
Results of size range experiment. The average preferred size of objects for the three groups of observers, expressed as a ratio between the size of the object and the size of the screen, is plotted for each group as a function of the size rank of the objects. Dashed line indicates the preferred sizes from Experiment 3. Error bars represent ± 1 SEM.
Discussion
These results show that the range of physical sizes does have an effect on the preferred visual sizes, by modulating the dynamic range between the smallest and largest item. Specifically, the preferred sizes found in the three observer groups have more size range than the preferred sizes found by participants exposed to the whole range in Experiment 3. This reveals that the object set, or the context in which a collection of objects is perceived, is another factor that modulates the preferred visual size. This result is interesting because it suggests that people have some flexibility in the scaling between assumed size and visual size. However, for the present purposes, it is also important to note that overall, the average visual size increased for each group exposed respectively only to small, medium or large objects and was consistent with the visual sizes from a different set of observers who were exposed to the whole object set. This demonstrates that the assumed size of objects influenced their preferred visual sizes, even across observers and stimuli ranges: smaller visual sizes were preferred for smaller objects and larger visual sizes were preferred for larger objects.
A related concern is that, over the course of multiple trials in the experiment, exposure to different objects with different real-world sizes may lead observers to adopt a systematic relationship between assumed size and preferred visual size over time. Thus, perhaps without this exposure to a variety of stimuli with different real world sizes, there would be no remaining effect of assumed size. If this were the case, then one would not expect to find an effect of real-world size on the very first trial. To examine this possibility, we conducted an analysis of the first trial completed for the 94 observers in Experiments 1 through 5 (excluding the first drawings of 21 observers in Experiment 1 that did not meet the criterion for inclusion). We again observe a positive relationship between the physical size rank the visual size (r2 = 0.18, df = 93, p < .001; Figure 8). The slope of relationship is 3.2% per size rank. For reference, the average slope was 2.7% for drawing, 3.9% for perception, and 6.3% for imagery. Thus, despite the lack of power because of having only one trial per subject, this analysis suggests that, even on the first trial, the small objects were drawn, imagined and preferentially viewed at smaller size ratios than large objects. While there is likely a contribution of intertrial comparisons on the size effects found here, these analyses suggest that the consistency of the size ratios we have found in perceptual, imagery, and memory tasks are not solely a consequence of intertrial comparisons or object set effects.
Figure 8.
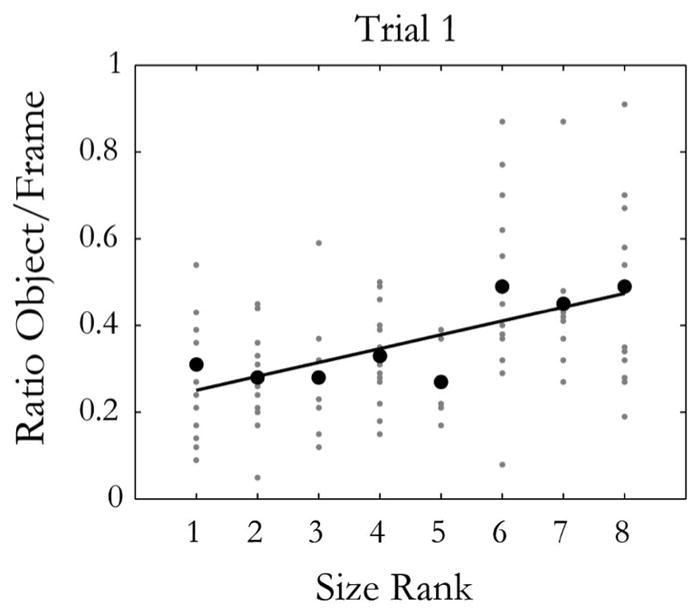
Trial 1 Analysis. Average drawn, imagined, or preferred visual size for the first trial only of all Experiments 1–5. These visual sizes are expressed as a ratio between the size of the object and the size of the frame, plotted as a function of the size rank of the objects. Each gray point represents a participant, with the average visual size per size rank shown in black points.
General Discussion
Evidence for Canonical Visual Size
In the current studies, we asked whether accessing real world object knowledge yields consistent visual size representations across different mental processes. Using drawing from memory, imagery, and perceptual preference tasks we found that systematic visual size ratios were observed across different mental processes and across observers (see Figure 9). These results provide evidence for different canonical visual sizes for differently sized physical objects. Second, the data demonstrate that the canonical visual size of an object depends on the assumed real-world size of the object. Across all experiments and observers, there was a strong correlation with the size rank, and thus with the logarithm of the assumed size of the object in the world (Figure 9). This claim is further supported by the miniatures experiment in which we manipulated assumed size and showed corresponding changes in preferred visual size. Finally, these data argue that the canonical visual size is best characterized as a ratio between the object and the space around it. For instance, the canonical visual size of a chair is not a specific visual angle but rather is 38% of a surrounding spatial envelope (Figure 9). Experiment 1 most strongly supports specifying canonical visual size as a ratio, as the drawn size for any given object was equivalent across paper sizes when characterized as a ratio between the object and frame.
Figure 9.

Left: Results of Experiments 1 (Drawn), 2 (Imagined), and 3 (Viewed), overlaid on one graph. The x-axis shows the size rank of the object; the y-axis shows the diagonal ratio of the object in the frame. Error bars represent ± 1 SEM. Right: Example drawings of a fish, chair, and dump truck for a single observer. The average imagined size and preferred size across observers are shown for these same objects in the adjacent columns. Note that separate groups of observers participated in the Drawn, Imagined, and Viewed experiments.
On a broader interpretation of these data, tasks that access object representations for visual size information are likely probing an underlying distribution of visual sizes, rather than just one specific canonical visual size. For example, while a strawberry may look best when presented at a size ratio of 18%, this may reflect only the most probable of a range of possible visual sizes. Exemplar-based models and view-centered models of object representation argue that observers store many instances of objects (e.g., Edelman & Butlhoff, 1992; Nosofsky, 1986; Ullman, 1989); if visual size information is also stored with these exemplars, this could give rise to a probability distribution over this dimension. The idea that object knowledge operates over probability distributions along various spatial and featural dimensions has received support from memory paradigms, in which systematic biases can be observed that reflect coding an episode with respect to a prior distribution (e.g., Hemmer & Steyvers, 2009; Huttenlocher, Hedges, & Duncan, 1991; Huttenlocher, Hedges, & Vevea, 2000; Konkle & Oliva, 2007; see also Baird, 1997). Broadly, accessing an existing object representation, e.g., for a drawing or imagery task, can be thought of as taking a sample from underlying distributions, of which visual size and perspective may be stored dimensions.
Framing Effects
We found that observers were sensitive to the amount of space specified by a frame, drawing objects in such a way that across observers, a consistent ratio between the object and the paper size was preserved over a range of different frame sizes. These findings show converging evidence in support of a framing account of the “vista paradox,” in which a large distant object viewed through a window (or through a naturally occurring corridor, e.g., in a cavern or street scene) appears to both shrink in physical size and recede in distance as the observer approaches it (Walker, Rupich, & Powell, 1989; see also the “coffee cup illusion,” Senders, 1966). This notion that the framing ratio affects the perception of an object’s physical size properties, beyond information from the object alone, has been documented in a number of other studies (e.g., Brigell et al., 1977; Kunnapas, 1955; Rock & Ebenholt, 1959). Further, it is interesting to note that under natural viewing conditions, objects are always seen in a space, maximally limited by the extent of the visual field. As such, any experienced view of an object has an implicit frame of space around it.
The relationship of the object with the space around it is only one simple statistic that may be stored from visual experience. More generally, these framing effects support the notion that object representations are inherently linked to contexts, both spatially and semantically (e.g., Bar, 2004; Oliva & Torralba, 2007). For example, reaction time benefits are found for identifying objects in semantically consistent versus inconsistent scenes (e.g., Biederman, Mezzanotte, & Rabinowitz, 1982; Davenport & Potter, 2004; Palmer, 1975), as well as for items appearing in a more likely position given the identity and position of a previous item (e.g., Grunau, Neta, & Bar, 2008). Combined, these results highlight the relative nature of object representations: in our accumulated visual experience with objects in the world, objects never appear in isolation. As such, preexisting knowledge of object properties may be specified not only as item-specific information but also with more relative statistics, such as object-object and object-scene associations (e.g., keyboard and mouse; bed and bedroom). In the case of object size, for instance, we suggest that rather than simply storing visual angle information about objects, the relevant statistics may actually be relative measures between object angle and a visual frame of space.
Task-Demand Characteristics
One concern about these results is the issue of task-demands: are people showing effects of assumed object size because they are explicitly thinking about size while they make a size response? There are several pieces of data that speak to this issue. First, while both the imagery and perception studies (Experiment 2 and Experiment 3) directly involve making a resizing response, the drawing study (Experiment 1) does not. Here, the task instructions focus much more on object identity (“draw a cat”), while the drawn size is an indirect aspect of the task. Importantly, the results still show an effect of assumed object size. Second, demand characteristics might arise over the course of the experiment, as observers reference previous responses rather than treating each trial independently. Indeed, this is evident in our data in the restricted size range experiment (Experiment 5). However, even on observers’ very first trial, the drawn/imagined/preferred visual size was still influenced by the assumed size of the object. Finally, the miniatures experiment (Experiment 4) also speaks to the issue of task-demands. Observers were told that the images were pictures of miniatures for an architectural model, that is, very small in real-world size. Surely as a participant, one might feel as if they should select smaller sizes. However, smaller than what? The observers were not the same as those who did Experiment 1. If there was no common understanding about the preferred visual size of a typically sized car, they would not know how to make a toy car smaller. While none of these analyses and experiments perfectly address the issue of demand characteristics (and indeed, Experiment 5 points to the fact that other factors beyond assumed size and framing modulate the accessed visual size), the combined data from all the experiments strongly point to a role that the canonical visual size depends on the assumed size of the object in the world. The results of the drawing task (Experiment 1) are the strongest evidence of this point, as this experiment is least subject to task demand characteristics, and also provides the clearest support that canonical visual size is a relative statistic between the size of the object and its surrounding space.
Relationship Between Canonical Visual Size and Real-World Viewing
Experience typically arises in the real-world in which 3D geometry constrains the distributions of visual sizes that are likely for different sized objects. How do the canonical size for real-world objects compare to typical viewing distances? To explore this question, we first need to obtain typical viewing distances for real-world objects and thus what the corresponding visual angle is in one’s visual field. Hubbard, Kall, and Baird (1989) obtained estimates of the typical distance of interaction for a range of everyday objects, which can be converted into visual angle measurements (from 1.5 degrees for a 3 cm object like a coin, to 25 degrees for a 4 m object like a giraffe). Next, our data suggest that canonical sizes are not specified in absolute visual angles but are instead relative to a frame of space. Thus, to see if the visual size subtended by objects at their typical viewing distance is the same as the canonical visual size, one needs to specify what the “frame” is during real-world viewing. One intuitive possibility for the frame of real-world viewing is the whole visual field. However, with a 180-degree hemisphere as the frame, the corresponding visual size ratios at typical viewing distances are all much smaller that the canonical visual size ratios we observed in the present data. Another possibility is to use extent of the mind’s eye as a proxy for the useable visual field and frame. The estimation varies between 20 to 60 degrees (Hubbard & Baird, 1988; Hubbard, Kall, & Baird, 1989; Kosslyn, 1978), with the larger estimates obtained when estimating over-flow distance of real-world objects. With a 60 degree estimate as the frame, typical visual size ratios would be between 3% for the coin to 42% for the giraffe. These estimated ratios are similar to the imagined ratios observed in the present data (see Figure 9). Of course, this speculation should be taken lightly as assumptions have been made about the size of the real-world frame and the accuracy of subjective reports of typical viewing distances. More work is required to integrate the canonical sizes found on the computer screen and drawn pages with the statistics of visual experience in the real world.
Finally, Hubbard, Kall, and Baird, (1989) have some evidence suggesting that there may be systematic differences between sizes arising from imagery versus perceptual processes. For example, in their study, observers imagined bird’s nests an average distance of ~1 m while the average typical viewing distance was ~6 m. In fact, when Hubbard, Kall, and Baird had observers imagine rods (unfamiliar objects) of a prespecified length, and then estimate their distance to the rod, they found that the relationship between size and viewing distance was less noisy than with familiar objects. These data suggest that canonical visual size may be derived not only from the distribution of visual experience, but also from structural or geometric properties of the object (e.g., bird’s nests are rarely seen up close but the canonical visual size may be more similar to an object of similar size, such as a football, even though the distributions of visual experience with these objects are likely quite different). Future studies are required to distinguish between these hypotheses; as with canonical perspective, likely both visual experience and structural geometric factors are involved.
Familiar Size as a Depth Cue
Existing knowledge about the size of objects in the world can serve as a cue to depth, this is typically referred to as the familiar size cue. For example, in a classic study by Ittelson (1951), observers had to judge the distance to different monocularly viewed playing cards, where unbeknownst to the observers, all the cards were presented at the same distance but some playing cards were either three quarters or one and a half times the size of a normal playing card. The larger playing cards were estimated to be closer to the observer, such that a normal card at the reported distance would match the visual size of the card. Similar results were found for the smaller playing cards, estimated to be father away. These data show that when objects that have a familiar or known size, seeing them at a particular visual angle influences the perceived distance (see also Baird, 1963; Yonas, Pettersen, & Granrud, 1982).
Familiar size and canonical visual size are not the same: familiar size means that observers know the real-world size of objects in the world (e.g., expressed in meters). This is knowledge about an object property, that is, object-centered information. In contrast, canonical visual size indicates that there is a privileged visual size for perceiving objects (where the visual size is expressed as a ratio between the visual angle of an object relative to a frame). Canonical perspectives and canonical visual sizes provide evidence that existing object representations contain specific information about perspective and visual size, which are viewer-centered properties. For example, at one extreme it might be argued that existing object representations are stored at one particular perspective and one particular scale. Alternatively, likely each object’s representation has stored views from a range of perspectives and scales, with some perspectives and scales being more probable or preferred than others.
What, then, is the relationship between familiar size as a depth cue and canonical visual size? Both involve the observer having knowledge about the real-world size of the object. In the first case, observers can use the familiar size of an object to estimate its distance (e.g., Epstein 1963, Epstein 1965; Epstein & Baratz, 1964; Ittelson, 1951; Ono, 1969). In the case of canonical visual size, when observers access existing object representations to draw, imagine, or make a perceptual preference, the visual size that is outputted depends on the assumed size of the object. Combining these two ideas, one empirical prediction is that observers might be better able to use familiar size information to make accurate distance estimates if the familiar object at its canonical visual size within the real-world viewing frame.
Conclusion
Akin to studies on canonical perspective, we provide evidence that existing object representations also have canonical visual sizes, which depend on the assumed size of the object in the world relative to a frame of space. Both perspective and visual size are spatial dimensions that are under the control of an active observer, in this sense canonical views connect physical objects to a viewer in an environment. In fact, if one combines canonical perspective at the canonical visual size, this object knowledge specifies the optimal place in 3D space from which to view an object. One intriguing possibility is that an active observer might use this information to reflexively navigate to a better view of objects in the world (e.g., Merleau-Ponty, 1962).
Acknowledgments
We thank George Alvarez, Antonio Torralba, Marco Bertamini, Timothy Brady, and Steve Palmer for helpful conversation and comments on the manuscript, and Madison Capps for help with data collection. This work was partly funded by a National Defense Science and Engineering Graduate Fellowship (to Talia Konkle), a National Science Foundation Career Award IIS-0546262 and Grant IIS-0705677 (to Aude Oliva). The stimuli database and physical size measurements may be found on the first author’s Web site.
Appendix
Stimulus Examples
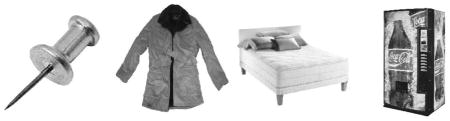
Sample objects used in Experiments 3, 4, and 5 are shown here, so the level of object detail and resolution of the images is more apparent. All images used in the experiment were presented in color.
Footnotes
There were a few objects for which this was not true, such as a clock, for which a pure front view was ranked highest, probably because of the frequency with which it is viewed in this perspective.
The actual size of the object could also be quantified as the diagonal of the 3D bounding box (height × width × depth). Because of the correlation between height, width, and depth of these objects, the 3D diagonal and the frontal diagonal are negligibly different on a log scale.
The patterns in the data are unchanged when the analysis is conducted on drawn images using a more moderate exclusion criteria (connected objects such as worms and wires included) or with full inclusion (including the trash cans behind the dump truck).
In these scenes, the calculated diagonal ratio was not 100% because observers typically drew a horizon line that extended across the entire horizontal axis, but did not necessarily make marks for grass/sand that touched the extreme bottom edge and for clouds/sun/trees that touched the extreme top edge of the paper.
References
- Bülthoff HH, Edelman S. Psychophysical support for a two-dimensional view interpolation theory of object recognition. Proceedings of the National Academy of Sciences. 1992;89:60– 64. doi: 10.1073/pnas.89.1.60. [DOI] [PMC free article] [PubMed] [Google Scholar]
- Baird JC. Retinal and assumed size cues as determinants of size and distance perception. Journal of Experimental Pscyhology. 1963;66:155–162. doi: 10.1037/h0046554. [DOI] [PubMed] [Google Scholar]
- Baird JC. Sensation and judgment: Complementary theory of psychophysics. Mahwah, NJ: Erlbaum; 1997. [Google Scholar]
- Bar M. Visual objects in context. Nature Reviews Neuroscience. 2004;5:617– 629. doi: 10.1038/nrn1476. [DOI] [PubMed] [Google Scholar]
- Biederman I, Mezzanotte RJ, Rabinowitz JC. Scene perception: Detecting and judging objects undergoing relational violations. Cognitive Psychology. 1982;14:143–177. doi: 10.1016/0010-0285(82)90007-x. [DOI] [PubMed] [Google Scholar]
- Blanz V, Tarr MJ, Bulthoff HH. What object attributes determine canonical views? Perception. 1996;28:575–599. doi: 10.1068/p2897. [DOI] [PubMed] [Google Scholar]
- Brainard DH. The psychophysics toolbox. Spatial Vision. 1997;10:433– 436. [PubMed] [Google Scholar]
- Brigell M, Uhlarik J, Goldhorn P. Contextual influences on judgments of linear extent. Journal of Experimental Psychology: Human Perception and Performance. 1977;3:105–118. doi: 10.1037//0096-1523.3.1.105. [DOI] [PubMed] [Google Scholar]
- Carmichael L, Hogan HP, Walter AA. An experimental study of the effect of language on the reproduction of visual perceived form. Journal of Experimental Psychology. 1932;15:73– 86. [Google Scholar]
- Davenport JL, Potter MC. Scene consistency in object and background perception. Psychological Science. 2004;15:559–564. doi: 10.1111/j.0956-7976.2004.00719.x. [DOI] [PubMed] [Google Scholar]
- DeLoache JS. Scale errors offer evidence for a perception-action dissociation early in life. Science. 2004;204:1027–1029. doi: 10.1126/science.1093567. [DOI] [PubMed] [Google Scholar]
- Edelman S, Bülthoff HH. Orientation dependence in the recognition of familiar and novel views of three-dimensional objects. Vision Research. 1992;32:2385–2400. doi: 10.1016/0042-6989(92)90102-o. [DOI] [PubMed] [Google Scholar]
- Epstein W. The Influence of Assumed Size on Apparent Distance. The American Journal of Psychology. 1963;76:257–265. [Google Scholar]
- Epstein W, Baratz SS. Relative size in isolation as a stimulus for relative perceived distance. Journal of Experimental Pscyhology. 1964;67:507–513. doi: 10.1037/h0043588. [DOI] [PubMed] [Google Scholar]
- Esptein W. Nonrelational judgments of size and distance. The American Journal of Pscyhology. 1965;78:120–123. [PubMed] [Google Scholar]
- Gronau N, Neta M, Bar M. Integrated contextual representation for objects’ identities and their locations. Journal of Cognitive Neuroscience. 2008;20:371–388. doi: 10.1162/jocn.2008.20027. [DOI] [PubMed] [Google Scholar]
- Hart JH, Jr, Lesser RP, Gordon B. Selective interference with the representation of size in the human by direct cortical electrical stimulation. Journal of Cognitive Neuroscience. 1992;4:337–344. doi: 10.1162/jocn.1992.4.4.337. [DOI] [PubMed] [Google Scholar]
- Hemmer P, Steyvers M. A Bayesian account of reconstructive memory. Topics in Cognitive Science. 2009;1:189–202. doi: 10.1111/j.1756-8765.2008.01010.x. [DOI] [PubMed] [Google Scholar]
- Hubbard TL, Baird JC. Overflow, first-sight, and vanishing point distances in visual imagery. Journal of Experimental Psychology: Learning, Memory, and Cognition. 1988;14:641– 649. doi: 10.1037//0278-7393.14.4.641. [DOI] [PubMed] [Google Scholar]
- Hubbard TL, Kall D, Baird JC. Imagery, memory, and size-distance invariance. Memory & Cognition. 1989;17:87–94. doi: 10.3758/bf03199560. [DOI] [PubMed] [Google Scholar]
- Huttenlocher J, Hedges LV, Duncan S. Categories and particulars: Prototype effects in establishing spatial location. Psychological Review. 1991;98:352–376. doi: 10.1037/0033-295x.98.3.352. [DOI] [PubMed] [Google Scholar]
- Huttenlocher J, Hedges LV, Vevea J. What do categories affect stimulus judgments? Journal of Experimental Psychology: General. 2000;129:220–241. doi: 10.1037//0096-3445.129.2.220. [DOI] [PubMed] [Google Scholar]
- Intraub H, Richardson M. Wide-angle memories of close-up scenes. Journal of Experimental Psychology: Learning, Memory, & Cognition. 1989;15:179–187. doi: 10.1037//0278-7393.15.2.179. [DOI] [PubMed] [Google Scholar]
- Ittleson WH. Size as a cue to distance: Static localization. The American Journal of Pscyhology. 1951;64:54– 67. [PubMed] [Google Scholar]
- Konkle T, Oliva A. Normative representation of objects: Evidence for an ecological bias in perception and memory. In: McNamara DS, Trafton JG, editors. Proceedings of the 29th Annual Cognitive Science Society. Austin, TX: Cognitive Science Society; 2007. pp. 407–413. [Google Scholar]
- Kosslyn S. Measuring the visual angle of the mind’s eye. Cognitive Psychology. 1978;10:356–389. doi: 10.1016/0010-0285(78)90004-x. [DOI] [PubMed] [Google Scholar]
- Kosslyn S. Image and brain: The resolution of the imagery debate. Cambridge: The MIT Press; 1999. [Google Scholar]
- Kunnapas TM. Influence of frame size on apparent length of a line. Journal of Experimental Psychology. 1955;50:168–170. [PubMed] [Google Scholar]
- Merleau-Ponty M. Phenomenology of perception. London: Routledge & Kegan Paul; 1962. [Google Scholar]
- Moyer RS. Comparing objects in memory: Evidence suggesting an internal psychophysics. Perception & Psychophysics. 1973;13:180–184. [Google Scholar]
- Nosofksy RM. Attention, similarity, and the identification-categorization relationship. Journal of Experimental Psychology: General. 1986;115:39–57. doi: 10.1037//0096-3445.115.1.39. [DOI] [PubMed] [Google Scholar]
- Oliva A, Torralba A. Modeling the shape of the scene: A holistic representation of the spatial envelope. International Journal of Computer Vision. 2001;42:145–175. [Google Scholar]
- Oliva A, Torralba A. The role of context in object recognition. Trends in Cognitive Sciences. 2007;11:520–527. doi: 10.1016/j.tics.2007.09.009. [DOI] [PubMed] [Google Scholar]
- Ono H. Apparent distance as a function of familiar size. Journal of Experimental Psychology. 1969;79:109–115. doi: 10.1037/h0026879. [DOI] [PubMed] [Google Scholar]
- Paivio A. Perceptual comparisons through the mind’s eye. Memory & Cognition. 1975;3:635– 647. doi: 10.3758/BF03198229. [DOI] [PubMed] [Google Scholar]
- Palmer SE, Rosch E, Chase P. Canonical perspective and the perception of objects. In: Long J, Baddeley A, editors. Attention and performance IX. Hillsdale, NJ: Erlbaum; 1981. pp. 135–151. [Google Scholar]
- Palmer SE, Schloss KB, Gardner JS. Hidden knowledge in aesthetic preferences: Color and spatial composition. In: Shimamura AP, Palmer SE, editors. Aesthetic science: Connecting minds, brains, and experience. New York: Oxford University Press; (in press) [Google Scholar]
- Palmer SE. The effects of contextual scenes on the identification of objects. Memory and Cognition. 1975;3:519–526. doi: 10.3758/BF03197524. [DOI] [PubMed] [Google Scholar]
- Palmer SE, Gardner JS, Wickens TD. Aesthetic issues in spatial composition: Effects of position and direction on framing single objects. Spatial Vision. 2008;21:421– 449. doi: 10.1163/156856808784532662. [DOI] [PubMed] [Google Scholar]
- Pelli DG. The VideoToolbox software for visual psychophysics: Transforming numbers into movies. Spatial Vision. 1997;10:437– 442. [PubMed] [Google Scholar]
- Rock I, Ebenholtz S. The relational determination of perceived size. Psychological Review. 1959;66:387– 401. doi: 10.1037/h0046984. [DOI] [PubMed] [Google Scholar]
- Rosenthal R, Rosnow RL. Essentials of behavioral research: Methods and data analysis. Boston, MA: McGraw Hill; 1991. [Google Scholar]
- Senders JW. The coffee cup illusion. American Journal of Psychology. 1966;79:143–145. [Google Scholar]
- Stevens SS. On the pscyhophysical law. Psychological Review. 1957;64:153–181. doi: 10.1037/h0046162. [DOI] [PubMed] [Google Scholar]
- Tarr MJ. Rotating objects to recognize them: A case study of the role of viewpoint dependency in the recognition of three-dimensional objects. Psychonomic Bulletin and Review. 1995;2:55– 82. doi: 10.3758/BF03214412. [DOI] [PubMed] [Google Scholar]
- Tarr MJ, Pinker S. Mental rotation and orientation-dependence in shape recognition. Cognitive Psychology. 1989;21:233–282. doi: 10.1016/0010-0285(89)90009-1. [DOI] [PubMed] [Google Scholar]
- Ullman S. Aligning pictoral description: An approach to object recognition. Cognition. 1989;32:193–254. doi: 10.1016/0010-0277(89)90036-x. [DOI] [PubMed] [Google Scholar]
- Walker JT, Rupick RC, Powell JL. The vista paradox: A natural visual illusion. Perception & Psychophysics. 1989;45:43– 48. doi: 10.3758/bf03208031. [DOI] [PubMed] [Google Scholar]
- Weber EU, Johnson EJ. Constructing preferences from memory. In: Lichtenstein S, Slovic P, editors. The construction of preference. New York: Cambridge University Press; 2006. pp. 397–410. [Google Scholar]
- Yonas A, Pettersen L, Granrud E. Infants’ Sensitivity to Familiar Size as Information for Distance. Child Development. 1982;53:1285–1290. [PubMed] [Google Scholar]