Abstract
Refractive index properties, especially at the nanoscale, have shown great potential in cancer diagnosis and screening. Due to the intrinsic complexity and weak refractive index fluctuation, the reconstruction of internal structures of a biological cell has been challenging. In this paper, we propose a simple and practical approach to derive the statistical properties of internal refractive index fluctuations within a biological cell with a new optical microscopy method – Low-coherence Statistical Amplitude Microscopy (SAM). We validated the capability of SAM to characterize the statistical properties of cell internal structures, which is described by numerical models of one-dimensional Gaussian random field. We demonstrated the potential of SAM in cancer detection with an animal model of intestinal carcinogenesis – multiple intestinal neoplasia mouse model. We showed that SAM-derived statistical properties of cell nuclear structures could detect the subtle changes that are otherwise undetectable by conventional cytopathology.
OCIS codes: (110.0180) Microscopy, (120.3180) Interferometry, (170.4580) Optical diagnostics for medicine, (290.1350) Backscattering
1. Introduction
A biological cell is a complex system in which the spatial variation of its refractive index (i.e., refractive index variation) arises from the presence of heterogeneous internal structures consisting of numerous macromolecules such as double-stranded DNAs, RNAs, aggregated chromatin and bound proteins. It is now recognized that structural characterization of a biological cell, particularly sensitive determination of subtle alterations of these internal structural properties, is of primary importance for many biomedical applications, particularly for early cancer diagnosis and screening [1,2]. Interferometric imaging techniques are among the most powerful modalities to detect subtle changes of refractive index structural properties, as sensitive as sub-nanometer scale [3,4]. Low-coherence interferometric imaging microscopes, digital holographic microscopy and quantitative phase microscopy have also shown great promise in studying sub-nanometer dynamic structural properties of a biological cell [3,5,6].
The ideal representation of the structural properties of a biological system is a three-dimensional map detailing the refractive index of its internal structure with nanoscale accuracy. However, the accurate reconstruction of refractive index map of a biological system has been challenging. Thanks to several investigators, there has been significant progress in the reconstruction of the refractive index distribution of biological system. Bruno et al have demonstrated the feasibility of reconstructing the refractive index profile of a multi-layered sample by solving an inverse problem of the interference fringes obtained from backscattered low-coherence interferometry [7]. Choi et al have developed tomographic phase microscopy to quantitatively map the three-dimensional (3D) refractive index in live cells and tissues using a phase-shifting laser interferometric microscope [8]. Charriere et al have constructed three-dimensional refractive index distribution of a pollen grain with digital holographic microscopy [9]. Despite the significant advancement, due to the intrinsic complexity and extremely weak refractive index variation (i.e., nearly continuous medium) of sub-cellular structures, the reconstruction of three dimensional refractive index distribution is still challenging and complicated. Moreover, the significance of the complex three-dimensional refractive index distribution of cell internal structures in medicine and biological research has not been extensively addressed.
Here we present a simple approach to characterize the statistical properties of axial refractive index from internal sub-cellular structures of a single biological cell, which is more suitable for clinical applications. We do not focus on the accurate reconstruction of detailed three-dimensional refractive index distribution of the biological cell; instead, we aim to derive the simplified structural parameters to represent the statistical properties of cell internal sub-cellular structures. Our approach is based on the statistical analysis of Fourier-transformed amplitude of low spatiotemporal-coherence backscattering interferometric signals from an instrument that simultaneously obtains a speckle-free backscattering microscopic image in which the individual pixel contains the backscattering spectrum. This technique is therefore referred to as Low-coherence Statistical Amplitude Microscopy (SAM). We first construct a theoretical model of a biological cell whose refractive index profile is represented by one-dimensional Gaussian random field model. Then the numerical analysis of SAM is presented based on simulated one-dimensional interferometric signals from a series model of biological cells with various known statistical properties of refractive index. We further demonstrate the potential of SAM in cancer detection with an animal model of intestinal carcinogenesis – multiple intestinal neoplasia (Min) mouse model. Our results show that SAM-derived statistical properties of cell nuclear structure could detect the subtle changes that are otherwise undetectable by conventional cytopathology.
2. Materials and methods
2.1 Statistical model of refractive index profile of a single biological cell
If we describe the three-dimensional refractive index distribution of a biological cell as , the spatial profile of refractive index of cell internal structures at a given pixel within a single biological cell or a sub-cellular component can be described as a sum of the average axial refractive index and a spatially-varying component n(z): , as shown in Fig. 1 . The thickness of the cell at a given pixel is L(x, y). The average axial refractive index of the single cell can be determined by Fourier transformation of backscattered interferometric signals [2,10,11].
Fig. 1.
Illustrative refractive index profile of internal structures of a biological cell.
To characterize the complex, inhomogeneous spatially-varying component of refractive index distribution of cell internal structures within a single biological cell, we adopted a stochastic model, one-dimensional Gaussian random field (GRF) model in the statistical software package R-project. The model has been used previously to characterize the morphology of randomly inhomogeneous materials and characterizing complex microstructures [12]. Here we consider the longitudinal refractive index at a given pixel within a single biological cell ( ) as a one-dimensional stochastic process having a Gaussian probability density function. Each value of is a Gaussian random variable with the mean and its standard deviation (i.e., the average magnitude of refractive index variation) . The two-point correlation function is defined as
| (1) |
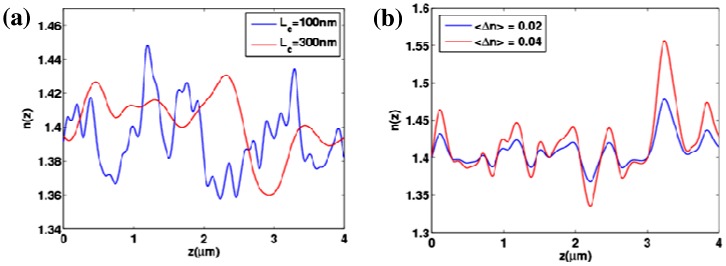
The Gaussian function is used as the correlation model: , where is the spatial correlation length of refractive index representing the length scale over which the spatial correlation decreases to a negligible level. Therefore, a larger represents the denser internal structural components of a biological cell, higher is associated with the increased spatial variation of the density of intracellular material in the axial direction of the three-dimensional cell and a longer corresponds to a slowly-changing axial refractive index profile due to the presence of large macromolecules. Figure 2 shows the representative refractive index profiles modeled with GRF with a fixed , and various correlation length and the standard deviation of refractive index .
Fig. 2.
The representative refractive index profiles modeled with GRF (a) with fixed and , but different correlation length , and (b) with fixed and and different average magnitude of refractive index variation .
Assuming that there are 5000 pixels inside the cell which have common statistical properties of refractive index – and , GRF model generates a refractive index profile for each pixel. To emulate the configuration of the cytology specimens in the experiment, we added the glass slide (refractive index n = 1.52) as the top and bottom medium that sandwich the cell. For each GRF-modeled axial refractive index profile, a one-dimensional multilayer dielectric slab model that implements Fresnel reflection [13] is used to generate its backscattering spectrum. The backscattering spectrum from each pixel was numerically resampled to evenly spaced wavenumbers and multiplied by a Hanning window before applying a fast Fourier transform. The Fourier transformed data at the prominent peak corresponding to the optical path length of interest depth z were selected for amplitude processing. After taking the discrete Fourier transform, a complex-valued F is obtained, and the amplitude can be extracted by taking the absolute value of :
| (2) |
The amplitude map is obtained by plotting the amplitude value at a certain depth plane for each pixel (5000 pixels in total). Based on the amplitude maps, three statistical parameters were quantified: the average amplitude over the two-dimensional spatial distribution of ; the standard deviation of the amplitude , and the ratio of to , referred to as fluctuation ratio .
2.2 Instrument
The hardware design of the optical system has previously been described [2,14]. Essentially, it simultaneously obtains a microscopic image and the spectral signature from every pixel of the image, which allows us to quantitatively analyze the spectral patterns at a microscopic level. In brief, a broadband white light from a Xe lamp was collimated by a 4f system and was focused on the sample by a low numerical aperture objective (NA = 0.4). The resulting backscattering signals were projected with a 44 × magnification onto the slit of an imaging spectrograph coupled with a CCD camera, which is mounted on a motorized linear scanning stage. The microscopic image is acquired by linearly scanning the slit of the spectrograph with a step size. The reflectance-mode microscopic image consists of a data cube , where k represents the free-space wavenumber and represents the spatial position of each pixel. The backscattering spectrum from each pixel is normalized by the spectral profile of the optical system using mirror reflection. The signal with a bandwidth between 500nm and 620nm is analyzed. The detected signal as a function of wavenumber is given by:
| (3) |
where is the source power spectral density, and represent the reference reflectivity and sample reflectivity respectively, corresponds to the optical path length of interest and is the optical path length difference between the reference and sample beams. The first two terms in Eq. (3) represent the DC terms, while the third term represents those related to the interference. By removing the DC terms and taking a Fourier transform of Eq. (3), we get the depth reflectivity profile of the sample, which can be described as
| (4) |
in which S is the total source power, is the sample reflectivity at depth of z, is the source center wavenumber. The amplitude can be calculated by taking the absolute value of :
| (5) |
2.3 Animal experiments
All animal studies were performed in accordance with the institutional Animal Care and Use Committee of University of Pittsburgh. All mice were housed in micro isolator cages in a room illuminated from 12-hr light-dark cycle, with access to water and ad libitum. Three 4.5 month-old C57BL wild-type mice and three age-matched C57BL Min mice were sacrificed. Their small intestines were removed, longitudinally opened and washed with phosphate buffered saline. Epithelial cells were obtained from brushing the visually normal mucosa of small intestine. The cytology brush was then quickly immersed into the Cytolyt® solution (Cytec Corporation). The slides were prepared by a standard Thin Prep processor (Cytec Corporation). Cells were then Papanicolaou-stained with a computer-controlled automated slide stainer and sealed with a mounting media (Cytoseal) and coverslip, following the standard clinical staining protocol. Cells were examined by an expert cytopathologist and non-cancerous looking cells were analyzed by SAM. For each mouse, about 20-30 cells are randomly selected for SAM analysis.
3. Results
3.1 Numerical experiments with gaussian random field model
To explore how the SAM-derived amplitude parameters are affected by the statistical properties of inhomogeneous refractive index distribution of cell internal structures, we performed numerical simulation with a series of biological cell models whose refractive index profile is modeled by one-dimensional Gaussian random field (GRF), which is described by three physical quantities: the average axial refractive index , the standard deviation of axial refractive index (i.e., the average magnitude of refractive index variation) and the spatial correlation length of refractive index , as defined in Section 2.1. Additionally, due to the intrinsic variations of cell thickness L, it is considered as another important variable in our numerical model. All values of these physical parameters were chosen to be within the cytologically relevant range, which is determined from our experimental data of cytological specimens from animal models and human patients.
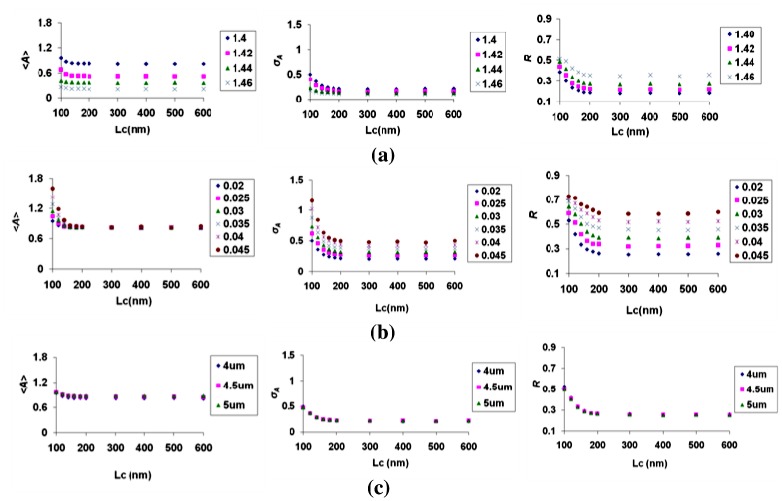
Based on the Fourier analysis of one-dimensional interferometric signals, three simple amplitude parameters were derived from SAM including the average amplitude , the standard deviation of the amplitude , and the fluctuation ratio R ( ). Figures 3(a) -3(c) demonstrate the dependence of these three parameters on the statistical properties of refractive index including average axial refractive index , the average magnitude of axial refractive index variation and the cell thickness L with different spatial correlation length of the refractive index. Assuming the biological cell has a weakly varying refractive index system, is chosen from a range of 100nm to 600nm. Figure 3(a) shows the effect of on these three amplitude parameters with fixed and thickness . It is evident that with increased , shows a significant decrease. On the other hand, is slightly decreased and R is moderately increased with the increase of . Figure 3(b) shows the dependence of the three SAM-derived parameters on with fixed and thickness . Increasing leads to a significant increase in both and R, but it only weakly increase . Figure 3(c) reveals the contribution of cell thickness L to the three SAM-derived parameters with fixed and . Apparently, the variation of cell thickness in the biologically relevant range has very little effect on any of the three parameters.
Fig. 3.
The dependence of statistical amplitude parameters – , and Ron the (a) average refractive index , (b) standard deviation of refractive index and (c) thickness L.
3.2 Experiments with animal model of intestinal carcinogenesis
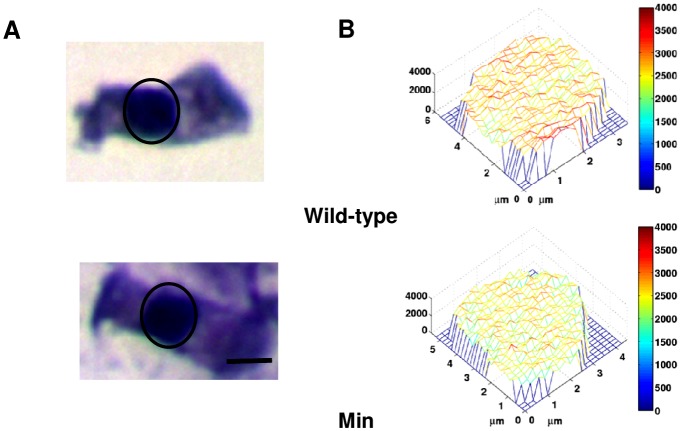
In order to demonstrate the capability of SAM to detect the subtle changes in cell refractive index and its potential in improving the diagnosis of early stage cancer, we used a well-established animal model of intestinal carcinogenesis – multiple intestinal neoplasia (Min) mouse model. It is a genetically modified animal model carrying the adenomatous polyposis coli (APC) gene mutation that spontaneously develops multiple intestinal adenomas. We analyzed the normal-appearing epithelial cells from small intestine from wild-type and Min mice at four and a half months. At this time point, the Min mice have developed macroscopically visible multiple adenomatous polyps. We analyzed the histologically normal-appearing intestinal epithelial cells from Min mice and those from wild-type mice (control group). Figure 4 shows their representative Papanicolaou-stained cytological images obtained from a conventional bright-field microscope and the corresponding amplitude maps from the cell nuclei. Although the microscopic cytological images look similar (as confirmed by an expert cytopathologist), the amplitude maps that characterize the refractive index variation of cell internal structures exhibit distinct differences. The three statistical parameters from the cell nuclei were calculated from the amplitude maps: the average amplitude ; the standard deviation of the amplitude over the entire nucleus, and the fluctuation ratio R.
Fig. 4.
Representative (A) cytological images and (B) the corresponding amplitude maps of cell nuclei (as shown in circles) of intestinal epithelial cells from the wild-type and the Min mice. Scale bars in the image indicate 5μm.
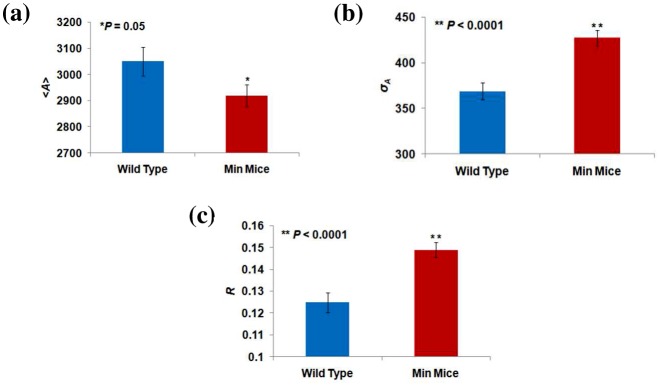
Figure 5 shows the statistical analysis of these three SAM-derived amplitude parameters from all epithelial cell nuclei in six mice (approximately 20-30 cells from each mouse and three mice in each group). Apparently, is significantly decreased in the cell nuclei of Min mice compared with those from wild-type mice ( ) as shown in Fig. 5.(a), indicating that the average axial refractive index of cell nuclei from Min mice is higher compared to those from the wild-type mice. Figure 5(b) shows that is significantly increased from the cell nuclei of Min mice compared to those of wild-type mice with high statistical significance ( ), revealing a higher axial refractive index fluctuation in the cell nuclei from Min mice. Similarly, Fig. 5(c) shows that R is also substantially increased in the epithelial cell nuclei of Min mice ( ), which reveals the higher ratio of axial refractive index fluctuation to the average axial refractive index ( ). The value R falls within the range from 0.1 to 0.2. Based on the lookup table created by the numerical simulation with a wide range of biologically relevant statistical properties of refractive index ( , , and L), the correlation length is estimated to be larger than 100 nm.
Fig. 5.
Statistical analysis of (a) , (b) and (c) Rin cytologically normal-appearing cell nuclei from wild-type and Min mice. The error bar represents the standard errors.
4. Discussion
We presented a simple approach to derive the statistical properties of complex and inhomogeneous refractive index properties of internal structures within a biological cell, based on Fourier analysis of interferometric signals from a microscopic image, referred to as Statistical Amplitude Microscopy (SAM). Although SAM does not give a detailed picture of complex refractive index distribution of cell internal structures, it provides quantitative parameters that are associated with the statistical properties of the spatial variation of refractive index within the biological cell. These statistical properties of refractive index are very sensitive to subtle sub-cellular structural alterations of carcinogenesis-associated cells that are not easily detectable with conventional microscopy techniques.
SAM derives three quantitative amplitude parameters – , and R that are closely associated with the statistical properties of sub-cellular refractive index, characterized by , , and L. The results from the numerical simulation show that although the correlation between amplitude parameters and cell refractive index properties is rather complex, each of the amplitude parameter has a dominating contributor under the configuration emulating the cytology specimens. The average amplitude is predominantly affected by the average axial refractive index , and increasing will decrease . The standard deviation of the amplitude is most affected by the average magnitude of axial refractive index variation , and increasing will increase . The alterations in fluctuation ratio R mainly arise from the changes in , with a minor contribution from , and is associated with the changes of . All three amplitude parameters are not affected by the correlation length of refractive index when is larger than 200 nm. The fact that the small changes in cell thickness do not alter the amplitude parameters is beneficial for many biomedical applications due to the intrinsic variation of cell thickness.
In order to demonstrate the ability of SAM for sensitive detection of carcinogenesis, a well-established animal model of intestinal carcinogenesis – Min mouse model was studied. We analyzed the intestinal epithelial cells that appear normal to the cytopathologist with a conventional microscopy. We found that the normal-appearing cells from Min mice resulted in a decreased and increased , when compared with those from wild-type mice. This result suggests that intestinal carcinogenesis is associated with increasing average refractive index and refractive index fluctuations in the cell nuclei. A higher average axial refractive index may indicate the higher density of nuclear components (e.g., chromatin), and a higher axial refractive index fluctuation may be associated with increased spatial variation of the concentration of intra-nuclear solids (e.g., DNA, RNA, protein). Notably, the fact that the standard deviation of the amplitude (p-value < 0.0001) has a much smaller p-value than the average amplitude (p-value = 0.05) implying that the refractive index variation may be more sensitive than the average refractive index in detecting the carcinogenesis-associated structural changes. It is worth pointing out that both and could be affected by the absorption of the stains that are commonly used in the biological cell, especially for the clinical specimens. Due to the well-controlled standardized automated staining protocol, the systemic variation of staining is small. The fluctuation ratio R of axial refractive index can be used as a more experimentally robust parameter to minimize the effect of stain absorption. Such SAM-derived quantitative statistical information about the subtle alterations in nuclear architecture is otherwise undetectable with conventional optical microscopy. To confirm that these cells are truly indistinguishable with conventional microscopy, we performed the quantitative analysis on conventional bright-field cytology images and found that the intensity parameters (i.e., average intensity and standard deviation of intensity) cannot distinguish cytologically normal-appearing epithelial cell nuclei from the wild-type and Min mice (p-value = 0.10 and 0.26, respectively).
5. Conclusions
In summary, statistical amplitude microscopy is presented as a simple method to gain insights into the statistical properties of refractive index variation within a single biological cell nucleus. Our results demonstrate the potential of SAM in the clinical application of optical microscopy for early cancer detection. It could be used to enhance the detection of cancer in cells that would otherwise be diagnosed as “normal” by conventional cytopathology. This technique could also be useful to detect the field carcinogenesis [1] by analyzing the normal-appearing cells from easily accessible location to predict the presence of neoplasia anywhere in the entire organ. Due to the simplicity of this approach, it has the potential to be disseminated into the clinical diagnostic laboratories.
Acknowledgements
This study was supported in part by National Institutes of Health grants R21CA138370 and R21CA152935, and University of Pittsburgh Medical Center. Wang P is supported by an appointment to the National Energy Technology Laboratory Research Participation Program, sponsored by the U.S. Department of Energy/Oak Ridge Institute for Science and Education.
References and links
- 1.Subramanian H., Roy H. K., Pradhan P., Goldberg M. J., Muldoon J., Brand R. E., Sturgis C., Hensing T., Ray D., Bogojevic A., Mohammed J., Chang J. S., Backman V., “Nanoscale cellular changes in field carcinogenesis detected by partial wave spectroscopy,” Cancer Res. 69(13), 5357–5363 (2009). 10.1158/0008-5472.CAN-08-3895 [DOI] [PMC free article] [PubMed] [Google Scholar]
- 2.Wang P., Bista R., Bhargava R., Brand R. E., Liu Y., “Spatial-domain low-coherence quantitative phase microscopy for cancer diagnosis,” Opt. Lett. 35(17), 2840–2842 (2010). 10.1364/OL.35.002840 [DOI] [PMC free article] [PubMed] [Google Scholar]
- 3.Popescu G., Deflores L. P., Vaughan J. C., Badizadegan K., Iwai H., Dasari R. R., Feld M. S., “Fourier phase microscopy for investigation of biological structures and dynamics,” Opt. Lett. 29(21), 2503–2505 (2004). 10.1364/OL.29.002503 [DOI] [PubMed] [Google Scholar]
- 4.Shaked N. T., Rinehart M. T., Wax A., “Dual-interference-channel quantitative-phase microscopy of live cell dynamics,” Opt. Lett. 34(6), 767–769 (2009). 10.1364/OL.34.000767 [DOI] [PMC free article] [PubMed] [Google Scholar]
- 5.Marquet P., Rappaz B., Magistretti P. J., Cuche E., Emery Y., Colomb T., Depeursinge C., “Digital holographic microscopy: a noninvasive contrast imaging technique allowing quantitative visualization of living cells with subwavelength axial accuracy,” Opt. Lett. 30(5), 468–470 (2005). 10.1364/OL.30.000468 [DOI] [PubMed] [Google Scholar]
- 6.Popescu G., Ikeda T., Dasari R. R., Feld M. S., “Diffraction phase microscopy for quantifying cell structure and dynamics,” Opt. Lett. 31(6), 775–777 (2006). 10.1364/OL.31.000775 [DOI] [PubMed] [Google Scholar]
- 7.Bruno O. P., Chaubell J., “Inverse scattering problem for optical coherence tomography,” Opt. Lett. 28(21), 2049–2051 (2003). 10.1364/OL.28.002049 [DOI] [PubMed] [Google Scholar]
- 8.Choi W., Fang-Yen C., Badizadegan K., Oh S., Lue N., Dasari R. R., Feld M. S., “Tomographic phase microscopy,” Nat. Methods 4(9), 717–719 (2007). 10.1038/nmeth1078 [DOI] [PubMed] [Google Scholar]
- 9.Charrière F., Marian A., Montfort F., Kuehn J., Colomb T., Cuche E., Marquet P., Depeursinge C., “Cell refractive index tomography by digital holographic microscopy,” Opt. Lett. 31(2), 178–180 (2006). 10.1364/OL.31.000178 [DOI] [PubMed] [Google Scholar]
- 10.Joo C., Akkin T., Cense B., Park B. H., de Boer J. F., “Spectral-domain optical coherence phase microscopy for quantitative phase-contrast imaging,” Opt. Lett. 30(16), 2131–2133 (2005). 10.1364/OL.30.002131 [DOI] [PubMed] [Google Scholar]
- 11.Sarunic M. V., Weinberg S., Izatt J. A., “Full-field swept-source phase microscopy,” Opt. Lett. 31(10), 1462–1464 (2006). 10.1364/OL.31.001462 [DOI] [PubMed] [Google Scholar]
- 12.R. J. Adler, The geometry of random fields (J. Wiley, Chichester Eng., New York, 1981). [Google Scholar]
- 13.U. S. Inan, and A. S. Inan, Electromagnetic waves (Prentice Hall, Upper Saddle River, N.J., 2000). [Google Scholar]
- 14.Liu Y., Li X., Kim Y. L., Backman V., “Elastic backscattering spectroscopic microscopy,” Opt. Lett. 30(18), 2445–2447 (2005). 10.1364/OL.30.002445 [DOI] [PubMed] [Google Scholar]


