Abstract
We present in-vivo 3D human vocal fold images with polarization sensitive optical coherence tomography (PS-OCT). Characterizing the extent and location of vocal fold lesions provides useful information in guiding surgeons during phonomicrosurgery. Previous studies showed that PS-OCT imaging can distinguish vocal fold lesions from normal tissue, but these studies were limited to 2D cross-sectional imaging and were susceptible to sampling error. In-vivo 3D endoscopic imaging was performed by using a recently developed 2-axis MEMS scanning catheter and a spectral domain OCT (SD-OCT), running at 18.5 frames/s. Imaging was performed in the operating room with patients under general anesthesia and 3D images were acquired either by 2D scanning of the scanner on the sites of interest or by combining 1D scanning and manual sliding to capture whole length of the vocal fold. Vocal fold scar, polyps, nodules, papilloma and malignant lesions were imaged and characteristics of individual lesions were analyzed in terms of spatial distribution and variation of tissue structure and birefringence. The 3D large sectional PS-OCT imaging showed that the spatial extent of vocal fold lesions can be found non-invasively with good contrast from normal tissue.
OCIS codes: (170.4500) optical coherence tomography, (170.2150) Endoscopic imaging, (170.3880) Medical and biological imaging, (260.5430) Polarization, (260.1440) Birefringence, (110.4500) Optical coherence tomography, Micro-optics
1. Introduction
Optical coherence tomography (OCT) is a non-invasive high-resolution imaging technique based on light back-reflection from within tissues [1]. OCT provides information on the sub-surface micro-structures of tissues to a few mm in depth, and has been found to be useful in clinical diagnosis by detecting structural changes non-invasively. Polarization sensitive OCT (PS-OCT) is an augmented OCT which measures both intensity and polarization state of back reflected light and provides additional information about tissue polarization properties such as birefringence [2]. While there are many birefringent tissue types (muscle, arteries, tendons, and dermis of skin), type I collagen contained in the deeper layers of vocal folds is birefringent and therefore imaged well with PS-OCT. Combining information from conventional OCT images and PS-OCT provides much better contrast to distinguish tissue layers, and between the normal and lesions than conventional OCT alone. PS-OCT has been applied to various pre-clinical and clinical studies: examples are external organs such as the eye [3–7] and skin [8–11], as well as internal organs such as the coronary artery [12,13] and vocal fold [14,15]. Internal organ imaging became possible with the development of miniaturized scanning catheters.
Vocal folds are voice generating organs, composed of two folds of musculomembranous tissue, located in the middle of the air way between the lung and the mouth. Vocal folds consist of a layered microstructure of the epithelium, lamina propria, and muscle. The lamina propria is comprised of superficial, medium and deep layers with increasing collagen content toward the deeper layers. The most important vibrating layers for vocalization are the superficial lamina propria (SLP) and epithelium. Most benign vocal fold lesions are confined superficially at the interface of the epithelium and SLP and invasion through the basement membrane of epithelium defines malignant lesions. Characterizing the extent and location of vocal fold lesions provides useful information in guiding surgeons during phonomicrosurgery. Since PS-OCT images sub-surface vocal fold tissue non-invasively, it may be useful for characterizing vocal fold lesions. Prior work has shown that PS-OCT images the interface between epithelium and SLP and detects collagen content within the layers of lamina propria [14]. In vivo human vocal fold imaging was previously performed with a conventional 1D scanning catheter and PS-OCT characterized vocal fold pathologies different from normal tissue [15,16]. Although these studies demonstrated the feasibility of PS-OCT imaging in vocal folds, imaging was limited to slow (1 frame/sec) sampling of 2D cross-sectional images on select areas and provided a small number of cross sectional images. Therefore, pathology characteristics could be missed in this imaging.
Recent advancement of OCT technology has enhanced imaging speed more than 100K depth-scans/s, and real time imaging or large sectional imaging has become possible. For internal organ imaging, the speed of the scanning catheter is another limiting factor. High-speed scanning catheters were developed for tubular organs, and comprehensive imaging covering large sections was demonstrated [17,18]. Other high-speed scanning catheters have been developed for non-tubular organ imaging [19–21]. We applied a recently developed 2-axis MEMS scanning catheter to the vocal fold study to overcome limitations of the previous studies such as imaging speed and area [21]. We could image vocal folds in 3D at the speed of 18.5 frames/s by using the MEMS scanning catheter and a spectral domain OCT (SD-OCT) [22]. The new system was applied to in-vivo imaging of various vocal fold pathologies such as nodule, polyp, scar, papilloma, and cancer. PS-OCT images and 3D volumes of individual pathologies will be presented.
2. Methods
Endoscopic OCT imaging was performed by using a 2-axis MEMS scanning catheter in conjunction with a multi-functional spectral domain OCT (SD-OCT) system. Details of the MEMS scanning catheter and the OCT system can be found in the literature [21,22]. In short, the MEMS catheter had a miniaturized scanner fabricated based on MEMS technology at the tip, and the scanner could deflect in two orthogonal axes driven magnetically by applying voltage waveform to electromagnets made of wound coils for individual axes. The MEMS scanner was driven with sinusoidal and linear waveforms for the fast and slow axes respectively. Image distortion in the fast axis due to the sinusoidal waveform was corrected with subsequent image processing. The catheter body was 2.7 mm in diameter and 12 mm in rigid length. In actual imaging, the catheter was sealed with a disposable clear plastic sheath (PEBAX, Innovative Medical Design, Amherst, NH) for protection, and the size became approximately 3 mm in diameter. The scanning range was more than +/− 28° in optical angle, which corresponded to more than 1.5 mm on the surface of the catheter. The multifunctional SD-OCT system could do both the intensity and polarization sensitive (PS) imaging simultaneously at the speed of 18.5 depth-scans/s, and its imaging depth was 1.5 mm in tissue with the assumption of tissue refractive index of 1.4. PS images displayed accumulated phase retardation between the fast and slow axes of the sample from the surface in a gray scale.
The procedural setup for imaging in-vivo has been previously described in the literature [15]. In short, PS-OCT imaging was performed in the operating room under general anesthesia. The study protocol was approved by the institutional review board (IRB) of Massachusetts General Hospital. The MEMS scanning catheter, which was sealed with the disposable plastic sheath, was introduced transorally through a standard laryngeal suction catheter. 3D images were obtained with the catheter in contact with the vocal fold and lesion. First, individual sections of interest were imaged in 3D with 2D scanning of the MEMS scanner while the catheter was held still. Its imaging size was approximately 1.5 mm x 1.5 mm on the surface. The acquisition time for each section was approximately 5 seconds by capturing 100 cross sectional images containing 1000 depth-scans/frame. Next, in order to image a large tissue area, the scanning catheter was advanced posteriorly to anteriorly along the vocal fold edge in the transverse plane, with the high speed MEMS scanner axis oriented in the orthogonal coronal plane. The full length of vocal fold edges, which was slightly more than 10 mm, could be imaged with this method. The acquisition time was approximately 15 – 20 seconds. During the acquisition, images were processed and displayed in real time on the screen of an acquisition computer. The whole imaging time of each session was less than 5 minutes.
3. Results
44 vocal folds in 22 patients were imaged with the MEMS scanning catheter. Benign vocal fold lesions included scar tissue (N = 2), polyp (N = 2), nodule (N = 2), papilloma (N = 4) and other rare benign lesions (N = 5). In addition, seven patients with malignant vocal fold lesions (N = 7) were imaged. When clinically indicated, biopsy or complete removal of the lesion established histological diagnosis. Representative large sectional 3D PS-OCT images of individual lesions are presented in Figs. 1 –10 . Video clips of reconstructed 3D vocal fold images with the progression of cross-sectional surfaces in two orthogonal directions are presented together along with an intra-operative wide field image of the vocal fold lesion.
Fig. 1.

Wide field image (a), 3D PS-OCT image of polyp (b, intensity: left, PS: right), and cross-sectional images (c-e).
Fig. 10.
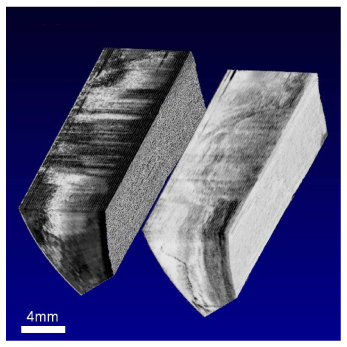
( Media 5 (3MB, MOV) ) Video clip of 3D PS-OCT image of the carcinoma-in situ case.
3.1 Polyp
The wide field image and 3D reconstructed PS-OCT image of a right vocal fold polyp are shown in Fig. 1, and a video clip of the 3D PS-OCT image is shown in Fig. 2 . The PS-OCT image shows 3D intensity and PS images side by side, and three cross-sectional images at selected regions. The video clip shows internal structures of the vocal fold with moving cross-sections. In the wide field image, the polyp appears on the mid-portion of the right vocal fold as a local swelling. In the PS-OCT image, the polyp appears as a small surface irregularity [Fig. 2(b), intensity image], because most of the polyp was compressed by the catheter during manual scanning. The polyp appears as a fluid filled sac covered with an outer tissue layer and has little or no banding pattern (birefringence) as shown in the cross-sectional image of polyp section in Fig. 1(d).
Fig. 2.
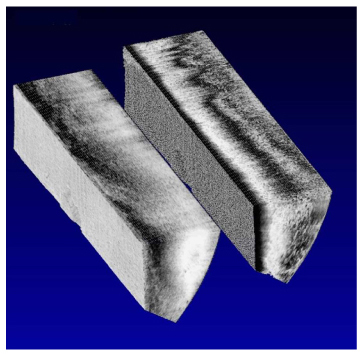
( Media 1 (3MB, MOV) ) Video clip of 3D PS-OCT image of polyp.
3.2 Nodule
Wide-field, 3D reconstructed PS-OCT still images of a vocal fold nodule and a 3D PS-OCT video clip are shown in Figs. 3 and 4 respectively. The nodules appear in the mid-portion of the vocal folds bilaterally as symmetric swellings in the wide-field image [Fig. 3(a)]. The PS-OCT image of the left vocal fold shows irregular tissue structures in the nodule region [arrows in Fig. 3(b), intensity image], and the boundary between the epithelium and SLP is not clear. The irregular structures could be either the thickened epithelium or loose fibrous structure in the SLP. The nodule shows a relatively weak banding pattern, especially in the section showing loose tissue structures in the PS image.
Fig. 3.
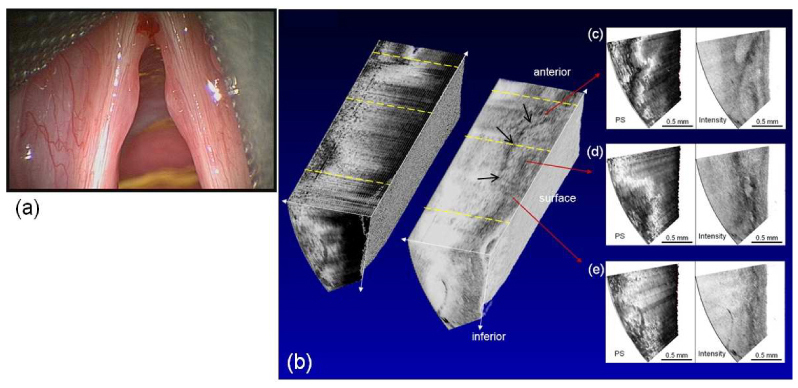
Wide-field image (a) and 3D PS-OCT image of nodule (b, intensity: right, PS: left), and cross-sectional images (c-e).
Fig. 4.
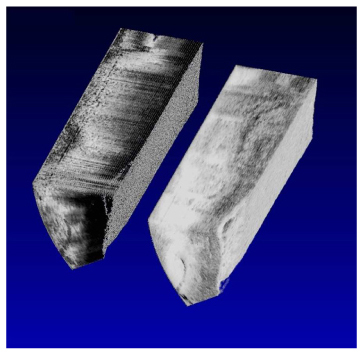
( Media 2 (2.2MB, MOV) ) Video clip of the 3D PS-OCT image of nodule.
3.3 Papilloma
Wide-field, 3D reconstructed PS-OCT still images of vocal fold papilloma and a 3D PS-OCT video clip are shown in Figs. 5 and 6 respectively. The papilloma appears in the wide-field image as an exophytic fibrovascular growth on the right anterior vocal fold -P—papilloma in Fig. 5(a). The PS-OCT image of the right side also shows a clear boundary between normal tissue posteriorly and papilloma anteriorly [arrow in Fig. 5(b), intensity image]. The normal tissue posteriorly shows layered tissue structures with the basement membrane in the intensity image [Fig. 5(e)], and a horizontal black and white banding pattern in the PS image [bracket labeled H in Fig. 5(b), PS image]. However, the papilloma anteriorly shows homogeneous vertically aligned structures rather than layered tissue structure in the intensity image [Fig. 5(c)]. Also, the black-white banding pattern of the PS image of papilloma is irregular and aligned in the vertical direction rather than in the horizontal [bracket labeled V in Fig. 5(b), PS image]. The boundary between normal tissue and papilloma is clear in the PS-OCT image [* at boundary between brackets of Fig. 5(b), PS image].
Fig. 5.
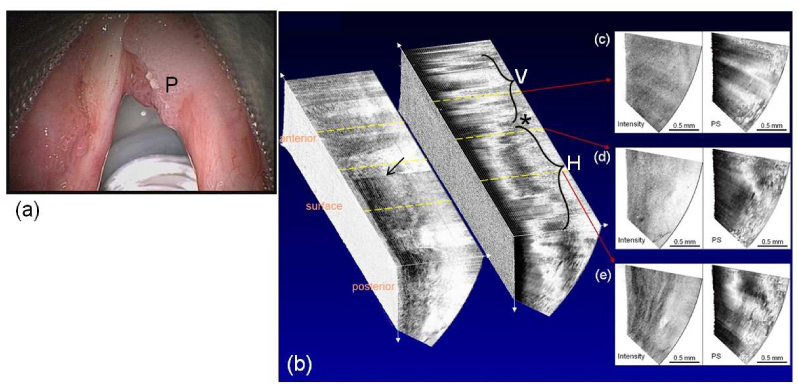
Wide-field image (a) and 3D PS-OCT image of papilloma (b, intensity: left, PS: right), and cross-sectional images (c-e).
Fig. 6.
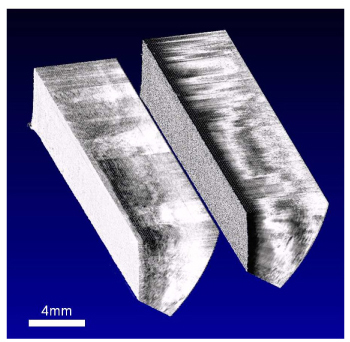
( Media 3 (3.5MB, MOV) ) Video clip of 3D PS-OCT image of papilloma.
3.4 Cancer and carcinoma-in situ
The images from two representative cancer cases are presented here. The first case is a deeply invasive cancer which extends beyond the 1.5 mm imaging depth of the current PS-OCT system. Wide-field, 3D reconstructed PS-OCT still images of the thick cancer and a 3D PS-OCT video clip for this case are shown in Figs. 7 and 8 respectively. In the wide-field image, the cancer is seen bilaterally as a combination of raised irregular white and red areas. The intensity image shows homogeneous structures posteriorly and layered structures anteriorly. In addition, the intensity image posteriorly turns white quickly with depth due to the fast signal decay, compared to the images obtained more anteriorly. This is because the cancer tissue is usually highly scattering and suggests deeper cancer invasion posteriorly. In the PS image, almost no or irregular banding patterns are seen posteriorly, but clear horizontal banding patterns (indicative of normal vocal fold microstructure) are seen anteriorly. Three cross-sectional images show the transition from cancer to normal tissue as the cross-section goes from posterior to anterior [Fig. 7(e): cancer, Fig. 7(d): transition, Fig. 7(c): normal]. This 3D PS-OCT image shows a clear distinction between the cancer side (posterior) and normal side (anterior) in both the intensity and PS images, but the PS image shows the difference with better contrast [* marks this boundary in Fig. 7(b), PS image].
Fig. 7.
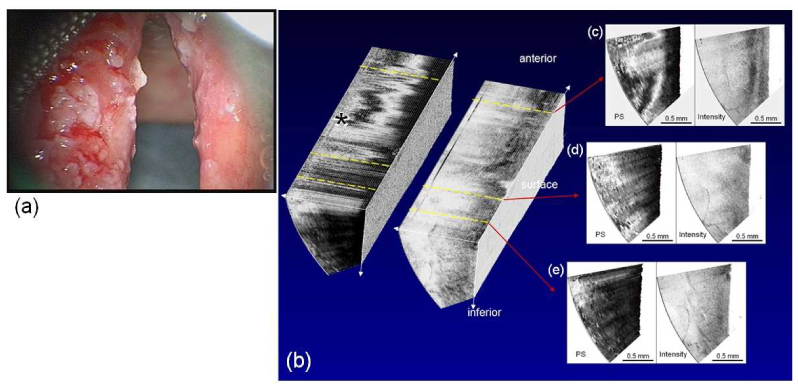
Wide-field image (a) and 3D PS-OCT image of a deeply invasive cancer case (b, intensity: right, PS: left), and cross-sectional images (c-e).
Fig. 8.
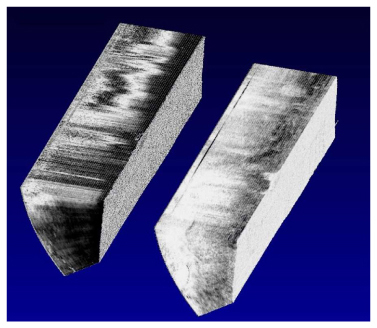
( Media 4 (2.8MB, MOV) ) Video clip of 3D PS-OCT image of the deeply invasive cancer case.
The second case is carcinoma-in situ originating on the left vocal fold as shown in the wide-field image (Fig. 9 ). These lesions contain malignant cells but are confined to the epithelium with no invasion through the epithelial basement membrane. The 3D PS-OCT image of the left vocal fold in Fig. 9 shows the lesion confined superficially within the epithelium in both the intensity [arrows in Fig. 9(b)] and PS images [bracket showing loss of banding pattern in Fig. 9(b)], and the corresponding video clip (Fig. 10) shows internal structures in various cross-sections. The intensity image shows some boundary structures between cancerous and normal tissue [Figs. 9(d), 9(e)]. The PS image shows little horizontal banding pattern on the superficial layer and a white band occurs in the lower layer indicating birefringence [Fig. 9(d)]. There is a clear boundary between the carcinoma-in situ lesion and normal tissue.
Fig. 9.
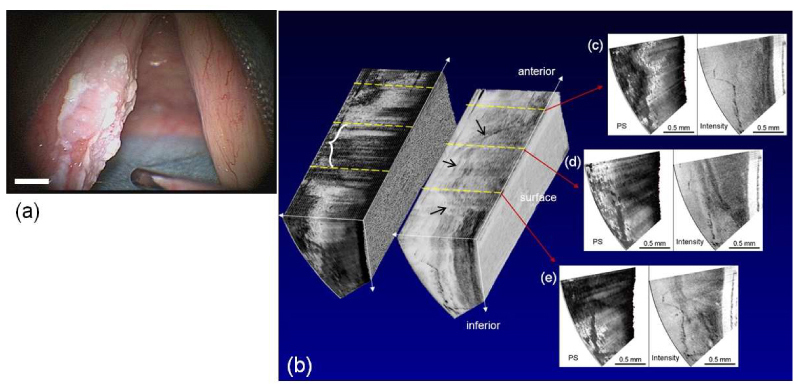
Wide-field image (a) and 3D PS-OCT image of a carcinoma-in situ case (b, intensity: right, PS: left), and cross-sectional images (c-e).
4. Discussion
Various human vocal fold lesions were imaged in 3D with the MEMS scanning catheter and spectral domain PS-OCT. Even though the MEMS scanner used in this study had a very large scanning angle of 46°, the scanning area was limited to 1.5 mm x 1.5 mm on the surface, which covered only a small section of vocal fold. To overcome this limitation, we advanced the probe posterior to anterior over the vocal fold to image its entire length. This large sectional 3D imaging provided information on the spatial distribution and depth of penetration of lesions on vocal folds. Individual lesions were analyzed based on tissue structure and birefringence. Most of the vocal fold lesions showed loss of tissue birefringence characteristic of a normal SLP, because the lesion’s microstructures tend to be disorganized. Therefore, PS images of PS-OCT provided a good additional contrast mechanism to distinguish lesions from normal tissue. Large sectional PS-OCT imaging was very effective to show spatial distribution of vocal fold lesions non-invasively.
Since most of vocal fold lesions showed loss of birefringence and tissue structure, PS-OCT could not differentiate among different lesions and is not be suitable to be used alone. PS-OCT needs to be used in combination with wide-field imaging for both the identification and spatial extent of vocal fold lesions.
Although the manual sliding method of advancing the imaging probe from posterior to anterior could extend imaging range to the whole length, there were technical difficulties. Since imaging occurs by placing the imaging probe in contact with the tissue, the vocal fold surface could be adequately positioned to allow imaging of the superior and inferior surfaces of these lesions. During imaging, perturbation occurred due to surface irregularity of the lesions and variability in speed during catheter sliding over the vocal fold. Such artifacts could be found in reconstructed 3D images. In principle, these artifacts could be compensated with image processing such as cross-correlation. Although this manual sliding method could extend the screening area significantly in length, this method couldn’t cover the entire section of the vibrating vocal fold due to narrow width coverage of 1.5 mm. Therefore, there should be some way to increase the scanning area in both width and length. Given that the size and the scanning angle of the catheter are limited practically, one improvement could be to create a greater distance between the scanning catheter and the tissue to be imaged. Then a larger area could be imaged with the same scanning angle. However, this would require a larger diameter of the catheter. Finally, lesions are typically thicker than the 1.5 mm imaging depth range of the OCT. Therefore, OCT imaging may not be able to show the depth of extension of thicker and more exophytic lesions. This is a fundamental problem faced by OCT technology in studying vocal folds. However, PS-OCT imaging may be still useful post-operatively for lesion surveillance since the exophytic part of the lesion would have been excised during surgery.
5. Conclusions
High quality images of various benign and malignant human vocal fold lesions were attained utilizing 3D PS-OCT with the 2-axis MEMS scanning catheter and SD-OCT. Real time 3D imaging helped to characterize individual vocal fold lesions by providing their spatial distribution and variation, and demarcated the boundary between lesions and normal tissue. The full length of the vocal folds could be imaged by manually sliding the MEMS scanning catheter along the length of the vocal fold. These large sectional PS-OCT images showed the spatial distribution of lesions on the vocal fold in-vivo. 3D PS-OCT vocal fold imaging has potentially useful clinical application in imaging the layered microstructure of vocal folds and may serve as a useful adjunct in phonomicrosurgery.
Acknowledgements
This research was supported in part by the POSTECH Basic Science Research Institute Grant, the Korean Science Foundation Grant (4.0004598), the World Class University Program of Korean Science Foundation (4.0004533), the National Institute of Health (R01 RR19768), the Dutch Science Foundation (FOM 09NIG03), and by the Department of the US Army (W81XWH-07-2-0011). The content of the information does not necessarily reflect the position or the policy of the US Government, and no official endorsement should be inferred.
References and links
- 1.Huang D., Swanson E. A., Lin C. P., Schuman J. S., Stinson W. G., Chang W., Hee M. R., Flotte T., Gregory K., Puliafito C. A., Fujimoto J. G., “Optical coherence tomography,” Science 254(5035), 1178–1181 (1991). 10.1126/science.1957169 [DOI] [PMC free article] [PubMed] [Google Scholar]
- 2.de Boer J. F., Milner T. E., “Review of polarization sensitive optical coherence tomography and Stokes vector determination,” J. Biomed. Opt. 7(3), 359–371 (2002). 10.1117/1.1483879 [DOI] [PubMed] [Google Scholar]
- 3.Cense B., Chen T. C., Park B. H., Pierce M. C., de Boer J. F., “In vivo depth-resolved birefringence measurements of the human retinal nerve fiber layer by polarization-sensitive optical coherence tomography,” Opt. Lett. 27(18), 1610–1612 (2002), http://www.opticsinfobase.org/ol/abstract.cfm?URI=ol-27-18-1610 10.1364/OL.27.001610 [DOI] [PubMed] [Google Scholar]
- 4.Cense B., Chen T. C., Park B. H., Pierce M. C., de Boer J. F., “Thickness and birefringence of healthy retinal nerve fiber layer tissue measured with polarization-sensitive optical coherence tomography,” Invest. Ophthalmol. Vis. Sci. 45(8), 2606–2612 (2004). 10.1167/iovs.03-1160 [DOI] [PubMed] [Google Scholar]
- 5.Miyazawa A., Yamanari M., Makita S., Miura M., Kawana K., Iwaya K., Goto H., Yasuno Y., “Tissue discrimination in anterior eye using three optical parameters obtained by polarization sensitive optical coherence tomography,” Opt. Express 17(20), 17426–17440 (2009), http://www.opticsinfobase.org/oe/abstract.cfm?URI=oe-17-20-17426 10.1364/OE.17.017426 [DOI] [PubMed] [Google Scholar]
- 6.Yasuno Y., Yamanari M., Kawana K., Oshika T., Miura M., “Investigation of post-glaucoma-surgery structures by three-dimensional and polarization sensitive anterior eye segment optical coherence tomography,” Opt. Express 17(5), 3980–3996 (2009), http://www.opticsinfobase.org/oe/abstract.cfm?URI=oe-17-5-3980 10.1364/OE.17.003980 [DOI] [PubMed] [Google Scholar]
- 7.Götzinger E., Pircher M., Geitzenauer W., Ahlers C., Baumann B., Michels S., Schmidt-Erfurth U., Hitzenberger C. K., “Retinal pigment epithelium segmentation by polarization sensitive optical coherence tomography,” Opt. Express 16(21), 16410–16422 (2008), http://www.opticsinfobase.org/oe/abstract.cfm?URI=oe-16-21-16410 10.1364/OE.16.016410 [DOI] [PMC free article] [PubMed] [Google Scholar]
- 8.Strasswimmer J., Pierce M. C., Park B. H., Neel V., de Boer J. F., “Polarization-sensitive optical coherence tomography of invasive basal cell carcinoma,” J. Biomed. Opt. 9(2), 292–298 (2004). 10.1117/1.1644118 [DOI] [PubMed] [Google Scholar]
- 9.Sakai S., Yamanari M., Miyazawa A., Matsumoto M., Nakagawa N., Sugawara T., Kawabata K., Yatagai T., Yasuno Y., “In vivo three-dimensional birefringence analysis shows collagen differences between young and old photo-aged human skin,” J. Invest. Dermatol. 128(7), 1641–1647 (2008). 10.1038/jid.2008.8 [DOI] [PubMed] [Google Scholar]
- 10.Sakai S., Nakagawa N., Yamanari M., Miyazawa A., Yasuno Y., Matsumoto M., “Relationship between dermal birefringence and the skin surface roughness of photoaged human skin,” J. Biomed. Opt. 14(4), 044032 (2009). 10.1117/1.3207142 [DOI] [PubMed] [Google Scholar]
- 11.Park B. H., Saxer C., Srinivas S. M., Nelson J. S., de Boer J. F., “In vivo burn depth determination by high-speed fiber-based polarization sensitive optical coherence tomography,” J. Biomed. Opt. 6(4), 474–479 (2001). 10.1117/1.1413208 [DOI] [PubMed] [Google Scholar]
- 12.Nadkarni S. K., Pierce M. C., Park B. H., de Boer J. F., Whittaker P., Bouma B. E., Bressner J. E., Halpern E., Houser S. L., Tearney G. J., “Measurement of collagen and smooth muscle cell content in atherosclerotic plaques using polarization-sensitive optical coherence tomography,” J. Am. Coll. Cardiol. 49(13), 1474–1481 (2007). 10.1016/j.jacc.2006.11.040 [DOI] [PMC free article] [PubMed] [Google Scholar]
- 13.Oh W. Y., Yun S. H., Vakoc B. J., Shishkov M., Desjardins A. E., Park B. H., de Boer J. F., Tearney G. J., Bouma B. E., “High-speed polarization sensitive optical frequency domain imaging with frequency multiplexing,” Opt. Express 16(2), 1096–1103 (2008), http://www.opticsinfobase.org/oe/abstract.cfm?URI=oe-16-2-1096 10.1364/OE.16.001096 [DOI] [PMC free article] [PubMed] [Google Scholar]
- 14.Burns J. A., Zeitels S. M., Anderson R. R., Kobler J. B., Pierce M. C., de Boer J. F., “Imaging the mucosa of the human vocal fold with optical coherence tomography,” Ann. Otol. Rhinol. Laryngol. 114(9), 671–676 (2005). [DOI] [PubMed] [Google Scholar]
- 15.Klein A. M., Pierce M. C., Zeitels S. M., Anderson R. R., Kobler J. B., Shishkov M., de Boer J. F., “Imaging the human vocal folds in vivo with optical coherence tomography: a preliminary experience,” Ann. Otol. Rhinol. Laryngol. 115(4), 277–284 (2006). [DOI] [PubMed] [Google Scholar]
- 16.Bouma B. E., Tearney G. J., “Power-efficient nonreciprocal interferometer and linear-scanning fiber-optic catheter for optical coherence tomography,” Opt. Lett. 24(8), 531–533 (1999). 10.1364/OL.24.000531 [DOI] [PubMed] [Google Scholar]
- 17.Yun S. H., Tearney G. J., Vakoc B. J., Shishkov M., Oh W. Y., Desjardins A. E., Suter M. J., Chan R. C., Evans J. A., Jang I. K., Nishioka N. S., de Boer J. F., Bouma B. E., “Comprehensive volumetric optical microscopy in vivo,” Nat. Med. 12(12), 1429–1433 (2007). 10.1038/nm1450 [DOI] [PMC free article] [PubMed] [Google Scholar]
- 18.Adler D. C., Zhou C., Tsai T. H., Schmitt J., Huang Q., Mashimo H., Fujimoto J. G., “Three-dimensional endomicroscopy of the human colon using optical coherence tomography,” Opt. Express 17(2), 784–796 (2009), http://www.opticsinfobase.org/oe/abstract.cfm?URI=oe-17-2-784 10.1364/OE.17.000784 [DOI] [PMC free article] [PubMed] [Google Scholar]
- 19.Aguirre A. D., Hertz P. R., Chen Y., Fujimoto J. G., Piyawattanametha W., Fan L., Wu M. C., “Two-axis MEMS scanning catheter for ultrahigh resolution three-dimensional and en face Imaging,” Opt. Express 15(5), 2445–2453 (2007), http://www.opticsinfobase.org/abstract.cfm?URI=oe-15-5-2445 10.1364/OE.15.002445 [DOI] [PubMed] [Google Scholar]
- 20.Jung W., Zhang J., Wang L., Wilder-Smith P., Chen Z., McCormick D. T., Tien N. C., “Three-dimensional optical coherence tomography employing a 2-axis microelectromechanical scanning mirror,” IEEE J. Sel. Top. Quantum Electron. 11(4), 806–810 (2005). 10.1109/JSTQE.2005.857683 [DOI] [Google Scholar]
- 21.Kim K. H., Park B. H., Maguluri G. N., Lee T. W., Rogomentich F. J., Bancu M. G., Bouma B. E., de Boer J. F., Bernstein J. J., “Two-axis magnetically-driven MEMS scanning catheter for endoscopic high-speed optical coherence tomography,” Opt. Express 15(26), 18130–18140 (2007), http://www.opticsinfobase.org/oe/abstract.cfm?URI=oe-15-26-18130 10.1364/OE.15.018130 [DOI] [PubMed] [Google Scholar]
- 22.Park B. H., Pierce M. C., Cense B., Yun S. H., Mujat M., Tearney G. J., Bouma B. E., de Boer J. F., “Real-time fiber-based multi-functional spectral-domain optical coherence tomography at 1.3 microm,” Opt. Express 13(11), 3931–3944 (2005), http://www.opticsinfobase.org/abstract.cfm?URI=oe-13-11-3931 10.1364/OPEX.13.003931 [DOI] [PubMed] [Google Scholar]


