Abstract
We demonstrate an integrated FPGA solution to project highly stabilized, aberration-corrected stimuli directly onto the retina by means of real-time retinal image motion signals in combination with high speed modulation of a scanning laser. By reducing the latency between target location prediction and stimulus delivery, the stimulus location accuracy, in a subject with good fixation, is improved to 0.15 arcminutes from 0.26 arcminutes in our earlier solution. We also demonstrate the new FPGA solution is capable of delivering stabilized large stimulus pattern (up to 256x256 pixels) to the retina.
OCIS codes: (170.0170) Medical optics and biotechnology, (170.4460) Ophthalmic optics
1. Introduction
This is the third in a series of papers describing the computational part of the Adaptive Optics Scanning Laser Ophthalmoscope (AOSLO) system. The AOSLO is a high-resolution instrument used for both imaging the retina and delivering visual stimuli for clinical and experimental purposes [1].
Adaptive optics (AO) is a set of techniques that measure and compensate or manipulate aberrations in optical systems [2]. The first application of AO for the eye was in a flood-illumination CCD-based retinal camera [3] where resolution sufficient to visualize individual cones was demonstrated. Since that time, AO imaging has been integrated into alternate imaging modalities including SLO [1,4–8] and optical coherence tomography [9–11] and is being used in all systems for an expanding range of basic [12,13] and clinical applications [14–16].
AO systems are also used to correct or manipulate aberrations to control the blur on the retina for human vision testing [3,17–21]. Stimulus delivery to the retina and vision testing can also be done with an AOSLO with the advantage that the scanning nature of the system facilitates the delivery of a stimulus directly onto the retina through computer-controlled modulation of the scanning beam or a source of a second wavelength that is optically coupled in the system. Modulating the imaging beam causes the stimulus to be encoded directly onto the recorded image so the exact placement of the stimulation can be determined. The delivery of light stimuli to the retina in this manner was conceived for SLOs at the time of its invention in 1980 [22] and implemented shortly thereafter [23,24] but, to our knowledge, our lab is the only one to implement this feature in an SLO with adaptive optics [25,26].
Since the AOSLO is used with living human eyes, normal involuntary eye motion, even during fixation, causes the imaging raster to move continually across the retina in a constrained pattern consisting of drift, tremor and saccades. (for details on human fixational eye motion the reader is referred to a review by Martinez-Conde [27], although more recent data suggests eye motion follows a nearly 1/f power spectrum [28]). The motion is fast enough to cause unique distortions in each AOSLO video frame due to the relatively slow scan velocity in the vertical axis [29,30]. Most clinical and experimental uses of the instrument require that the raw AOSLO image be stabilized and dewarped to present the user with an interpretable image.
Several methods for recovering eye motion from scanned laser images have been described in various reports [31,32]. The concepts of the particular method that we use were first presented by Mulligan et al. [33] but the first full implementation of this method in a scanning laser ophthalmoscope (including non-AO systems) was reported by our group [29,30]. For convenience, we describe the method briefly here. Like any scanning laser imaging system, each frame in AOSLO is collected, pixel-by-pixel, and line-by-line as the detector records the magnitude of scattered light from a focused spot while it scans across the sample in a raster pattern, in this case the retina. Given that each frame is collected over time, small eye motions relative to the raster scan gives rise to unique distortions in each individual frame. In essence, these distortions are a chart record of the eye motion that has caused them, and recovery of the eye motion is done in the following way: First, a reference frame is selected or generated. Then all the frames in the video sequence are broken up into strips that are parallel to the fast scanning mirror direction. Each strip is cross-correlated with the reference frame and its x and y displacements provide the relative motion of the eye at the time point relative to the reference frame. Each subsequent frame is redrawn according to the sequence of x and y displacements to align it with the reference frame. This operation can be done offline and can employ any cross-correlation method. The frequency of eye tracking and distortion correction is simply the product of the number of strips per frame and the frame rate of the imaging system. If the operation of measuring and correcting eye motion is done in real time, it allows one to track retinal motion, and can be used to guide the placement of a stimulus beam onto targeted retinal locations [34]. Stabilized stimulus delivery is the topic of the second paper in this series [35].
This, the third paper in the series, describes the hardware interface developed to take full advantage of the computations described in the first two papers. In the evolution of the AOSLO system, commercial-off-the-shelf (COTS) interface boards were the natural first choice to connect the optical instrument to the control and data collection computer. In the imaging path, a standard frame-grabber (Matrox Helios-eA/XA) with analog-to-digital (A/D) conversion collected the video stream from the instrument sensor and sync signals originating from the scanning mirror servo circuits. This interface transferred digitized image sections to the computer for further processing. In the stimulus path, another board provided buffers for digital stimulus patterns and the digital-to-analog (D/A) converter to send these in raster order to the stimulus laser modulator. Figure 1 illustrates the procedure of real-time stimulus delivery.
Fig. 1.
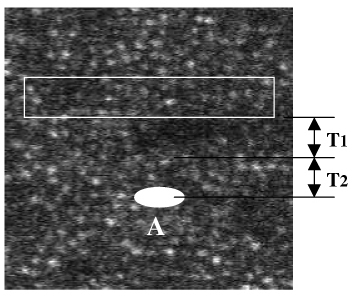
Operation of stimulus laser to draw a stimulus pattern at the target location labeled ‘A’ on the figure.
To operate the stimulus laser to draw a stimulus on the target before the imaging raster scans this target location, the software needs additional time, or latency (T1 + T2), where T1 is computational latency and T2 is operational latency. The algorithm needs time T1 to calculate the location of target ‘A’ and the software needs time T2 to encode the stimulus pattern data to the stimulus laser. This guarantees the stimulus pattern to appear on the target location before the imaging raster comes. If (T1 + T2) is not large enough, only partial or no stimulus pattern will be scanned by the imaging raster. Here data (T1 + T2) before the target is used to calculate the target location, hence we also call it ‘predictive’ approach. Obviously, the larger (T1 + T2), the less accurate the target location. Section 2 and Section 3 will describe an approach to balance the value of (T1 + T2). Therefore, the positioning of the stimulus raster within the imaging raster was controlled by setting the delays relative to the V-sync and H-sync signals originating from the scanning mirror servos. The stimulus pattern data and the delays were provided to this board from the same computer that captured the imaging video data, and all the boards were synchronized at the beginning of each vertical scan and each horizontal scan by the distribution of the V-sync and H-sync signals from the AOSLO instrument. The architecture of this multiple-board interface is shown in Fig. 2 .
Fig. 2.
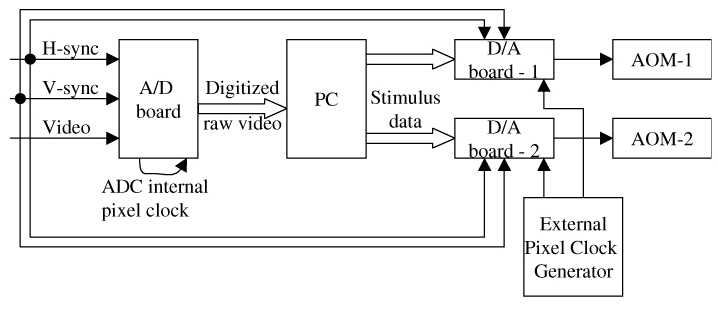
Architecture of the multiple-board solution. The A/D board is a commercially available image grabber (Matrox Helios-eA), and the two D/A boards have 14-bit with 60MS/s (Strategic Test, model #:UF-6020). The former is used to sample the real-time, nonstandard AOSLO video signal (with independent H-sync, V-sync and data channels), and the latter is used to modulate stimulus patterns to drive two acoustic-optic modulators (AOM), one for the imaging light source and the other for the stimulus light source. A PC is used to run the algorithm and the software.
The multiple-board solution had been working adequately for some purposes (e.g., anaesthetized monkey eyes [34] or healthy human eyes with good fixation [35]) but was not taking full advantage of either the optical capabilities of the AOSLO or the computations for stimulus delivery. First, due to limitations in the architecture of the buffering in the board used to control the stimulus laser modulator, the time to predict the location of a stimulus target locus had to be computed considerably longer in advance than ideal. This necessarily resulted in statistically less accurate placement of the stimulus, as described in [35]. Figure 3 illustrates the accuracy of stimulus location as a function of latency.
Fig. 3.
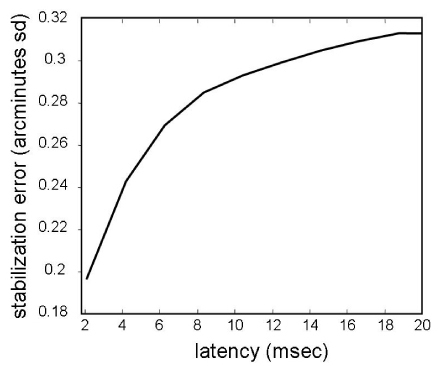
The RMS error of stimulus location as a function of latency. The stabilization error is computed from actual high frequency eye traces extracted from previously recorded AOSLO videos. The eye motion trace was extracted from an AOSLO video using methods described by Stevenson et al. [30]. The plot is generated by computing the average displacement between two points on a saccade-free portion of the eye motion trace as a function of the temporal separation (latency) between the two points. The noise of the eye motion trace is low (standard deviation error of 0.07 arcminutes [29]) but since it is random, it does not affect the estimate of the average stabilization error. As such, this calculation of the impact of latency on stimulus placement accuracy is general to all tracking systems. It should be noted that this plot represents a typical error. In practice, the actual stabilization error will depend on the specific motion of the eye that is being tracked.
Second, because the imaging and stimulus interfaces could only be synchronized at the beginning of each scan line (i.e. via the H-sync signal), the timing for the acquisition of a given pixel on the imaging side and the delivery of the stimulus that should correspond to that same pixel was only implicit, and depended on the similarity of the dynamics of two independent phase-locked loops (PLLs) on separate boards, made by two different manufacturers.
Our approach to remedy these deficiencies was to replace the dual-board solution with a single purpose-designed interface board which integrated both the imaging capture and the stimulus delivery with buffers optimized for each purpose and driven from a common pixel clock so that the modulation of the stimulus laser for a given pixel would inherently take place at exactly the same time as the same pixel in the raster was captured on the imaging path. Not only would this improve the system performance, but it would be accomplished a significantly lower cost. Whereas, the current multiple-board solution costed about $15,000 per instrument, the custom integrated interface board described here costed about $1,650 per instrument, including a standard FPGA development kit board (Xilinx ML-506, $1,200), a 14-bit DAC module (TI DAC2904-EVM, $150, for high accuracy AOM control), and cables and connectors ($300).
For those readers not familiar with the technology, a field-programmable gate array (FPGA) is an integrated circuit designed to be configured by the customer or designer after manufacturing—hence “field-programmable”. The FPGA configuration is generally specified using a hardware description language (HDL), similar to that used for an application-specific integrated circuit (ASIC) (circuit diagrams were previously used to specify the configuration, as they were for ASICs, but this is increasingly rare). FPGAs can be used to implement any logical function that an ASIC could perform. The ability to update the functionality after shipping, and the low non-recurring engineering costs relative to an ASIC design (not withstanding the generally higher unit cost), offer advantages for many applications.
FPGAs contain programmable logic components called “logic blocks”, memory blocks, computational elements and a hierarchy of reconfigurable interconnects that allow the blocks to be “wired together”—somewhat like a one-chip circuit “breadboard.” These hardware resources are meant to be configured by the designer into a functional hardware system. The A/D, D/A converters and the hardware to provide an interface to the PC is not included in the FPGA but is available already integrated on several standard development boards. We used the Xilinx ML-506 board (San Jose, USA) which comes with a Virtex-5 FPGA and is integrated with three independent channels of 8-bit A/D, three independent channels of 8-bit D/A, and one 1-lane PCIe interface.
This paper describes the architecture and implementation of the custom interface and the considerations that drove the design. We report this not only because experimenters using this or a similar interface design must know the specific characteristics which affect their experimental results, but because the design considerations are generalizable to bi-directional interfaces between optical instruments and the computers that control them. For example, without changing the electronics, we can conveniently upgrade the FPGA and PC applications for other AOSLO systems that have the same hardware interfaces such as independent external H-sync, V-sync and data channels, and AOM-controlled laser beams.
2. Computational system architecture
The architecture of the hardware interface, whether implemented by the two COTS boards or the integrated FPGA-based board, is governed by the dataflow in the whole AOSLO system. The dataflow from the instrument, to algorithm, software GUI, and back to the instrument is illustrated in Fig. 4 .
Fig. 4.
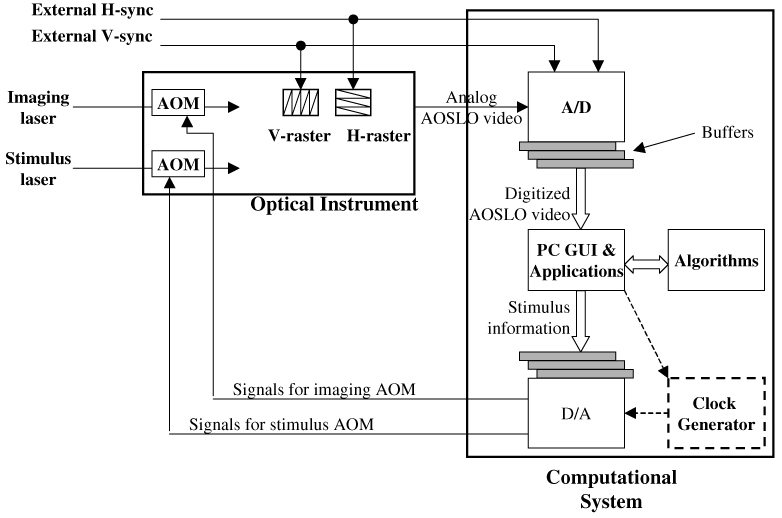
Generalized dataflow of the optical instrument and the computational system. This architecture is applicable to both multiple-board and integrated board solutions.
In Fig. 4, the analog monochrome video signal from the AOSLO optical system is digitized by one channel of the analog-to-digital converter (A/D), while H-sync and V-sync signals generated by the AOSLO mirror-control hardware provide timing inputs via two other A/D channels. Two AOMs in the AOSLO optical paths (imaging channel and stimulus channel) modulate the scanning laser power under control of the computational system via two digital-to-analog channels. The digitized video stream from the A/D is collected in a buffer before being transferred to the PC. In the output path, the stimulus raster pattern is uploaded to a data buffer on the adaptor. In the system using individual interface adaptors for input and output, an independent pixel clock generator (the block with dashed box) is required to drive the output adaptor. With the integrated interface board, A/D and the D/A share a common on-board pixel clock, whose rate is controlled by parameters uploaded by the PC-resident software.
While the general architecture is the same for both multiple-board solution and integrated interface, the latter has been designed to take advantage of both the shared resources and the flexibility provided by the FPGA (field programmable gate array) to customize the buffers and control circuitry to optimize the performance. The result has been a significant decrease in the overall system latency relative to the multiple-board solution, which in turn has improved the utility of the overall system.
There are two fundamental limitations in the dual board solution: the inherent latency and the limitation of the stimulus pattern size. We discuss each limitation.
Figure 3 and our earlier paper [35] illustrate the relationship of prediction latency to the accuracy of stimulus location. The latency is the combined delay imposed by computation and data transfer. While computation latency had been reduced to approximately 1.5 msec by use of the Map-Seeking Circuit (MSC) algorithm [36], inherent architectural limitations in the multiple-board solution added up to 4.0 msec of latency. Thus stimulus location predictions had to assume about 6 msec overall latency with the consequent decrease in accuracy that comes with a motion process that has stochastic properties [27]. Quantitative analysis illustrated in Fig. 3 indicates the benefit of a reduction of system latency to 2 msec. The 2 msec latency goal was assumed to be achievable based on the 1.3 – 1.5 msec computation time.
The 6 millisecond latency of the multiple-board solution arose from three components:
-
A.
The A/D board’s device driver does not support interrupt rates higher than 1000Hz, hence raw AOSLO video has to be buffered at 1 msec intervals. Combined with features of the optical instrument, this corresponds to image strips comprising 16 lines of the frame. Due to these interrupt handling rate limitations, the A/D board presents a 0-1 millisecond random sampling latency, because the boundary of the critical patch can appear at any line of the 16-line patch [35]. The term “critical patch” was defined in paper [35], and it will be reviewed briefly here. The image information in the critical patch is used to calculate the current retinal location and also to predict where the target location will be (ie the location where the stimulus is to be placed). In Fig. 5 , without sampling latency, we suppose that a latency of time T is sufficient to, i) calculate the target location A (indicated by the white circle), and ii) write the stimulus to the target. Ideally, the critical patch would be the patch indicated by the solid rectangle, ending exactly at time T prior to the target. However, due to sampling issues stated above, the image grabber sends out data to PC only once in every millisecond in blocks [l, l + 15], [l + 16, l + 31], [l + 32, l + 47]. Therefore, in Fig. 5, we need to move the critical patch to an earlier timepoint l + 16, or the position of the dashed rectangle, which introduces an additional Ts sampling latency that ranges from 0 to 15 sampling lines or 0-0.94 msec. We can’t move the critical patch down to line l + 32, because the software does not start calculating the stimulus location until line l + 32 is buffered from the image grabber, leaving insufficient time to compute and write the stimulus to the target.
Fig. 5.
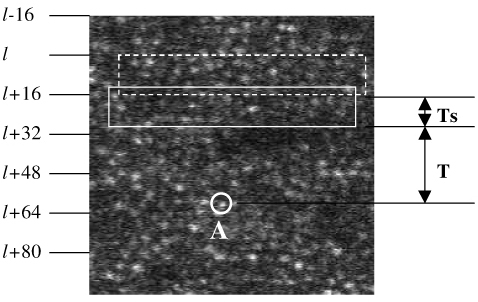
Illustration of critical patch. The letter ‘A’ in the figure labels the target location
-
B.
The MSC software algorithm [35] needs 1.3~1.5 milliseconds to calculate the target location (assuming Intel Core 2 Duo or Core 2 Quad processor).
-
C.
The writing latency to the D/A board is variable, depending on buffer position, by up to 3.0 msec, because the D/A data clock can't synchronize with the A/D data clock at the pixel level. The D/A board has a minimum requirement on the number of buffers to be defined for running them continuously which is 3 buffers (~3 msec in total), and this introduces an inherent delay of anywhere between 1 msec to 3 msec, based upon which buffer the D/A board is processing at a given time.
The total latency from A through C is 2.3~5.5 msec for delivering a stimulus to the target. To guarantee that the stimulus can be delivered to the same frame every time (instead of the next frame), we had to always assume the worst case of about 6 milliseconds. From these considerations the design goal for the integrated interface adaptor was therefore to minimize latency A, eliminate latency C, and hence reduce the total prediction time to about 2 milliseconds.
The second limitation imposed by the multiple-board solution was that the stimulus pattern raster had to be less than or equal to 16 pixels tall. This was because the stimulus was represented by 16-pixel high strip buffers in the D/A board and we were unable to represent a stimulus that straddled more than 2 strips. Because the A/D board and the D/A boards use independent pixel clocks, increasing the stimulus size will span the stimulus over more than one stripe at any given time when the eye motion is towards the top of the frame and this will show the stimulus being chopped off at the top. While this was adequate for single cone-targeted stimulus delivery [34], because a cone spans about 7-10 pixels, the tiny stimulus precluded AOSLO’s use in psychophysics experiments where the subject is often required to view a larger target.
3. The integrated adaptor solution
The combined limitations of latency and stimulus size motivated us to design an alternative solution. We used a single FPGA board integrated with A/D and D/A to replace the multiple-board solution. The flexibility of the FPGA allowed us to incorporate buffers and, more importantly, control circuitry optimally designed to dynamically adjust the buffering of data between the AOSLO optical system and the PC to minimize the latency as the scan approaches the estimated location of the stimulus pattern. This dynamic buffering strategy will be described in more detail below. The architecture of the integrated solution is illustrated in Fig. 6 . Comparing with the dual-board solution in Fig. 2, we see that the interfaces between the instrument and the computational system are still the same. The computational system receives H-sync, V-sync and analog raw video from the instrument, and sends two analog signals to control the two AOMs in the instrument. Moreover, most of the PC software is also the same, including most of the GUI and algorithms. Between those interfaces the hardware component of the interface had to be designed and implemented and new device driver software resident on the PC to support the integrated function needed to be implemented. A more detailed block diagram of the FPGA applications is illustrated in Appendix 1, where the block RAM map of “video buffers” is illustrated in Appendix-2 and block RAM map of “stimulus buffers” is illustrated in Appendix-3.
Fig. 6.
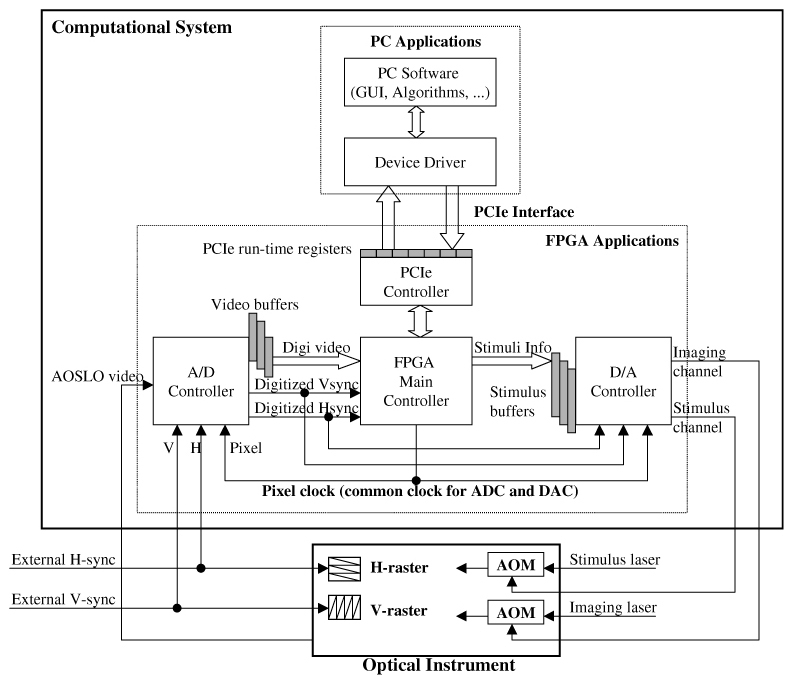
Architecture of the FPGA integrated solution. A/D and D/A share the same pixel clock which is generated by FPGA, allowing the stimulus location to be accurately registered to the raw video input. The programmability of the FPGA also allows dynamic control of video buffering to minimize prediction latency as the scan approaches the estimated stimulus location.
The flexibility provided by the FPGA allowed us to customize the logic to achieve several design goals.
-
(1)
Reduce sampling units to a single scan line level. We were willing to accept the time necessary to display a single raster line (33msec/frame / 512 lines/frame = 65 usec) as the basic latency unit. This latency is trivial compared to the 1.3-1.5 milliseconds of the algorithm’s computational latency. However, we could not buffer raw video to the host PC line by line, because this increased the burden of the PC interrupt handler to process about 512 (lines/frame) x 30 (frames/second) = 15360 interrupts per second. Our testing showed that although our device driver had the ability to handle hardware interrupts at this high rate, it would consume most of the CPU time and leave very limited CPU space for running the algorithm. On the other hand, we were constrained by the need to provide the prediction algorithm data early enough to calculate the target location. Therefore, we chose to transfer the raw video from the interface buffer to the PC every 16 lines most of the time - the same as had been used in the multiple-board solution. However, when the scan neared the initial estimated location of the target, the unit of buffering was switched dynamically to collect a critical patch whose last line coincided with the desired latency time. The logic to implement this adaptive buffering is made possible by the programmability of the FPGA. Figure 7 illustrates the dynamic buffering strategy.
Fig. 7.
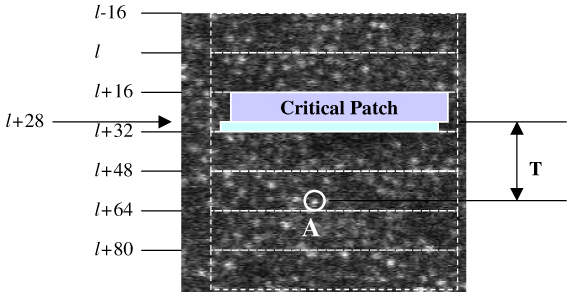
An example of adjusting the buffering unit to the critical patch. ‘A’ is the target location.
In Fig. 7, the raw video is still buffered to the PC in every 16 lines, when there is no critical patch involved, e.g., [l-16, l-1] and [l, l + 15]. However, when the critical patch happens to have the last line at line l + 28, the FPGA will be programmed to buffer lines [l + 16, l + 28] to the PC immediately after line l + 28 is sampled by the A/D converter. Therefore, there is no need to move the critical patch back to lines [l, l + 15], as was the case for the multiple-board option (Fig. 5). The PC algorithm starts calculating the target location as soon as the PC receives lines [l + 16, l + 28] and this trims the prediction time to T exactly, instead of T + Ts. The sampling latency is therefore basically eliminated. This approach does add one more interrupt handling event in each frame, from the previous 32 interrupts to 33 interrupts, because the FPGA needs to buffer lines [l + 29, l + 31] to the PC separately. The total CPU usage for video sampling only on an Intel Core 2 Quad (Q6700 @ 2.66GHz) CPU is less than 5%.
-
(2)
The second design objective was a common pixel clock for the D/A and A/D to eliminate misalignment of the input image and the target pattern due to PLL skews. This was simple to achieve since the same clock signal from the FPGA could be routed to both converter chips.
-
(3)
The third design goal was to provide the buffering and control to allow the stimulus pattern to be preloaded into the FPGA buffer, and to be sequenced to the stimulus output channel with the correct timing to present it to the desired location in the raster under control of the PC software by merely uploading stimulus location coordinates for each frame. This represented a significant improvement over the multiple-board solution which required uploading all the pixels in the stimulus pattern raster for each frame to adjust the location of the stimulus. The encoding of stimulus pattern is simple if the stimulus size is 16x16 pixels or smaller, because there is only one pair of (x, y) coordinates to determine its location. It gets complicated with larger stimulus patterns. Large stimuli involve longer delivery times, during which eye motion can induce non-linear distortions that must be compensated as they occur. Hence, the algorithm needs to calculate a sequence of (x, y) coordinates for sequential patches of the stimulus pattern. For example, with a 180x180 pixel stimulus pattern, we calculate coordinates at lines 0, 32, 64, 96, 128, 160, 176. We then use these seven pairs of (x, y) to pre-warp the stimulus pattern and encode it to the two AOMs. We assume there is no intraline distortion because of the short duration of the horizontal sweep.
4. Results
We present five examples of stimulus delivery with 3-msec, 4-msec, 5-msec, 6-msec prediction times (latency) and 1 frame delay (33 msec), from a living retina. Figure 8 illustrates two live videos with prediction times 3 msec and 4 msec, and Fig. 9 illustrates another three live videos with prediction times 5 msec, 6 msec and a whole frame (33 msec). In all of the following examples, the stimulus is generated by modulating the imaging laser. As such, the stimulus gets encoded directly into the image. Switching the same modulation pattern to a second laser is trivial. Under typical operating conditions, the power of the second laser is generally not sufficient to be recorded into the image and so this simpler mode of operation is the most appropriate for illustration purposes.
Fig. 8.
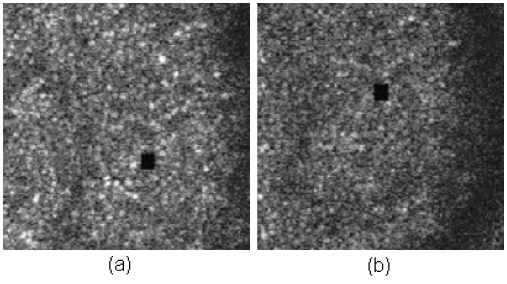
Stimulus accuracy with different prediction times. (a) is with 3-msec latency, and (b) is with 4-msec latency ( Media 1 (996KB, MPG) ). The accompanying movies have been compressed to reduce file size and underrepresent the quality of the original AOSLO video.
Fig. 9.
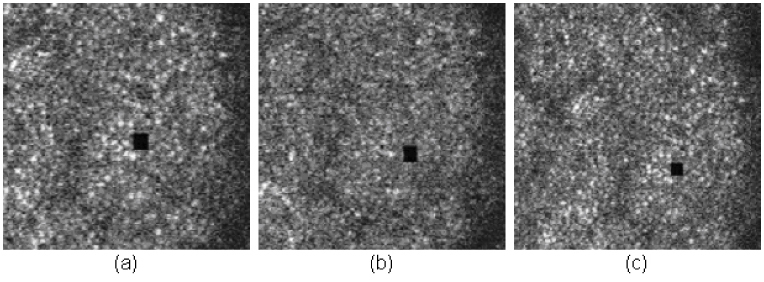
Stimulus accuracy with different prediction times. (a) is with 5-msec latency, (b) is with 6-msec latency, and (c) is with one frame (33 msec) latency ( Media 2 (1.3MB, MPG) ). The accompanying movies have been compressed to reduce file size and underrepresent the quality of the original AOSLO video.
The RMS accuracy of the stimulus location is plotted in Fig. 10 . It is worth noting that the results below are calculated from only one sample (600 frames of video) in each case.
Fig. 10.
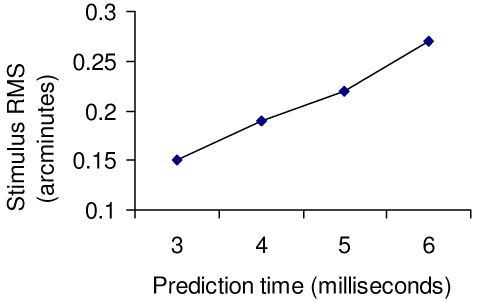
RMS error of stimulus location versus prediction latency
We calculate the RMS error from the recorded raw video with standard cross correlation which is totally independent of the MSC algorithm, illustrated in Fig. 11 below.
Fig. 11.
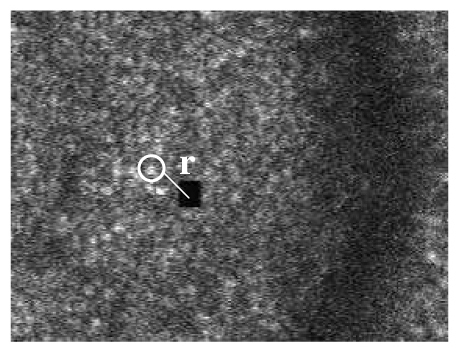
Evaluation of stimulus accuracy
In Fig. 11, we use cross correlation to locate the stimulus (the black square) and a neighboring patch of cones, and measure how the distance r between them varies frame by frame. When the patch of cones is selected a) very close to the stimulus, and b) nearly in the same horizontal level as the stimulus, then the variation of r represents the accuracy of the stimulus placement. The size of the stimulus is 16x16 pixels, and the typical size of the cone is 9x9 pixels. A patch of 16x16 pixels is used to track the stimulus and a patch of 9X 9 pixels is used to track the cone.
With the benefit of high programmability of FPGAs, we can encode a large stimulus pattern to the D/A to control the two AOMs. Moreover, we can program the board to deliver animations to targeted retinal locations. Figure 12 shows an example where an animated letter “E” fades in at a targeted retinal location. The size of “E” spans multiple cones, and is large enough for the subject to resolve it. In the actual experiment, the stabilized “E” will fade from view, which is a common phenomena reported in the literature [37,38]. We can also deliver a gray-scaled image on the retina, as illustrated in Fig. 13 .
Fig. 12.
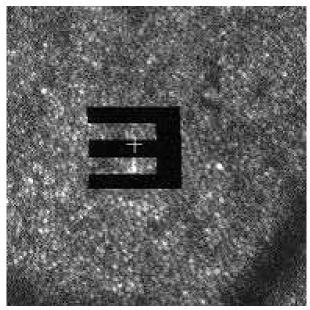
Stabilized stimulus (video) on retina ( Media 3 (916KB, MPG) )
Fig. 13.
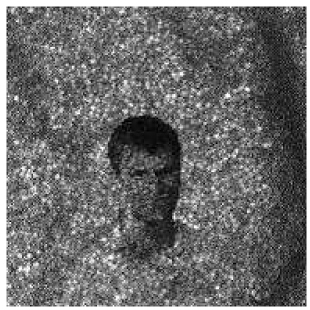
Gray-scale stimulus on retina ( Media 4 (916KB, MPG) )
5. Summary
-
1.
With the integrated adapter solution, we have reduced the prediction time to 3 msec for small stimulus sizes (e.g. 16x16 pixels). The 3 msec provides a small “pad” over the original budget of 2 msec to allow for possible motion between the pre-critical patch and the critical patch, and to allow for the radius of the stimulus pattern. This case halves the previous prediction time needed for the multiple-board solution, and results in a reduction of the stabilization error from 0.27 arcmin (also 0.26 arcmin reported in [35]) to 0.15 arcmin.
-
2.
The stimulus size can now be as large as the available buffer size on FPGA, which is currently 256x256 pixels, large enough to allow some motion within the 512 x 512 frame of the raw video. However, larger stimuli impose longer latencies, limited by the current speed of calculation of stimulus location and dewarping parameters. This may be mitigated by faster PC hardware or moving the computations to GPU hardware. The latter option is currently under investigation.
6. Discussion
To our knowledge, the tracking and stabilization is more accurate than any other method reported in the literature. Comparisons of the methods employed here vs other methods were described in the second paper of this series [35] and are summarized in Table 1 .
Table 1. Comparison of other tracking and targeted stimulus/beam delivery methods.
| Method | Tracking method | Tracking accuracy | Latency | Stabilization accuracy | Comments |
|---|---|---|---|---|---|
| AOSLO | Retinal image tracking | <0.1 arcmin | 3 msec | 0.15 arcmin | Gaze contingent stimulus projection. The stimulus is corrected with adaptive optics and can be as compact as a single cone. |
| Optical lever | Direct optical coupling | 0.05 arcmin [39] | 0 (optical) | 0.38 arcminutes [40] | Stimulus is very precise but contact lens slippage will cause uncontrollable and unmonitorable shifts in stimulus position |
| Dual Purkinje (dPi) Eye Tracker with optical deflector [41] | Purkinje reflexes from cornea and lens | ~1 arcminute [42] | 6 msec | ~1 arc minute (error is dominated by tracking accuracy) | |
| EyeRisTM* [43] | dPi** | ~1arcmin (dPi) | 5-10 msec | ~1 arcmin (tracking limited) [44] | Gaze contingent display. |
| MP1(Nidek, Japan) | Retinal image feature tracking | 4.9 arcmin [45] | 2.4 msec | Not reported | Gaze contingent display for single stimulus presentations (clinical visual threshhold measurements) |
| Physical Sciences Inc [46]. | Retinal feature tracking | 3 arcmin | <1 msec | 3 minutes (tracking limited) | Used to optically stabilize a scanning raster on the retina to facilitate line scanning ophthalmoscope imaging. |
| Heidelberg Spectralis OCT (Heidleberg, Germany) | Retinal image feature tracking | Not reported | Not reported | Not reported | Used to stabilize the OCT b-scan at a fixed retinal location to facilitate scan averaging. |
* This technique falls into a broad class of eye trackers coupled with gaze contingent displays. The EyeRIS system here has the best reported performance of any of the systems we found.
** Any tracking method can be used for this type of system but results from a dPi system are reported since they provide the best results.
Although the AOSLO has a performance advantage over other systems in many categories, there are important limits to the scope if its application. In general, all the systems with the exception of AOSLO are capable of measuring eye motions and controlling the stimulus or the display over a relatively large visual field. The following arguments explain why AOSLO tracking and stimulus presentation will only work for a limited range of eye motion. First, the method demands that the stimulus is placed within the confines of the scanning raster, which is typically between 1 X 1 and 2 X 2 degrees and never greater than 3 X 3 degrees. Second, tracking will begin to fail whenever the current frame starts to lose overlap with the reference frame by 50% or more. Third, the extent of the stimulus is limited by the FPGA buffer, whose current maximum limit is 256 X 256 pixels. With an AOSLO field size of 512 X 512 pixels, this further limits the range of eye motion for which an extended stimulus can be presented. As such, the tracking and stimulus delivery are practical mainly for an eye that is fixating.
7. Conclusion
The FPGA solution to eye tracking and targeted stimulus delivery presented here represents a significant improvement in performance and reduction in cost over the previous solutions that have been implemented. These improvements will not only enhance ongoing research, but the ability to present larger stimuli to targeted locations broadens the scope of potential applications, which range from targeted delivery of therapeutic lasers, presentation of large stimuli for receptive field measurements and basic psychophysics related to perception of stabilized and moving targets.
Appendix 1: A detailed block diagram of the FPGA applications
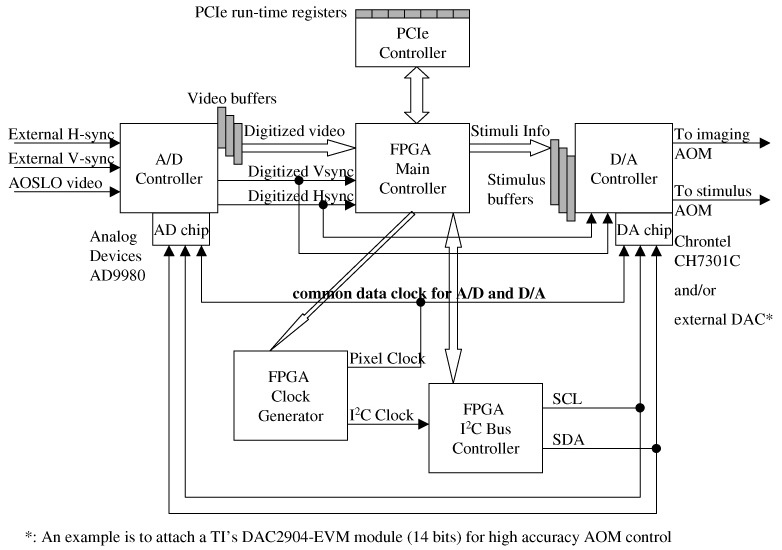
Appendix 2: FPGA block RAM map for video buffers of the D/A controller
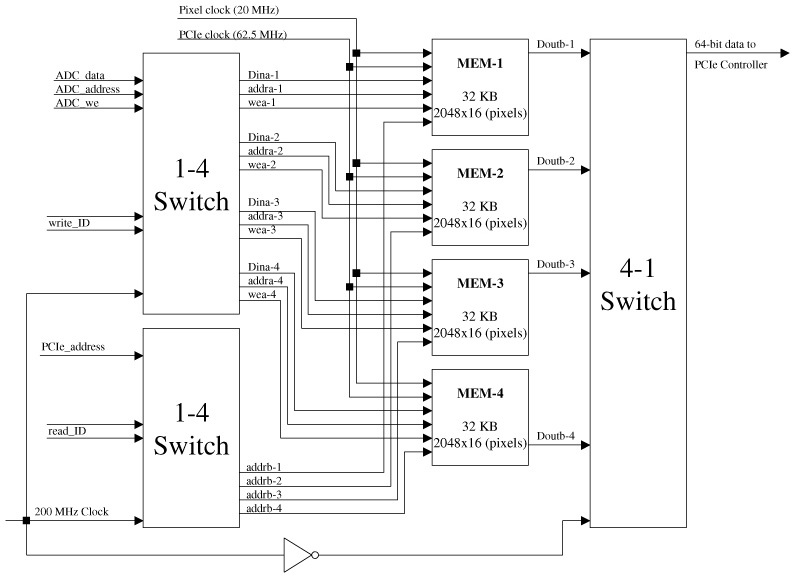
Appendix 3: FPGA block RAM map for stimulus buffer of the D/A controller
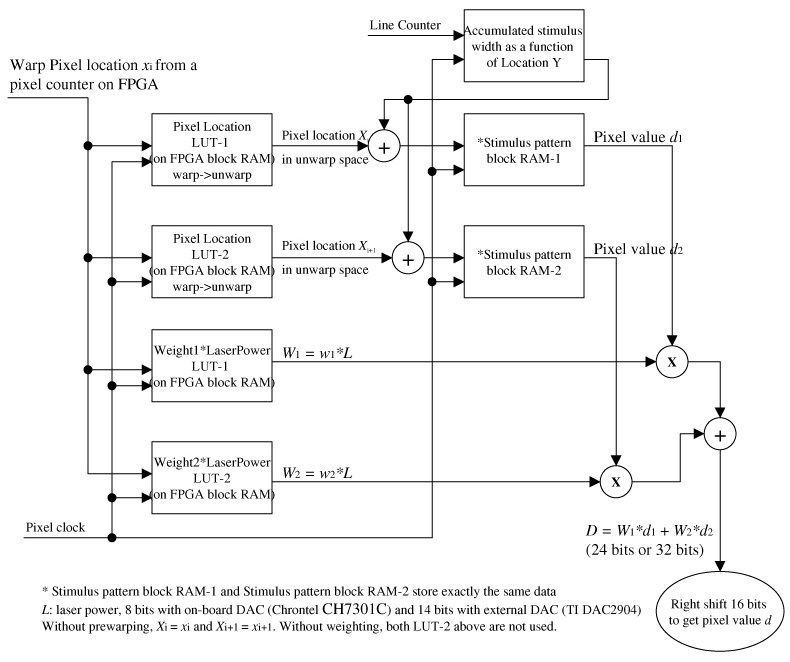
Acknowledgement
This work is funded by National Institutes of Health Bioengineering Research Partnership GrantEY014375 and by the National Science Foundation Science and Technology Center for Adaptive Optics, managed by the University of California at Santa Cruz under cooperative agreement AST-9876783.
References and links
- 1.Roorda A., Romero-Borja F., Donnelly Iii W., Queener H., Hebert T. J., Campbell M. C. W., “Adaptive optics scanning laser ophthalmoscopy,” Opt. Express 10(9), 405–412 (2002). [DOI] [PubMed] [Google Scholar]
- 2.R. K. Tyson, Principle of Adaptive Optics, 2 edition (San Diego: Academic Press, 1998). [Google Scholar]
- 3.Liang J., Williams D. R., Miller D. T., “Supernormal vision and high-resolution retinal imaging through adaptive optics,” J. Opt. Soc. Am. A 14(11), 2884–2892 (1997). 10.1364/JOSAA.14.002884 [DOI] [PubMed] [Google Scholar]
- 4.Grieve K., Tiruveedhula P., Zhang Y., Roorda A., “Multi-wavelength imaging with the adaptive optics scanning laser Ophthalmoscope,” Opt. Express 14(25), 12230–12242 (2006). 10.1364/OE.14.012230 [DOI] [PubMed] [Google Scholar]
- 5.Zhang Y., Poonja S., Roorda A., “MEMS-based adaptive optics scanning laser ophthalmoscopy,” Opt. Lett. 31(9), 1268–1270 (2006). 10.1364/OL.31.001268 [DOI] [PubMed] [Google Scholar]
- 6.Burns S. A., Tumbar R., Elsner A. E., Ferguson D., Hammer D. X., “Large-field-of-view, modular, stabilized, adaptive-optics-based scanning laser ophthalmoscope,” J. Opt. Soc. Am. A 24(5), 1313–1326 (2007). 10.1364/JOSAA.24.001313 [DOI] [PMC free article] [PubMed] [Google Scholar]
- 7.Gray D. C., Merigan W., Wolfing J. I., Gee B. P., Porter J., Dubra A., Twietmeyer T. H., Ahamd K., Tumbar R., Reinholz F., Williams D. R., “In vivo fluorescence imaging of primate retinal ganglion cells and retinal pigment epithelial cells,” Opt. Express 14(16), 7144–7158 (2006). 10.1364/OE.14.007144 [DOI] [PubMed] [Google Scholar]
- 8.Mujat M., Ferguson R. D., Iftimia N., Hammer D. X., “Compact adaptive optics line scanning ophthalmoscope,” Opt. Express 17(12), 10242–10258 (2009). 10.1364/OE.17.010242 [DOI] [PMC free article] [PubMed] [Google Scholar]
- 9.Zhang Y., Rha J., Jonnal R. S., Miller D. T., “Adaptive optics parallel spectral domain optical coherence tomography for imaging the living retina,” Opt. Express 13(12), 4792–4811 (2005). 10.1364/OPEX.13.004792 [DOI] [PubMed] [Google Scholar]
- 10.Hermann B., Fernández E. J., Unterhuber A., Sattmann H., Fercher A. F., Drexler W., Prieto P. M., Artal P., “Adaptive-optics ultrahigh-resolution optical coherence tomography,” Opt. Lett. 29(18), 2142–2144 (2004). 10.1364/OL.29.002142 [DOI] [PubMed] [Google Scholar]
- 11.Zawadzki R. J., Choi S. S., Jones S. M., Oliver S. S., Werner J. S., “Adaptive optics-optical coherence tomography: optimizing visualization of microscopic retinal structures in three dimensions,” J. Opt. Soc. Am. A 24(5), 1373–1383 (2007). 10.1364/JOSAA.24.001373 [DOI] [PMC free article] [PubMed] [Google Scholar]
- 12.Roorda A., Williams D. R., “The arrangement of the three cone classes in the living human eye,” Nature 397(6719), 520–522 (1999). 10.1038/17383 [DOI] [PubMed] [Google Scholar]
- 13.Chui T. Y., Song H., Burns S. A., “Individual variations in human cone photoreceptor packing density: variations with refractive error,” Invest. Ophthalmol. Vis. Sci. 49(10), 4679–4687 (2008). 10.1167/iovs.08-2135 [DOI] [PMC free article] [PubMed] [Google Scholar]
- 14.Carroll J., Neitz M., Hofer H., Neitz J., Williams D. R., “Functional photoreceptor loss revealed with adaptive optics: an alternate cause of color blindness,” Proc. Natl. Acad. Sci. U.S.A. 101(22), 8461–8466 (2004). 10.1073/pnas.0401440101 [DOI] [PMC free article] [PubMed] [Google Scholar]
- 15.Choi S. S., Doble N., Hardy J. L., Jones S. M., Keltner J. L., Olivier S. S., Werner J. S., “In vivo imaging of the photoreceptor mosaic in retinal dystrophies and correlations with visual function,” Invest. Ophthalmol. Vis. Sci. 47(5), 2080–2092 (2006). 10.1167/iovs.05-0997 [DOI] [PMC free article] [PubMed] [Google Scholar]
- 16.Duncan J. L., Zhang Y., Gandhi J., Nakanishi C., Othman M., Branham K. E., Swaroop A., Roorda A., “High-resolution imaging with adaptive optics in patients with inherited retinal degeneration,” Invest. Ophthalmol. Vis. Sci. 48(7), 3283–3291 (2007). 10.1167/iovs.06-1422 [DOI] [PubMed] [Google Scholar]
- 17.Yoon G. Y., Williams D. R., “Visual performance after correcting the monochromatic and chromatic aberrations of the eye,” J. Opt. Soc. Am. A 19(2), 266–275 (2002). 10.1364/JOSAA.19.000266 [DOI] [PubMed] [Google Scholar]
- 18.Makous W., Carroll J., Wolfing J. I., Lin J., Christie N., Williams D. R., “Retinal microscotomas revealed with adaptive-optics microflashes,” Invest. Ophthalmol. Vis. Sci. 47(9), 4160–4167 (2006). 10.1167/iovs.05-1195 [DOI] [PubMed] [Google Scholar]
- 19.Artal P., Chen L., Fernández E. J., Singer B., Manzanera S., Williams D. R., “Neural compensation for the eye’s optical aberrations,” J. Vis. 4(4), 281–287 (2004). 10.1167/4.4.4 [DOI] [PubMed] [Google Scholar]
- 20.Hofer H., Singer B., Williams D. R., “Different sensations from cones with the same photopigment,” J. Vis. 5(5), 444–454 (2005). 10.1167/5.5.5 [DOI] [PubMed] [Google Scholar]
- 21.Rocha K. M., Vabre L., Chateau N., Krueger R. R., “Enhanced visual acuity and image perception following correction of highly aberrated eyes using an adaptive optics visual simulator,” J. Refract. Surg. 26(1), 52–56 (2010). 10.3928/1081597X-20101215-08 [DOI] [PubMed] [Google Scholar]
- 22.Webb R. H., Hughes G. W., Pomerantzeff O., “Flying spot TV ophthalmoscope,” Appl. Opt. 19(17), 2991–2997 (1980). 10.1364/AO.19.002991 [DOI] [PubMed] [Google Scholar]
- 23.Mainster M. A., Timberlake G. T., Webb R. H., Hughes G. W., “Scanning laser ophthalmoscopy. Clinical applications,” Ophthalmology 89(7), 852–857 (1982). [DOI] [PubMed] [Google Scholar]
- 24.Timberlake G. T., Mainster M. A., Webb R. H., Hughes G. W., Trempe C. L., “Retinal localization of scotomata by scanning laser ophthalmoscopy,” Invest. Ophthalmol. Vis. Sci. 22(1), 91–97 (1982). [PubMed] [Google Scholar]
- 25.Poonja S., Patel S., Henry L., Roorda A., “Dynamic visual stimulus presentation in an adaptive optics scanning laser ophthalmoscope,” J. Refract. Surg. 21(5), S575–S580 (2005). [DOI] [PubMed] [Google Scholar]
- 26.Rossi E. A., Weiser P., Tarrant J., Roorda A., “Visual performance in emmetropia and low myopia after correction of high-order aberrations,” J. Vis. 7(8), 1–14 (2007). 10.1167/7.8.14 [DOI] [PubMed] [Google Scholar]
- 27.Martinez-Conde S., Macknik S. L., Hubel D. H., “The role of fixational eye movements in visual perception,” Nat. Rev. Neurosci. 5(3), 229–240 (2004). 10.1038/nrn1348 [DOI] [PubMed] [Google Scholar]
- 28.S. B. Stevenson, A., Roorda, and G. Kumar, “Eye tracking with the adaptive optics scanning laser ophthalmoscope.” in Proceedings of the 2010 Symposium on Eye-Tracking Research & Applications (Association for Computed Machinery, New York, NY, 2010) pp. 195–198. [Google Scholar]
- 29.Vogel C. R., Arathorn D. W., Roorda A., Parker A., “Retinal motion estimation and image dewarping in adaptive optics scanning laser ophthalmoscopy,” Opt. Express 14(2), 487–497 (2006). 10.1364/OPEX.14.000487 [DOI] [PubMed] [Google Scholar]
- 30.S. B. Stevenson, and A. Roorda, “Correcting for miniature eye movements in high resolution scanning laser ophthalmoscopy” in Ophthalmic Technologies XI, F. Manns, P. Soderberg, and A. Ho, eds. (SPIE, Bellingham, WA 2005). [Google Scholar]
- 31.Stetter M., Sendtner R. A., Timberlake G. T., “A novel method for measuring saccade profiles using the scanning laser ophthalmoscope,” Vision Res. 36(13), 1987–1994 (1996). 10.1016/0042-6989(95)00276-6 [DOI] [PubMed] [Google Scholar]
- 32.Ott D., Daunicht W. J., “Eye movement measurement with the scanning laser ophthalmoscope,” Clin. Vis. Sci. 7, 551–556 (1992). [Google Scholar]
- 33.J. B. Mulligan, “Recovery of motion parameters from distortions in scanned images,” in Proceedings of the NASA Image Registration Workshop (IRW97) (NASA Goddard Space Flight Center, MD, 1997). [Google Scholar]
- 34.Sincich L. C., Zhang Y., Tiruveedhula P., Horton J. C., Roorda A., “Resolving single cone inputs to visual receptive fields,” Nat. Neurosci. 12(8), 967–969 (2009). 10.1038/nn.2352 [DOI] [PMC free article] [PubMed] [Google Scholar]
- 35.Arathorn D. W., Yang Q., Vogel C. R., Zhang Y., Tiruveedhula P., Roorda A., “Retinally stabilized cone-targeted stimulus delivery,” Opt. Express 15(21), 13731–13744 (2007). 10.1364/OE.15.013731 [DOI] [PubMed] [Google Scholar]
- 36.D. W. Arathorn, Map-Seeking Circuits in Visual Cognition (Stanford University Press, Stanford 2002). [Google Scholar]
- 37.Ditchburn R. W., Ginsborg B. L., “Vision with a stabilized retinal image,” Nature 170(4314), 36–37 (1952). 10.1038/170036a0 [DOI] [PubMed] [Google Scholar]
- 38.Riggs L. A., Ratliff F., Cornsweet J. C., Cornsweet T. N., “The disappearance of steadily fixated visual test objects,” J. Opt. Soc. Am. 43(6), 495–501 (1953). 10.1364/JOSA.43.000495 [DOI] [PubMed] [Google Scholar]
- 39.Riggs L. A., Armington J. C., Ratliff F., “Motions of the retinal image during fixation,” J. Opt. Soc. Am. 44(4), 315–321 (1954). 10.1364/JOSA.44.000315 [DOI] [PubMed] [Google Scholar]
- 40.Riggs L. A., Schick A. M., “Accuracy of retinal image stabilization achieved with a plane mirror on a tightly fitting contact lens,” Vision Res. 8(2), 159–169 (1968). 10.1016/0042-6989(68)90004-7 [DOI] [PubMed] [Google Scholar]
- 41.Cornsweet T. N., Crane H. D., “Accurate two-dimensional eye tracker using first and fourth Purkinje images,” J. Opt. Soc. Am. 63(8), 921–928 (1973). 10.1364/JOSA.63.000921 [DOI] [PubMed] [Google Scholar]
- 42.Crane H. D., Steele C. M., “Generation-V dual-Purkinje-image eyetracker,” Appl. Opt. 24(4), 527–537 (1985). 10.1364/AO.24.000527 [DOI] [PubMed] [Google Scholar]
- 43.Santini F., Redner G., Iovin R., Rucci M., “EyeRIS: a general-purpose system for eye-movement-contingent display control,” Behav. Res. Methods 39(3), 350–364 (2007). 10.3758/BF03193003 [DOI] [PubMed] [Google Scholar]
- 44.Rucci M., Iovin R., Poletti M., Santini F., “Miniature eye movements enhance fine spatial detail,” Nature 447(7146), 852–854 (2007). 10.1038/nature05866 [DOI] [PubMed] [Google Scholar]
- 45.E. Midena, “Liquid Crystal Display Microperimetry” in Perimetry and the Fundus: In Introduction to Microperimetry, E. Midena, ed. (Slack Inc., Thorofare, NJ 2007) pp. 15–26. [Google Scholar]
- 46.Hammer D. X., Ferguson R. D., Bigelow C. E., Iftimia N. V., Ustun T. E., Burns S. A., “Adaptive optics scanning laser ophthalmoscope for stabilized retinal imaging,” Opt. Express 14(8), 3354–3367 (2006). 10.1364/OE.14.003354 [DOI] [PMC free article] [PubMed] [Google Scholar]


