

Abstract
In E. coli, ZitB and ZntA are important metal exporters that enhance cell viability under high environmental zinc. To understand their functions in maintaining zinc homeostasis, we applied a novel genetically-encoded fluorescent zinc sensor to monitor the intracellular free zinc changes in wild type, ΔzitB and ΔzntA E. coli cells upon sudden exposure to toxic levels of zinc (“zinc shock”). The intracellular readily exchangeable zinc concentration (or “free” zinc) increases transiently from picomolar to nanomolar levels, accelerating zinc-activated gene transcription. After zinc shock, the zitB mRNA level is constant while the zntA mRNA increases substantially in a zinc-dependent manner. In the ΔzitB E. coli strain the free zinc concentration rises more rapidly after zinc shock compared to wild-type cells while a prolonged accumulation of free zinc is observed in the ΔzntA strain. Based on these results, we propose that ZitB functions as a constitutive, first-line defense against toxic zinc influx, while ZntA is up-regulated to efficiently lower the free zinc concentration. Furthermore, the ZntR-mediated transcription of zntA exhibits an apparent K1/2 for zinc activation in the nanomolar range in vivo, significantly higher than the femtomolar affinity for zinc binding and transcription activation previously measured in vitro. A kinetically-controlled transcription model is sufficient to explain the observed regulation of intracellular free zinc concentration by ZntR and ZntA after zinc shock.
Keywords: intracellular free zinc, zinc sensor, zntA, zitB, zntR, transcriptional response
1. INTRODUCTION
Zinc is an essential element in living organisms, playing important catalytic, structural and regulatory roles in cells. More than 300 metalloenzymes require zinc as catalytic cofactors or structural elements [1-3]. Zinc also functions in mediating interactions among proteins, nucleic acids and small molecules through various metal-coordinated motifs [2, 4]. However, zinc can be toxic to cells at high concentrations due to inhibition of key enzymes, competition with other metal cation binding sites, and deprivation of essential copper [5, 6]. Therefore, cells need to achieve a delicate balance between ensuring sufficient concentration of zinc to fulfill the essential biological functions while limiting the concentration to prevent toxic effects. In E. coli, zinc homeostasis is regulated primarily through a network of zinc influx and efflux pumps [7, 8]. The influx systems include the constitutively expressed ZupT, a member of the ZRT/ IRT-like protein (ZIP) transporter family [9, 10], and the high affinity importer ZnuABC, an ATP-binding cassette (ABC) transporter complex that is up-regulated by the transcription factor Zur under zinc depletion conditions [11, 12]. The efflux systems include ZitB, a cation diffusion facilitator (CDF) [13, 14], and ZntA, a P-type ATPase transporter that is up-regulated by the transcription factor ZntR at high zinc concentrations [15, 16]. Many other transporters have also been proposed to facilitate translocation of zinc ions under various conditions, including low specificity iron transporters, inorganic phosphate transporters, and multidrug efflux systems [8, 17-20].
The redundancy of this zinc regulation network raises the question of what are the distinctive functions of each component under specified conditions. In the case of ZitB and ZntA, biochemical and genetic studies have previously provided insight into their roles in zinc detoxification. ZntA consumes ATP to catalyzed zinc export while ZitB transport is driven by the transmembrane proton gradient [21]. Genetic studies have shown that ZntA is critical for the survival of E. coli in the presence if high environmental zinc, as knock-out of the zntA gene results in accumulation of high concentrations of total Zn(II) in the cell and renders the cells hypersensitive to zinc stress [16]. In contrast, the ΔzitB deletion strain has a doubling time for growth that is similar to the wild type strain in culture medium with high zinc concentrations, possibly due to adaptation by overexpression of ZntA; the ΔzitBΔzntA strain shows a slight growth disadvantage at high zinc compared to the ΔzntA strain [14]. These data led to the proposal that ZitB maintains zinc homeostasis under normal growth conditions, i.e. low environmental zinc stress, while ZntA is the primary transporter to combat high extracellular zinc concentrations. However, the in vitro biochemical studies are not easily rationalized by this model. ZntA has an apparent in vitro Km for zinc transport of 9 μM zinc, while the apparent Km for zinc transport by ZitB was measured at 1.4 μM and 105 μM using everted E. coli membrane with over-expressed ZitB and reconstituted ZitB proteoliposomes, respectively [16, 21, 22]. These values are also orders of magnitude higher than the proposed free zinc concentrations in the cell, which range from fM to nM [23, 24], leading to the suggestion that putative metallochaperones might function with the transporters to enhance their in vivo affinity and ability to export zinc.
The transcriptional response of ZitB and ZntA under zinc stress poses additional questions. The transcription of ZitB was reported to be induced at 50 - 100 μM extracellular zinc in minimal salt medium using a φ(zitB-lacZ) operon fusion on the bacterial chromosome [22]. In E. coli the transcription of zntA is regulated by ZntR, a MerR-like transcription factor that is activated by zinc [15]. ZntR forms a dimer that binds 1 to 2 zinc ions per monomer, depending on the reducing potential [15]. The apo-ZntR dimer binds to the promoter of the zntA gene and weakly represses transcription; zinc-bound ZntR is a transcriptional activator that induces DNA unwinding to enhance RNA polymerase binding to the −35 and −10 positions of the promoter and initiate transcription [15]. In addition, formation of the Zn-ZntR-DNA complex also reduces degradation of ZntR catalyzed by E. coli proteases [25]. In vitro measurements indicate that ZntR has an apparent femtomolar affinity for zinc and zinc-dependent activation of transcription in TPEN-chelated zinc buffers [23, 26]. Two distinct models of zinc homeostasis were proposed in light of this extreme affinity. One proposal is that there are essentially no free zinc ions in the cell and zinc is trafficked within the cell bound to putative metallochaperones, as in the case of copper [27, 28]. This model assumes that ZntR equilibrates with the intracellular zinc concentration, which is unlikely to occur rapidly at the low cellular concentrations. An alternative proposal for zinc regulation, suggested by David Eide, depicts a scenario in which the cell undergoes cycles of intracellular zinc depletion and repletion [29]. Excess intracellular zinc activates transcription factors that induce the production of exporters to lower cellular zinc while metal import is activated when the efflux leads to a cellular zinc deficiency. This model provides an attractive explanation for zinc regulation through high affinity transcription factors, however, experimental evidence in bacterial cells is lacking.
To advance the understanding of bacterial metal regulation, we have developed a series of genetically-encoded fluorescent ratiometric zinc sensors with carbonic anhydrase (CA) as the scaffold to measure intracellular free zinc concentrations in E. coli [24]. Carbonic anhydrase binds zinc with high selectivity and tunable affinity through mutagenesis [30]. An aryl sulfonamide inhibitor, dapoxyl sulfonamide (DPS), selectively binds to the active site zinc ion and exhibits a >100-fold increase in quantum yield. A red fluorescent protein, TagRFP [31], fused to the C-terminus of CA functions as a FRET acceptor to the CA-bound DPS (Fig. 1). The FRET signal is then normalized to the acceptor fluorescence and the free zinc concentration is quantified based on in situ calibrations. Variation of the zinc affinity and cellular concentration of the sensors demonstrated that the CA_RFP sensors do not disturb intracellular zinc homeostasis. Using these ratiometric fluorescent sensors, we demonstrated that the median intracellular free zinc concentration in E. coli strain BL21(DE3) grown in MOPS minimal medium is ~ 20 pM [24]. Furthermore, using a fast equilibrating sensor (H94N CA_TagRFP), a transient increase in intracellular free zinc was observed after sudden exposure to high environmental zinc (“zinc shock”). These sensors are useful tools for monitoring changes in the intracellular readily exchangeable zinc concentrations under various conditions to analyze the regulatory mechanisms of E. coli zinc homeostasis.
Fig. 1. Carbonic anhydrase-based ratiometric zinc sensors.

Selective binding of dapoxyl sulfonamide (DPS) to the active site of zinc-bound CA leads to a dramatic increase in quantum yield of this fluorophore. TagRFP fused to CA serves as a FRET acceptor to CA-bound DPS as well as an internal reference. The fluorescence intensity ratio IFRET/IFP represents the zinc-bound fraction of the sensor and is calibrated in E. coli cells equilibrated with a series of Zn-NTA buffers.
In this work, we quantify the intracellular free zinc changes after zinc shock in both wild type E. coli and the zinc exporter knock-out strains ΔzitB and ΔzntA. The changes of intracellular free zinc concentrations in these strains differ in both timing and magnitude, highlighting the temporal coordination of in vivo regulatory mechanisms and suggesting that ZitB functions as a constitutive, first-line defense while ZntA is up-regulated for sustainable zinc detoxification. Furthermore, time-dependent changes in transcription of zitB and zntA after zinc shock reveal that the ZntR transcription factor up-regulates zntA transcription in response to nanomolar concentrations of free zinc, significantly higher than the previously measured in vitro activation by femtomolar zinc [23]. These results are consistent with a simple kinetic model where the ZntR transcription factor is activated by fluctuations in the intracellular free zinc concentration.
2. EXPERIMENTAL
2.1 E. coli Strains and Growth Conditions
E. coli strains from the Keio Knockout Collection were obtained from the E. coli Genetic Stock Center of Yale University [32]. The parent strain of this single knock-out collection, BW25113 {F-, Δ(araD-araB)567, ΔlacZ4787(::rrnB-3), & lambda−, rph-1, Δ(rhaD-rhaB)568, hsdR514} was derived from E. coli K-12, and considered “wild type” in this work. ΔzntA (JW3434-1), ΔzitB (JW0735-1) and ΔzntR (JW3254-5) strains were constructed from BW25113 by replacing the target gene with a kanamycin insert [32]. E. coli cells were cultured in MOPS minimal medium supplemented with thiamine (1 μg/ml) and uracil (20 μg/ml) [33]. The doubling time (TG) for growth of these cells was determined by a fit of Equation (1) to the growth curves (OD600 versus time).
| Eq. (1) |
2.2 Measurements of Intracellular Total Zinc
E. coli cells with the plasmid pTH_H94N_CA_TagRFP (see 2.3 for plasmid construction) were diluted 1:50 from an overnight culture into MOPS medium without antibiotics and grown at 25°C to OD600 ~ 0.3 and then a final concentration of 50 μM ZnSO4 was added to the flask. An aliquot (1 ml) of the cell culture was centrifuged (13,500 rpm, 1 min) at various time points. The pellets were washed twice with 500 μl ice-cold MOPS medium without additional zinc and once with 1 ml ice-cold ddH2O. The pellets were then dissolved in 200 μl of 35% ultra pure nitric acid (VMR), and incubated at 37°C overnight. The total metal content in these samples was measured by inductively coupled plasma mass spectrometry (ICP-MS), and the total zinc concentration per cell was calculated through dividing the total metal content by the total cell volume. The total cell volume was derived by multiplying the estimated average cell volume of 0.5 × 10⁻¹⁸ m3 with the total number of cells as measured by OD600. The number of cells per OD600 (~ 1.3 × 10⁹) was calibrated by plating the cells and counting the colonies. The volume per cell of 0.5 × 10⁻¹⁸ m3 was derived from the average dimensions of a E. coli cell of 2 μm length and 0.5 μm diameter (both strains have similar cell dimensions as observed by microscopy).
2.3 Measurement of Intracellular Free Zinc
Intracellular free zinc concentration was measured using carbonic anhydrase-based zinc sensors, as described previously with the following slight modifications [24]. The sensor expression vectors pTH_CA_TagRFP and pTH_H94N_CA_TagRFP were constructed by inserting the DNA sequence of wild type CA_TagRFP or H94N CA_TagRFP fusion genes between the restriction sites NcoI and KpnI after the trc-lac promoter on the vector pTrcHisa (Invitrogen). E. coli cells chemically transformed with one of these expression vectors were grown in MOPS minimal medium with 100 μg/ml ampicillin to OD600 ~ 0.3 at 30°C then induced by addition of 1 mM isopropyl β-D-1-thiogalactopyranoside (IPTG). The induced cultures were incubated at 30°C overnight allowing expression and maturation of the sensor. The culture was then diluted 1:20 into fresh MOPS medium without antibiotics and incubated at 30°C allowing the cells to recover and grow to log-phase. At OD600 ~ 0.3, samples (2 μl) of the culture were placed on a poly-L-lysine-coated 96-well glass bottom plate (Matrical) and incubated with 100 μl 2 μM dapoxyl sulfonamide (DPS) [34] in MOPS medium for 20 min at room temperature. Then excess DPS was removed and 100 μl MOPS medium was added. Before imaging, 11 μl of various 10× ZnSO4 stock solutions were added to the imaging medium to make the final total zinc concentrations at 10 μM, 50 μM and 100 μM for zinc shock experiments. Each culture sample was repeated in 5 separate wells, and a maximum of 2 images was taken from each well to limit photobleaching. Images were acquired at room temperature on a Nikon TE2000U inverted fluorescence microscope from two channels: FRET channel (Ex 350 nm/Em 620 nm, exposure time 500 ms) and FP channel (Ex 530 nm/Em 620 nm, exposure time 200 ms). The average IFRET/IFP ratio was compared to the in situ calibration curve of the sensor to calculate the intracellular free zinc concentration. In situ calibrations of the sensors were carried out by incubating the cells with NTA-chelated zinc buffers plus digitonin and DPS as described previously [24].
2.4 mRNA Preparation
E. coli cells with the plasmid pTH_H94N_CA_TagRFP were grown to OD600 ~ 0.3 in MOPS medium without antibiotics at 37°C, cooled for ~ 20 min to room temperature (~ 25°C), and then various concentrations of ZnSO4 (0, 10, 50, and 100 μM) were added. A 0.5 ml sample of the cell culture was collected at various times, and diluted into 1 ml of RNeasy Bacteria Protect (Qiagen) solution. The mixture was vortexed for 5 s, incubated at room temperature for 5 min, and centrifuged for 10 min at 8,000 rpm. The cell pellets were flash frozen in a dry ice-ethanol bath, and then stored at - 80°C. Total mRNA was extracted from the cell pellets using the RNeasy Mini Kit (Qiagen) according to the manufacturer’s instructions. On-column DNase I treatment was conducted to eliminate the residual DNA during the extraction. The purified total RNA was then re-incubated with DNase I for 30 min using the DNA-free DNase treatment and removal reagents (Ambion). Total mRNA concentration was measured using the NanoDrop spectrophotometer (Thermo Scientific) and an extinction coefficient of 27 (ng/ml)−1cm−1.
2.5 mRNA Quantification
mRNA transcripts of the zntA and zitB genes were quantified by RT-PCR. Template cDNA was synthesized using the SuperScript III Reverse Transcriptase Kit (Invitrogen) using total mRNA as the template and random hexamers as the primers. ~ 50 ng of the synthesized first strand cDNA was used as template in the 20 μl RT-PCR reaction. The PCR primers for the zntA, zitB and the housekeeping gene rrsD (16S ribosomal RNA of rrnD operon) were designed using the software Primer3. These primers clone a ~ 200 bp DNA sequence within each gene. The primer sequences are: rrsD-5′ CTCAAAGGAGACTGCCAGTGATAA; rrsD-3′ ACGATTACTAGCGATTCCGACTTC; zntA-5′ AGTACGTAACGATGACGTGCTTG; zntA-3′ GTCACCGCTTTGACTTTATCTTCC; zitB-5′ AATTACTTGAAGGTGCACCGGTAT; and zitB-3′ ATCCATCAGGTAGTGTTGGATCTG. The RT-PCR experiments were set up in triplicate and conducted using the SYBR Green qPCR SuperMix (Invitrogen) on a Mastercycler® ep realplex real time PCR machine (Eppendorf).
3. RESULTS
3.1 Growth Rates of WT, ΔzntA and ΔzitB
To evaluate the functions of the zinc exporters ZntA and ZitB in zinc detoxification, we first measured the effects of high zinc on the growth rates of wild-type and zntA and zitB single knock-out strains (Fig. 2). Overnight cultures of three E. coli strains derived from K-12, BW25113 (wild type, WT), JW3434-1 (ΔzntA) and JW0735-1 (ΔzitB) were diluted into MOPS minimal medium with or without addition of 100 μM ZnSO4, and the optical density (OD600) was recorded at various time points. The doubling times, TG, were determined from a fit of Eq. (1) to these growth curves. The addition of 100 μM ZnSO4 to cells grown in MOPS minimal medium had little effect on the doubling time for both WT (63 ± 2 min vs. 67 ± 2 min with Zn) and the ΔzitB (64 ± 3 min vs. 61 ± 3 min with Zn) strains, suggesting that critical zinc detoxification mechanisms are functional in these cells. However, addition of 100 μM extracellular zinc increases the doubling time for ΔzntA by almost 2-fold (71 ± 3 min vs. 122 ± 15 min with Zn), indicating a significant increase in sensitivity to zinc toxicity. Consistent with previous results [14, 16], these data demonstrate that the ZntA exporter plays a major role in cellular zinc detoxification.
Fig. 2. Growth curves of WT, ΔzntA and ΔzitB strains.

Overnight E. coli cultures were diluted into MOPS minimal medium with either 100 μM ZnSO4 or no zinc added. The optical density at 600 nm was measured as a function of time. The doubling times (TG) calculated from a fit of Eq. (1) to the growth curves are listed in the table on the right. The ΔzntA strain exhibits significant growth defects under high zinc, while the growth of the ΔzitB strain is similar to that of WT.
3.2 Accumulation of Total Zinc in ΔzntA
The detrimental effects of the zntA knock-out on E. coli growth in high zinc concentration are predicted to be related to a significantly elevated intracellular zinc level due to impaired export. To examine this we monitored the time-dependent intracellular changes in both total zinc and free zinc (next section) in E. coli after zinc shock. In MOPS minimal media the total zinc concentrations of both the WT and ΔzntA strains are estimated at ~ 200 μM (Fig. 3), comparable to previous measurements [23]. After zinc shock, the total zinc concentration increases to a peak of 800 μM in WT cells (at ~5 min) and 1300 μM in ΔzntA cells (at ~15 min). This temporary increase is followed by a decline in zinc concentration, potentially as a result of both up-regulation of zinc export and down-regulation of zinc import systems. After zinc shock, the total zinc concentration in the WT strain persists at a higher level after 1 hr (360 μM vs. 180 μM), consistent with the differences in metal content previously reported for cells grown in medium with variable zinc concentrations [35]. Significantly higher total zinc remains in the ΔzntA strain compared to the WT strain after 1 hr (600 μM vs. 360 μM), as previously reported [14]. Overall, the ΔzntA cells exhibit a more dramatic increase and a sustained higher level of intracellular total zinc compared to the WT strain. These factors likely contribute to the growth defect of the zntA knock-out strain in high zinc.
Fig. 3. Changes in total intracellular zinc after zinc shock.

50 μM ZnSO4 was added to the E. coli cell culture at log phase and samples were prepared in duplicate as described in the Experimental section. The total zinc in the cells from 1 ml of culture was measured by ICP-MS, and adjusted by the total cell volume, which was calculated by multiplying the number of cells by the average volume of an E. coli cell.
3.3 Intracellular Free Zinc in WT, ΔzntA and ΔzitB Cells
In cells, the majority of the total zinc is bound to a variety of ligands, including proteins, nucleic acids and small molecules. Therefore, the concentration of readily exchangeable (or “free” zinc), rather than total zinc, likely has the largest contribution to cell toxicity. Previously, we measured the intracellular free zinc concentration of E. coli BL21(DE3) cells grown in MOPS minimal medium at ~20 pM using a genetically-encoded fluorescent ratiometric zinc sensor (CA_TagRFP) [24]. Here we applied this sensor to measure the intracellular free zinc concentrations in WT, ΔzntA and ΔzitB strains, at 42 ± 15 pM, 50 ± 15 pM and 106 ± 27 pM, respectively (Fig. 4). These cells were grown in MOPS minimal medium with uracil supplement (total zinc concentration ~ 200 nM). The increased free zinc concentration in the wild-type BW25113 strain compared to BL21(DE3) likely reflect differences in the genetic background. Under these growth conditions with moderate environmental zinc exposure, the intracellular free zinc in the ΔzntA and wild-type strains are comparable while the ΔzitB strain has a modestly higher concentration of free zinc. Under these conditions the intracellular free zinc concentration does not correlate with the doubling time since the ΔzntA cells grow slightly more slowly than the WT and ΔzitB strains in MOPS medium (Fig. 2). One possible explanation is that alterations in cellular components that are required to maintain a healthy level of free zinc in the ΔzntA cells also lead to a decreased growth rate.
Fig. 4. Measurement of intracellular free zinc concentrations using wild type CA_TagRFP sensor.
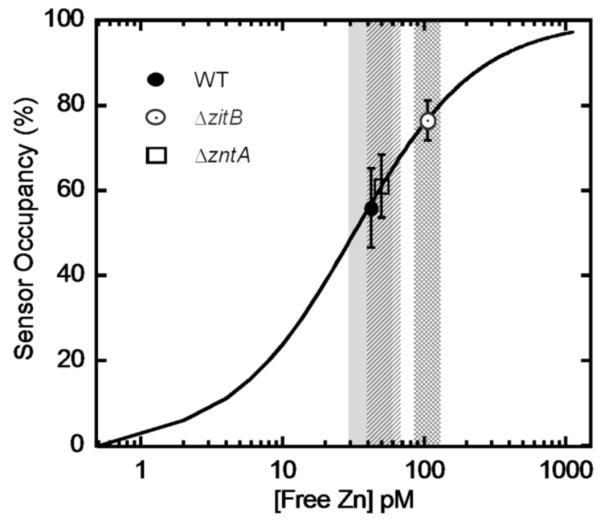
E. coli strains BW25113, ΔzntA and ΔzitB transformed with pTH_CA_TagRFP (KZn ~ 30 pM) were grown in MOPS minimal medium and the cells were imaged at log phase after addition of DPS to measure the fluorescence intensity ratio IFRET/IFP. The sensor occupancy and the free intracellular zinc concentration were determined by comparison to an in situ calibration curve of wt CA_TagRFP, as described previously [24]. The intracellular free zinc as an average of ~100 cells in each sample and the error range are illustrated as follows: WT (filled circle, solid gray), ΔzntA (open square, dash), ΔzitB (open circle, cross hatch).
3.4 Role of zntA and zitB in Regulating Intracellular Free Zinc
We previously reported a transient increase in the intracellular free zinc in BL21(DE3) E. coli after addition of micromolar levels of total zinc to the medium [24]. Here we examine the time-dependence of the fluctuation in intracellular free zinc, and explore the functions of ZntA and ZitB in regulating intracellular free zinc.
In E. coli BW25113 (WT) cells, after zinc shock the intracellular free zinc increases dramatically (up to 103-fold) to nanomolar levels within 5 min, reaching a maximal concentration at ~ 10 min (Fig. 5(a)). The magnitude of the change in free zinc increases with the external zinc concentration; for addition of 10 μM, 50 μM and 100 μM ZnSO4 to the medium, the intracellular free zinc concentration peaks at 5 nM, 30 nM and 45 nM, respectively. This pattern of temporary increase is similar to the observed changes in total zinc, although the magnitude of the alteration in free zinc concentration is much higher than the total zinc increase (2- to 4-fold, Fig. 3), indicative of the limited buffering capacity of an E. coli cell facing an abrupt zinc challenge. In a second phase, the zinc concentration decreases rapidly over the next 10 to 20 min followed by a slower decrease in zinc to nanomolar or lower levels at 1 hr. Transcriptional and/or translational up-regulation of efflux systems, down-regulation of zinc importers, and/or changes in the capacity of zinc buffers in E. coli can occur within this time frame to reduce the intracellular free zinc concentration.
Fig. 5. Changes in intracellular free zinc in E. coli WT, ΔzitB and ΔzntA strains after zinc shock.

E. coli cells expressing the H94N CA_TagRFP (KZn ~ 9 nM) sensor were grown in MOPS minimal medium, and imaging samples were prepared by incubation with DPS as described in the Experimental section. Various concentrations of ZnSO4 (0 – 100 μM) were added to the imaging medium and the cells were imaged to measure the fluorescence intensity ratio IFRET/IFP as a function of time. The sensor occupancy and the free intracellular zinc concentration were determined by comparison to an in situ calibration curve of H94N CA_TagRFP, as described previously [24]. Free zinc concentrations for cells grown in MOPS minimal medium without zinc (as measured in Fig. 4) are used as the baseline level at time zero. (a).(b).(c). The intracellular free zinc changes over time after addition of varying external zinc concentrations in wild type
To examine the role of zinc exporters in zinc homeostasis, we monitored the intracellular free zinc changes in the zntA and zitB single knock-out strains after zinc shock (Fig. 5). In the ΔzitB knockout strain, the intracellular free zinc peaks at a level that is ~ 3-fold higher than the WT maximal zinc concentration (Fig. 5(a),(b),(d)), suggesting an impairment in the initial zinc efflux. However, after reaching this peak, the zinc concentration declines within a time frame that is comparable to the WT strain, indicating that efflux mechanisms other than ZitB are deployed to lower the free zinc concentration. The de-coupler carbonylcyanide-p-trifluoromethoxyphenylhydrazone (FCCP) inhibits ZitB by disrupting the proton gradient across the membrane [22]; addition of 10 μM FCCP to the wild-type strain leads to an enhanced free zinc peak after zinc shock, mimicking the results obtained in the zitB knock-out strain (Fig. 6(a)). Although no significant growth defects in the presence of high extracellular zinc concentrations have been observed in the ΔzitB compared to the WT strain [14] (Fig. 2), the intracellular zinc measurements demonstrate that ZitB plays an important role in alleviating the initial zinc accumulation that potentially minimizes cellular toxicity caused by the sudden zinc influx.
Fig. 6. The de-coupler FCCP and protein synthesis inhibitors alter the intracellular free zinc fluctuations after zinc shock.

E. coli cells expressing the H94N CA_TagRFP sensor were grown in MOPS minimal medium and imaging samples were prepared as described in Experimental 2.3. (a). The de-coupler FCCP inhibits the function of the ZitB exporter. 50 μM ZnSO4 was added to WT (solid circle, solid line) and ΔzitB (open circle, solid line) cells, or 50 μM ZnSO4 and 10 μM FCCP were added to WT cells (solid square, dashed line) in imaging medium at time zero. The effects of FCCP on the free zinc fluctuations in E. coli after zinc shock mimic the effects of the zitB knock-out. (b). Incubation of E. coli cells with protein synthesis inhibitors lead to prolonged high zinc levels after zinc shock. WT E. coli cells were incubated either with 170 μg/ml chloramphenicol and 50 μg/ml tetracycline for 10 min (solid square, dashed line), or without inhibitors (solid circle, solid line), then 50 μM ZnSO4 was added and the fluorescence intensity ratio was measured. The time dependence of the free zinc levels in the ΔzntA (open circle, solid line) strain after zinc shock was measured in the absence of inhibitors.
The ΔzntA strain exhibits a distinct temporal pattern in the intracellular free zinc changes after zinc shock compared to the WT and ΔzitB strains (Fig. 5(c)(d)). The initial increase in free zinc (within 10 min) is not as dramatic as that observed in the ΔzitB and even WT strains at high zinc. This slower increase in the free zinc concentration after zinc shock is likely due to accommodations that the ΔzntA strain makes prior to the zinc shock, such as up-regulation of zinc exporters or down-regulation of importers, to compensate for the loss of ZntA for growth in the presence of even moderate zinc concentrations in the medium. Consistent with this, we measured a significantly higher transcript level of zitB in the ΔzntA strain compared to WT, while the mRNA levels of the zinc importers zupT and znuC (the ATP binding component of zinc import complex ZnuABC) remain similar to those in the WT strain (Fig. 7(a)). The peak intracellular zinc level in the ΔzntA strain occurs at 30 min, rather than 10 min, and is 4-fold higher than the maximal free zinc level observed in the WT strain at 100 μM zinc in the medium. Furthermore, at 30 min the intracellular zinc concentration in the WT and ΔzitB strains decreases to a sub-nanomolar level. In the ΔzntA strain the free zinc concentration begins to decrease after 30 min but remains at 10 nM even 90 min after zinc shock (Fig. 5; data not shown). The rapid decrease in the free zinc concentration in the WT and ΔzitB strains compared to the ΔzntA strain suggests that expression of ZntA is induced under these conditions leading to the decrease in zinc concentration. To test this proposal, we measured the effect of biostatic protein synthesis inhibitors (chloramphenical and tetracycline) on the intracellular zinc concentration in the WT strain after zinc shock (Fig. 6(b)). Under these conditions, the WT strain is unable to rapidly reduce the zinc concentration leading to elevated zinc concentrations even after 1 hr, mirroring the slower zinc detoxification rate of the ΔzntA strain. The sustained high free zinc concentrations observed in the ΔzntA cells negatively impact cell growth and viability (Fig. 2), potentially by inhibiting a variety of cellular enzymes [26, 36], demonstrating the vital function of ZntA for survival of E. coli grown in high environmental zinc.
Fig. 7. zitB mRNA level is up-regulated in ΔzntA but remains relatively constant upon zinc shock.

Relative mRNA levels were measured by RT-PCR, and normalized by the level of the housekeeping gene transcript, rrsD, a 16S ribosomal RNA of the rrnD operon. (a). The mRNA level in WT is set as 1 (black bar), and the relative levels of zupT, znuC and zitB transcripts in ΔzntA are shown (gray bar). While transcription levels of zupT and znuC stay relatively constant, the mRNA level of zitB is increased more than 6-fold in the ΔzntA strain compared to that in WT. (b). E. coli cells (WT, solid circle; ΔzntA, open circle) were grown in MOPS minimal medium and 100 μM ZnSO4 was added at OD600 ~ 0.3, samples were taken at various time points thereafter. The zitB transcript level in WT before adding zinc is set as the base level 1. The mRNA level of zitB in ΔzntA is normalized against the baseline (before adding zinc) zitB mRNA level in WT. The level of the zitB transcript remains relatively constant over 1 hr after zinc shock with less than two-fold changes.
3.5 Transcriptional Response of Zinc Exporters and Importers
zntA Transcription
The previous data demonstrate that rapid and sustained detoxification of zinc relies on the expression of ZntA. Transcription of zntA is up-regulated by the transcription factor ZntR under high zinc stress [37]. ZntR was previously reported to have a femtomolar apparent affinity for zinc binding and transcriptional activation in in vitro experiments [23]. For this high zinc affinity, ZntR should be saturated at the picomolar free zinc concentrations observed using the CA-based zinc sensor (Fig. 4) if ZntR rapidly equilibrates with the buffered free zinc pool. To examine the zinc-dependence of intracellular ZntA expression, we measured the time-dependence of zntA mRNA levels in WT, ΔzntR and ΔzitB strains after zinc shock using RT-PCR. In the wild-type strain, the peak zntA mRNA levels increase (10- to 130-fold) roughly linearly in response to intracellular free zinc concentrations up to 50 nM (Fig. 8(a)); no increase in zntA mRNA after zinc shock is observed in the ΔzntR strain. These data indicate that ZntR enhances transcription in response to nanomolar, rather than femtomolar, levels of free zinc in vivo. In the ΔzitB strain, the zntA mRNA level after zinc shock is increased by ~ 600-fold (Fig. 8(b)), consistent with the increased free zinc peak concentration in this strain (Fig. 5). This result provides an explanation for the lack of an effect of the single gene knock-out of zitB on the growth and viability of E. coli as the loss of ZitB-catalyzed zinc efflux is readily compensated by the increased expression of ZntA.
Fig. 8. Transcription of zntA is strongly induced upon zinc shock.

Relative mRNA levels were measured by RT-PCR, and normalized by comparison to rrsD. (a). mRNA level of zntA in wild type (100 μM Zn, open circle; 50 μM Zn, open square; 10 μM Zn, solid circle) and in ΔzntR (100 μM Zn, solid square) at various extracellular zinc concentrations. The transcription levels increase as the zinc concentration increases. (b). mRNA level of zntA in wild type (solid circle) and ΔzitB (open square) strains at 50 μM extracellular zinc. The level of zntA mRNA in the ΔzitB strain is significantly higher than in the WT strain due to the higher intracellular zinc concentrations upon zinc shock (shown in Fig. 5).
zitB Transcription
In contrast to the increase in zntA transcription, we observed no dramatic changes in the zitB mRNA levels, as measured by RT-PCR, in both the WT and ΔzntA strains within one hour after addition of 100 μM ZnSO4 (Fig. 7(b)). This indicates that zitB expression is not directly responsive to increases in cellular free zinc concentrations in this time frame. These data indicate that ZitB is constitutively expressed in E. coli, consistent with a role as a first-line defense against excess zinc. A similar lack of increase in zitB mRNA transcripts 3 hours after zinc addition was reported previously [38]. However, one previous study showed that the reporter β-galactosidase activity increased by 3- to 5-fold after exposure to 50 - 100 μM zinc for 3 hrs in minimal salt medium using a φ(zitB-lacZ) operon fusion on the bacterial chromosome [14]. The authors proposed that zitB transcription was induced at high zinc, contrary to our observations. The reason for this discrepancy is not clear; one possible explanation is that high zinc concentration alters protein synthesis and degradation, leading to a modest accumulation of the reporter enzyme.
4. DISCUSSION
4.1 Regulation of Intracellular Free Zinc Fluctuations
Upon zinc shock, temporary increases in both the intracellular total and free zinc are observed; however, the increases in free zinc are much larger (Figs. 3 and 5). The dramatic increase in intracellular free zinc is caused by a sudden increase in the zinc influx due to the increased extracellular concentration coupled with a lack of sufficient intracellular ligands to rapidly sequester and buffer all of the excess zinc. While ZnuABC is the primary zinc transporter in zinc-depleted conditions, many metal transporters are proposed to catalyze zinc import under zinc-replete conditions, including ZupT (ZIP family), Pit (phosphate transporter), and other metal transporters with relatively low specificities [8, 35]. A dramatic increase in the extracellular zinc concentration disrupts the established metal gradient across the cell membrane and leads to zinc influx via multiple transporters. These increases in total intracellular zinc overwhelm the zinc buffering capacity of E. coli; the lack of an abundant intracellular ligand similar to metallothionein may exacerbate the initial accumulation of free zinc ion in the cytosol after zinc shock. However, even under these conditions the total zinc concentration is more than 103-fold higher than the free zinc concentration (800 μM vs. 30 nM in the WT strain at 50 μM extracellular zinc), indicating that the majority of zinc is chelated. A similar transient increase in cytosolic zinc content after zinc shock has been proposed to occur in S. cerevisiae; in this case, zinc is transported into the cell, causing a temporary increase in the cytosolic zinc concentration, before the zinc concentration is reduced mainly by sequestration into the vacuole [39]. In E. coli the alterations in the zinc concentrations observed in the ΔzitB and ΔzntA strains indicate that both of these exporters play important roles in reducing cytosolic free zinc. In addition to up-regulation of zinc exporters, a variety of other mechanisms could play a role in reducing free zinc concentrations, such as down-regulation of zinc importers, and synthesis of small molecule metal ligands, such as cysteine and glutathione, to enhance the intracellular buffering capacity [40].
4.2 Role of zntA and zitB in Zinc Detoxification after Zinc Shock
The differential patterns of intracellular free zinc changes in the WT, ΔzitB and ΔzntA strains reveal the diverse functions of ZitB and ZntA in zinc detoxification. ZitB is constitutively expressed and not up-regulated under high zinc conditions, thereby functioning as a first-line defense against the initial zinc influx to minimize the toxic effects. The expression of ZntA is induced dramatically in a zinc concentration-dependent manner to provide the sustained efflux needed to achieve and maintain the required low levels of intracellular free zinc. Therefore, the redundancy of the detoxification systems of E. coli ensures that the cells can adapt to abrupt and extreme environmental challenges in zinc concentration. Furthermore, these data imply that additional zinc detoxification systems function in E. coli. Even in the zntA knock-out strain, the cells are able to reduce the intracellular zinc levels (Figs. 3 and 5), albeit with a weakened response and prolonged high intracellular zinc. Although zitB mRNA level is elevated in ΔzntA compared to WT (Fig. 7(a)), this decline is unlikely solely due to export catalyzed by ZitB for two reasons: (1) the transcription level of zitB was not significantly elevated upon zinc shock in ΔzntA (Fig. 7(b)) and (2) the ΔzntAΔzitB strain exhibits a zinc resistance level similar to that of ΔzntA [14]. Other transporters may play additional roles in zinc detoxification. For example, YiiP, a CDF family transporter, has demonstrated zinc transport activity in vitro [19, 20] even though its over-expression or deletion did not appear to alter the cells’ sensitivity to zinc [14]. Furthermore, some multidrug resistance efflux systems are up-regulated in high zinc medium and knock-out of these transporters impact the growth of enterobacteria under high zinc stress [18, 38]. Additionally, zinc importers such as ZnuABC are down-regulated under high zinc [40], helping to maintain low intracellular zinc levels by decreasing zinc influx.
The elevated intracellular zinc levels after zinc shock demonstrate the ability of E. coli cells to tolerate high levels of extracellular zinc by both accommodating higher intracellular concentrations for short periods of time in addition to detoxifying zinc by energy-consuming efflux. Cells could potentially adapt to a high zinc environment over a longer period of time by up-regulating synthesis of periplasmic and intracellular zinc ligands to enhance the buffering capacity of the cell, such as the periplasmic zinc-binding protein ZraP and the cysteine synthesis pathway [40, 41]. Ribosomes have been proposed as a major zinc storage pool under normal conditions [42] [43]; under zinc deficient conditions zinc is released from ribosomes for use in other metalloproteins [44]. However, the importance of ribosomes in buffering zinc under excess zinc is unknown. Additional mechanisms in E. coli zinc tolerance remain to be investigated.
4.3 Intracellular Free Zinc Spikes Accelerate a Transcriptional Response
The temporary intracellular peak in free zinc may be important for activating the zinc detoxification system in E. coli. Intracellular zinc concentrations lower than 1 nM, including the measured values of 20 – 50 pM (Fig. 1), mean that there is less than one free zinc ion per E. coli cell, as originally discussed by O’Halloran and colleagues [23]. These low concentrations of free zinc can lead to slow equilibration of proteins with the total zinc pool even when zinc association is limited by diffusion. The zinc affinity of ZntR measured in vitro is in the femtomolar range [23]; however, the activation of zntA transcription in vivo occurs at nanomolar concentrations of free zinc (Fig. 8). This discrepancy suggests that ZntR may respond mainly to transient changes in zinc so that it is under kinetic, rather than thermodynamic, control. At 50 pM free zinc, there is <1 free zinc ion per cell; however, the total zinc concentration is 200 – 800 μM (Fig. 3) indicating that various ligands in the cytosol are capable of binding and buffering zinc to maintain the low free zinc ion levels. Assuming a reasonable zinc association rate constant of 107 M−1s−1 to ZntR [45], the half time for equilibration is ~ 20 min at 50 pM free zinc. Therefore, if ZntR only binds free zinc, equilibration with cellular zinc pools should be slow under these conditions. However, the equilibration half time is accelerated to seconds when the free zinc concentration reaches the nanomolar range. Sudden exposure of E. coli to high concentrations of environmental zinc causes a transient fluctuation in the intracellular free zinc concentration to a value that is orders of magnitude higher than the resting level. This change in intracellular free zinc accelerates the association rate of zinc with ZntR which in turn enhances transcription of ZntR-responsive genes and initiates the regulated zinc detoxification process. This analysis suggests that kinetic control of ZntR is plausible and that fluctuation of intracellular zinc concentrations could lead to activation of expression systems that allow the cell to react and adapt to environmental changes. These data are consistent with the zinc homeostasis model proposed by David Eide [29], in which transcriptional responses are mediated by fluctuations in intracellular zinc.
4.4 The In Vivo Zinc Affinity of ZntR
In vitro zinc binding and transcription assays measured under equilibrium conditions demonstrated that ZntR responds to changes in free zinc in the femtomolar range [23]. Therefore, if ZntR equilibrates rapidly with the intracellular free zinc concentration under all conditions, then transcription of ZntR-responsive genes should be saturated even in low zinc media where [Zn]free is at picomolar levels (Fig. 4, [24]). The apparent rate for zinc association can be increased significantly by binding a zinc species chelated by small molecules or putative “zinc chaperones” as the concentrations of these complexes could be significantly higher since the total cellular zinc concentration is ~ 200 μM (Fig. 3). However, our data show that the zntA mRNA increases by 10- to 100-fold as the intracellular free zinc concentration increases from ~ 50 pM to 5 - 80 nM (i.e. the availability of free zinc ions increases from <1 to 5 - 100 ions per cell) (Fig. 8). Therefore, ZntR-mediated transcription of zntA has an apparent K1/2 for free zinc in the nanomolar range in vivo. Here we explore some possible explanations for the discrepancy between the apparent zinc affinity of ZntR under in vivo and in vitro conditions.
First, as proposed above, activation of ZntR by zinc could be kinetically controlled. If ZntR only binds free zinc ions it should not rapidly equilibrate with the pM levels of cellular free zinc. Increasing the free zinc concentration to nM levels accelerates the formation of zinc-bound ZntR and subsequent activation of zntA transcription. Therefore ZntR could be activated by free zinc in the nanomolar range as the apparent association rate is linearly dependent on the free zinc concentration. In this model, activation depends mainly on the zinc association rate constant, assuming that kon[Zn2+] > koff, and theoretically the zinc dissociation constant could be either femtomolar or low nanomolar. On the other hand, if ZntR has a femtomolar affinity for zinc as reported previously, a simple model of kinetic control cannot explain the rapid decline in the zntA transcript level paralleling the decreases in intracellular free zinc (Fig. 9). Assuming a simple association reaction with diffusion-controlled zinc binding, the half-time for zinc dissociation for a femtomolar zinc binding site is estimated at >100 days; this half-time decreases to the minute range for a nanomolar affinity site. The zntA mRNA level is maximal at 10 to 15 min after zinc shock and then decreases over the next 30 min, paralleling the decline in the intracellular free zinc level (Fig. 9). Furthermore, the transcript level increases with the peak free zinc concentration up to nanomolar levels. More complicated mechanisms, such as zinc-dependent enhancement of RNA degradation or proteolysis of zinc-bound ZntR, could contribute to the decrease in the ZntA mRNA levels.
Fig. 9. Correlating time course between intracellular free zinc changes and the transcription level of zntA.

The changes in the transcript level of zntA mRNA largely follow the changes of intracellular free zinc with a 5 – 10 min time lag across various zinc concentrations. This correlation suggests that zntA transcription is regulated kinetically by the intracellular free zinc changes, and that ZntR has a nanomolar intracellular zinc affinity.
Second, all of the data can be easily explained if the ZntR-mediated transcription has a nanomolar, rather than femtomolar, apparent K1/2 in the cell. In this case, transcription will readily respond to fluctuations in the intracellular free zinc concentration at nanomolar levels. A number of explanations for the apparent decrease in the zinc affinity of ZntR in vivo can be envisioned. For example, the K1/2 for activation of ZntR by zinc could be increased from fM to the nM range due to competition with other ligands, oxidation of the cysteine ligands in ZntR and/or negative allosteric regulation by other effectors in the cell. Alternatively, another component in the transcription complex could require nanomolar free zinc concentrations to activate transcription or zinc binding to ZntR could stabilize the protein and enhance the availability of ZntR in the cell, thereby regulating the transcriptional response [25].
5. CONCLUSIONS
Exposure of E. coli cells to micromolar environmental zinc concentrations leads to a transient intracellular free zinc peak in the nanomolar range. If the zinc peak is short-lived, it has little effect on the growth rate and viability of E. coli cells. Several exporters, including ZitB and ZntA, function to decrease intracellular zinc concentrations. In particular, the transient intracellular zinc rise to nanomolar levels induces ZntR-mediated transcription of zntA as a cellular response to zinc detoxification.
ZitB and ZntA exhibit distinct functions in regulating intracellular free zinc upon zinc shock. ZitB counteracts the initial zinc influx, acting as a first-line defense against zinc shock. In contrast, expression of the ZntA exporter is induced by the increase in free zinc and provides an efficient and sustainable detoxification mechanism to remove excess cellular zinc. This temporal pattern reveals that E. coli coordinates multiple mechanisms to reduce metal toxicity.
ACKNOWLEDGEMENTS
We thank Dr. Ursula Jakob and Wei-Yun Chen at the University of Michigan Department of Molecular, Cellular and Developmental Biology for their help with the RT-PCR experiments, and Roberto de la Salud Bea for his help with DPS synthesis. We acknowledge the support of National Institute of Health and National Institute of Biomedical Imaging and Bioengineering for project grant RO1 EB003924.
6. ABBREVIATIONS
- CA
carbonic anhydrase
- CDF
cation diffusion facilitator
- DPS
Dapoxyl sulfonamide
- FCCP
carbonyl cyanide-p-trifluoromethoxyphenylhydrazone
- FRET
Förster resonance energy transfer
- ICP-MS
inductively coupled plasma mass spectrometry
- IFRET
fluorescence intensity of FRET channel
- IFP
fluorescence intensity of red fluorescence protein channel
- IPTG
isopropyl β-D-1-thiogalactopyranoside
- MOPS
4-morpholinepropanesulfonic acid
- RFP
red fluorescent protein
- TPEN
N,N,N’,N’-tetrakis(2-pyridylmethyl)ethylenediamine
- WT
wild type
- ZIP
Zrt/IRT-like protein
Footnotes
Publisher's Disclaimer: This is a PDF file of an unedited manuscript that has been accepted for publication. As a service to our customers we are providing this early version of the manuscript. The manuscript will undergo copyediting, typesetting, and review of the resulting proof before it is published in its final citable form. Please note that during the production process errors may be discovered which could affect the content, and all legal disclaimers that apply to the journal pertain.
REFERENCES
- [1].Vallee BL, Falchuk KH. Physiol Rev. 1993;vol. 73:79–118. doi: 10.1152/physrev.1993.73.1.79. [DOI] [PubMed] [Google Scholar]
- [2].Auld DS. Biometals. 2001;vol. 14:271–313. doi: 10.1023/a:1012976615056. [DOI] [PubMed] [Google Scholar]
- [3].Vallee BL, Auld DS. Matrix Suppl. 1992;vol. 1:5–19. [PubMed] [Google Scholar]
- [4].Laity JH, Lee BM, Wright PE. Curr Opin Struct Biol. 2001;vol. 11:39–46. doi: 10.1016/s0959-440x(00)00167-6. [DOI] [PubMed] [Google Scholar]
- [5].Maret W, Jacob C, Vallee BL, Fischer EH. Proc Natl Acad Sci U S A. 1999;vol. 96:1936–1940. doi: 10.1073/pnas.96.5.1936. [DOI] [PMC free article] [PubMed] [Google Scholar]
- [6].Fosmire GJ. Am J Clin Nutr. 1990;vol. 51:225–227. doi: 10.1093/ajcn/51.2.225. [DOI] [PubMed] [Google Scholar]
- [7].Blencowe DK, Morby AP. FEMS Microbiol Rev. 2003;vol. 27:291–311. doi: 10.1016/S0168-6445(03)00041-X. [DOI] [PubMed] [Google Scholar]
- [8].Hantke K. Biometals. 2001;vol. 14:239–249. doi: 10.1023/a:1012984713391. [DOI] [PubMed] [Google Scholar]
- [9].Grass G, Franke S, Taudte N, Nies DH, Kucharski LM, Maguire ME, Rensing C. J Bacteriol. 2005;Vol. 187:1604–1611. doi: 10.1128/JB.187.5.1604-1611.2005. [DOI] [PMC free article] [PubMed] [Google Scholar]
- [10].Grass G, Wong MD, Rosen BP, Smith RL, Rensing C. J Bacteriol. 2002;Vol. 184:864–866. doi: 10.1128/JB.184.3.864-866.2002. [DOI] [PMC free article] [PubMed] [Google Scholar]
- [11].Patzer SI, Hantke K. J Biol Chem. 2000;vol. 275:24321–24332. doi: 10.1074/jbc.M001775200. [DOI] [PubMed] [Google Scholar]
- [12].Patzer SI, Hantke K. Mol Microbiol. 1998;vol. 28:1199–1210. doi: 10.1046/j.1365-2958.1998.00883.x. [DOI] [PubMed] [Google Scholar]
- [13].Lee SM, Grass G, Haney CJ, Fan B, Rosen BP, Anton A, Nies DH, Rensing C. FEMS Microbiol Lett. 2002;vol. 215:273–278. doi: 10.1111/j.1574-6968.2002.tb11402.x. [DOI] [PubMed] [Google Scholar]
- [14].Grass G, Fan B, Rosen BP, Franke S, Nies DH, Rensing C. J Bacteriol. 2001;vol. 183:4664–4667. doi: 10.1128/JB.183.15.4664-4667.2001. [DOI] [PMC free article] [PubMed] [Google Scholar]
- [15].Outten CE, Outten FW, O’Halloran TV. J Biol Chem. 1999;vol. 274:37517–37524. doi: 10.1074/jbc.274.53.37517. [DOI] [PubMed] [Google Scholar]
- [16].Rensing C, Mitra B, Rosen BP. Proc Natl Acad Sci U S A. 1997;vol. 94:14326–14331. doi: 10.1073/pnas.94.26.14326. [DOI] [PMC free article] [PubMed] [Google Scholar]
- [17].Hantke K. Curr Opin Microbiol. 2005;vol. 8:196–202. doi: 10.1016/j.mib.2005.02.001. [DOI] [PubMed] [Google Scholar]
- [18].Nishino K, Nikaido E, Yamaguchi A. J Bacteriol. 2007;vol. 189:9066–9075. doi: 10.1128/JB.01045-07. [DOI] [PMC free article] [PubMed] [Google Scholar]
- [19].Grass G, Otto M, Fricke B, Haney CJ, Rensing C, Nies DH, Munkelt D. Arch Microbiol. 2005;Vol. 183:9–18. doi: 10.1007/s00203-004-0739-4. [DOI] [PubMed] [Google Scholar]
- [20].Wei Y, Fu D. J Biol Chem. 2005;Vol. 280:33716–33724. doi: 10.1074/jbc.M506107200. [DOI] [PubMed] [Google Scholar]
- [21].Chao Y, Fu D. J Biol Chem. 2004;vol. 279:12043–12050. doi: 10.1074/jbc.M313510200. [DOI] [PubMed] [Google Scholar]
- [22].Anton A, Weltrowski A, Haney CJ, Franke S, Grass G, Rensing C, Nies DH. J Bacteriol. 2004;vol. 186:7499–7507. doi: 10.1128/JB.186.22.7499-7507.2004. [DOI] [PMC free article] [PubMed] [Google Scholar]
- [23].Outten CE, O’Halloran TV. Science. 2001;vol. 292:2488–2492. doi: 10.1126/science.1060331. [DOI] [PubMed] [Google Scholar]
- [24].Wang D, Hurst TK, Thompson RB, Fierke CA. J Biomed Opt. 2011;vol. 16 doi: 10.1117/1.3613926. In press. [DOI] [PMC free article] [PubMed] [Google Scholar]
- [25].Pruteanu M, Neher SB, Baker TA. J Bacteriol. 2007;vol. 189:3017–3025. doi: 10.1128/JB.01531-06. [DOI] [PMC free article] [PubMed] [Google Scholar]
- [26].Hitomi Y, Outten CE, O’Halloran TV. J Am Chem Soc. 2001;vol. 123:8614–8615. doi: 10.1021/ja016146v. [DOI] [PubMed] [Google Scholar]
- [27].Blindauer CA, Harrison MD, Robinson AK, Parkinson JA, Bowness PW, Sadler PJ, Robinson NJ. Mol Microbiol. 2002;vol. 45:1421–1432. doi: 10.1046/j.1365-2958.2002.03109.x. [DOI] [PubMed] [Google Scholar]
- [28].Rae TD, Schmidt PJ, Pufahl RA, Culotta VC, O’Halloran TV. Science. 1999;Vol. 284:805–808. doi: 10.1126/science.284.5415.805. [DOI] [PubMed] [Google Scholar]
- [29].Eide DJ. Biochim Biophys Acta. 2006;vol. 1763:711–722. doi: 10.1016/j.bbamcr.2006.03.005. [DOI] [PubMed] [Google Scholar]
- [30].Fierke CA, Thompson RB. Biometals. 2001;Vol. 14:205–222. doi: 10.1023/a:1012980628412. [DOI] [PubMed] [Google Scholar]
- [31].Merzlyak EM, Goedhart J, Shcherbo D, Bulina ME, Shcheglov AS, Fradkov AF, Gaintzeva A, Lukyanov KA, Lukyanov S, Gadella TW, Chudakov DM. Nat Methods. 2007;Vol. 4:555–557. doi: 10.1038/nmeth1062. [DOI] [PubMed] [Google Scholar]
- [32].Baba T, Ara T, Hasegawa M, Takai Y, Okumura Y, Baba M, Datsenko KA, Tomita M, Wanner BL, Mori H. Mol Syst Biol. 2006;vol. 2:2006–0008. doi: 10.1038/msb4100050. [DOI] [PMC free article] [PubMed] [Google Scholar]
- [33].Neidhardt FC, Bloch PL, Smith DF. J Bacteriol. 1974;vol. 119:736–747. doi: 10.1128/jb.119.3.736-747.1974. [DOI] [PMC free article] [PubMed] [Google Scholar]
- [34].Thompson RB, Maliwal BP, Zeng HH. Journal of Biomedical Optics. 2000;vol. 5:17–22. doi: 10.1117/1.429963. [DOI] [PubMed] [Google Scholar]
- [35].Beard SJ, Hashim R, Membrillo-Hernandez J, Hughes MN, Poole RK. Mol Microbiol. 1997;vol. 25:883–891. doi: 10.1111/j.1365-2958.1997.mmi518.x. [DOI] [PubMed] [Google Scholar]
- [36].Gattis SG, Hernick M, Fierke CA. J Biol Chem. vol. 285:33788–33796. doi: 10.1074/jbc.M110.147173. [DOI] [PMC free article] [PubMed] [Google Scholar]
- [37].Brocklehurst KR, Morby AP. Microbiology. 2000;Vol. 146(Pt 9):2277–2282. doi: 10.1099/00221287-146-9-2277. [DOI] [PubMed] [Google Scholar]
- [38].Lee LJ, Barrett JA, Poole RK. J Bacteriol. 2005;Vol. 187:1124–1134. doi: 10.1128/JB.187.3.1124-1134.2005. [DOI] [PMC free article] [PubMed] [Google Scholar]
- [39].MacDiarmid CW, Milanick MA, Eide DJ. J Biol Chem. 2003;vol. 278:15065–15072. doi: 10.1074/jbc.M300568200. [DOI] [PubMed] [Google Scholar]
- [40].Yamamoto K, Ishihama A. J Bacteriol. 2005;Vol. 187:6333–6340. doi: 10.1128/JB.187.18.6333-6340.2005. [DOI] [PMC free article] [PubMed] [Google Scholar]
- [41].Leonhartsberger S, Huber A, Lottspeich F, Bock A. J Mol Biol. 2001;Vol. 307:93–105. doi: 10.1006/jmbi.2000.4451. [DOI] [PubMed] [Google Scholar]
- [42].Akanuma G, Nanamiya H, Natori Y, Nomura N, Kawamura F. J Bacteriol. 2006;Vol. 188:2715–2720. doi: 10.1128/JB.188.7.2715-2720.2006. [DOI] [PMC free article] [PubMed] [Google Scholar]
- [43].Hensley MP, Tierney DL, Crowder MW. Biochemistry. doi: 10.1021/bi200619w. [DOI] [PMC free article] [PubMed] [Google Scholar]
- [44].Panina EM, Mironov AA, Gelfand MS. Proc Natl Acad Sci U S A. 2003;vol. 100:9912–9917. doi: 10.1073/pnas.1733691100. [DOI] [PMC free article] [PubMed] [Google Scholar]
- [45].Buchsbaum JC, Berg JM. Inorg. Chim. Acta. 2000;Vol. 297:217–219. [Google Scholar]