Abstract
DNA methylation is an essential epigenetic mark that is required for normal development. Knockout of the DNA methyltransferase enzymes in the mouse hematopoietic compartment reveals that methylation is critical for hematopoietic differentiation. To better understand the role of DNA methylation in hematopoiesis, we characterized genome-wide DNA methylation in primary mouse hematopoietic stem cells (HSCs), common myeloid progenitors (CMPs), and erythroblasts (ERYs). Methyl binding domain protein 2 (MBD) enrichment of DNA followed by massively parallel sequencing (MBD-seq) was used to map genome-wide DNA methylation. Globally, DNA methylation was most abundant in HSCs, with a 40% reduction in CMPs, and a 67% reduction in ERYs. Only 3% of peaks arise during differentiation, demonstrating a genome-wide decline in DNA methylation during erythroid development. Analysis of genomic features revealed that 98% of promoter CpG islands are hypomethylated, while 20%–25% of non-promoter CpG islands are methylated. Proximal promoter sequences of expressed genes are hypomethylated in all cell types, while gene body methylation positively correlates with gene expression in HSCs and CMPs. Elevated genome-wide DNA methylation in HSCs and the positive association between methylation and gene expression demonstrates that DNA methylation is a mark of cellular plasticity in HSCs. Using de novo motif discovery, we identified overrepresented transcription factor consensus binding motifs in methylated sequences. Motifs for several ETS transcription factors, including GABPA and ELF1, are overrepresented in methylated regions. Our genome-wide survey demonstrates that DNA methylation is markedly altered during myeloid differentiation and identifies critical regions of the genome and transcription factor programs that contribute to hematopoiesis.
Epigenetic mechanisms of gene regulation are heritable, reversible modifications that are critical for the organization of chromatin and regulation of tissue-specific gene expression. DNA methylation is a dynamic epigenetic mark primarily localized to cytosine residues in the context of a CpG dinucleotide in mammals. Targeted disruption of the genes responsible for de novo methylation and maintenance of DNA methylation during replication demonstrate that DNA methylation is essential for proper development in the mouse (Laget et al. 2010; Ma et al. 2010). While the critical role for DNA methylation in early development is clearly established, the role for DNA methylation in tissue specification is less understood.
DNA methylation has long been recognized as an important mark in establishing and maintaining imprinted gene expression and X-chromosome inactivation. Apart from these specialized roles for DNA methylation, little is known about how DNA methylation leads to more general alterations in gene expression. Methyl-binding domain proteins are a family of DNA-binding proteins that recognize methylated DNA and modify gene expression by forming complexes with other regulatory proteins. Studies of mouse knockout models of the MBD proteins demonstrate unique but nonessential roles for most of these proteins (Bogdanovic and Veenstra 2009). Of the MBD proteins, MBD2 appears to play an important role in hematopoiesis, with specific roles in globin gene switching (Rupon et al. 2006).
The hematopoietic system is ideal for the study of methylation during differentiation because primary cells at specific stages can be separated from other hematopoietic cells by flow cytometry. The hematopoietic stem cell (HSC) gives rise to all cells in the peripheral blood. The common myeloid progenitor (CMP) generates only myeloid cells (red cells, platelets, granulocytes, monocytes, and eosinophils), but not lymphoid cells (T- and B-lymphocytes). Erythroblasts (ERYs) are nucleated red blood cells that have committed to terminal differentiation. Conditional knockout mice in which the genes for the de novo methyltransferases Dnmt3a and Dnmt3b are deleted in HSCs retain the ability to differentiate into both myeloid and lymphoid lineages, but long-term repopulation of the hematopoietic system is impaired (Tadokoro et al. 2007). Serial transplantation of Dnmt3a deficient HSCs revealed impaired differentiation as well as impaired repopulation (Challen et al. 2012). Similarly, conditional knockout mice in which the gene for the maintenance DNA methyltransferase Dnmt1 is deleted in HSCs demonstrated severe impairment of repopulating ability and inappropriate enhancement of mature myeloid lineages (Broske et al. 2009; Trowbridge et al. 2009). Together these studies demonstrate a profound role for DNA methylation in hematopoiesis.
While the importance of DNA methylation in hematopoietic differentiation has been well established, the genome-wide localization of methylated DNA at specific stages of myeloid differentiation remains to be elucidated. Recent advances in sequencing technology have allowed comprehensive surveys of DNA methylation with varying degrees of resolution. The highest-resolution techniques use bisulfite sequencing approaches that have the advantage of single-base resolution but do not distinguish between 5-methylcytosine and 5-hydroxymethylcytosine (Kriaucionis and Heintz 2009; Tahiliani et al. 2009). In this study, we used a recombinant methyl-binding domain protein to enrich 5-methylcytosine modified regions of the genome for massively parallel sequence analysis (MBD-seq). Using this approach, we compared genome-wide methylation in purified populations of murine HSCs, CMPs, and ERYs. By focusing on methylation changes defined by peaks as opposed to site-specific methylation, we were able to identify discrete regions of the genome where dynamic methylation changes occur during hematopoiesis. Our study reveals that the greatest number of methylation peaks occurs in HSCs and that these peaks are specifically and successively lost during myeloid differentiation, consistent with the bias in myeloid lineages seen in Dnmt1 knockout mice (Broske et al. 2009; Trowbridge et al. 2009). The identification of regions where methylation changes during hematopoiesis will facilitate mechanistic studies of how DNA methylation regulates hematopoietic differentiation.
Results
Genome-wide DNA methylation declines during myeloid differentiation
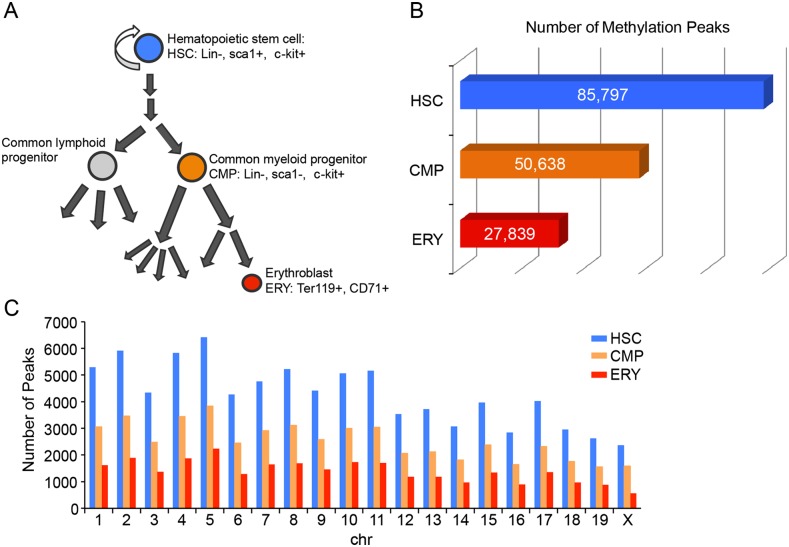
Whole-genome sequencing in human embryonic stem cells has demonstrated that as much as 80% of all CpG dinucleotides in the genome are methylated (Laurent et al. 2010), yet it is unlikely that all of these sites are relevant to differentiation. MBD-seq identifies regions of the genome bound by a DNA methylation-binding protein, highlighting loci containing multiple methylated CpG sites. Recombinant MBD2 pull-down of methylated genomic DNA combined with massively parallel sequencing was used to identify methylated genomic loci in enriched populations of lineage negative Sca1+ c-kit+ cells (a population of cells enriched for long- and short-term HSCs and multipotent progenitors, which we have designated as HSCs), common myeloid progenitors (CMPs), and erythroblasts (ERYs) (Fig. 1A). Two biological replicates were included for each of the three cell types with the total number of reads ranging from 32 to 46 million. A complete summary of the sequencing reads is provided in Supplemental Table S1. Nonenriched genomic DNA was sequenced to determine a standard background for subsequent analysis. Supplemental Figure S2 illustrates the sequencing results for a region containing the imprinting control region of the imprinted gene Snrpn. Consistent with the observation that Snrpn is imprinted within all cells, specific peaks of DNA methylation were detected in all three cell types.
Figure 1.
Overview of MBD sequencing results. (A) Schematic representation of hematopoiesis highlighting the three cell types enriched for methylation analysis. HSC and CMP cell populations were lineage depleted (Lin−) and then positively selected with the cell surface markers Sca1 and c-kit. Erythroblast cells were positively selected with antibodies for Ter119 and CD71. (B) Total number of methylation peaks called in each of the three cell populations. (C) Total methylation peak count per chromosome for each cell population: HSC (blue); CMP (orange); ERY (red).
To quantify genome-wide DNA methylation levels, mapped sequencing reads were analyzed to determine statistically significant peaks of methylation. In a conservative filtering approach, MBD-seq peaks were called if they were present in both biological replicates and overlapped by at least 200 bp. The average distribution of peak lengths was also investigated, with the average peaks occupying slightly more than 800 bp in each cell type (Supplemental Table S2). Comparison of overall peak count from each cell type revealed that DNA methylation peaks were most abundant in HSCs (85,797), with decreasing levels in CMPs (50,638) and fewer in ERYs (27,839) (Fig. 1B). The decrease in methylation reflects a global genomic decrease that is demonstrated by the similar relative distribution of methylation peaks on each chromosome between cell types despite the reduction in the total number of methylation peaks (Fig. 1C). Among the autosomes, chromosome 5 has the greatest number of DNA methylation peaks in all cell types, while the fewest number of peaks was found on chromosome 19. The X chromosome is subject to random X-chromosome inactivation in females, a process associated with DNA methylation. While all animals included in the HSC and CMP data sets were female, the fetal tissues used for ERY also included males resulting in a slightly lower density of peaks on the X chromosome in ERYs.
Both in silico validation of CpG content within peaks as well as bisulfite sequencing of selected peaks were performed to validate that the MBD-seq approach specifically recognizes methylated DNA. The distribution of peak length is shown in Supplemental Table S2, and the distribution of CpG content is shown in Table S3. At least 99.96% of all peaks called contained one CpG site with the average CpG count ranging from 21 to 24 CpGs per peak (Supplemental Table S3). Random sampling of sequences of similar length revealed that the MBD-enrichment approach results in a statistically significant higher percentage of peaks with CpG sites than is expected by chance (P-value = 0.00507) and with a significantly higher average CG content (P-value = 0.00391). Bisulfite sequencing of 10 genomic loci containing MBD-seq peaks (five common to all three data sets, four peaks unique to HSCs or progenitors [HSCs + CMPs], and one peak unique to ERYs) were found to have at least 47% methylation at the CpG sites per region investigated with an average of ∼80% methylation (Supplemental Fig. S5; Supplemental Table S4). Bisulfite sequencing at genomic regions that were not identified as statistically significant peaks revealed an average of 30.7% methylated CpG sites, consistent with the observation that CpG methylation is relatively common throughout the genome. The presence of low-to-intermediate levels of methylation in regions excluded from peaks confirms that the MBD-seq approach identifies regions of the genome with high-density methylation. An additional validation of our MBD-seq data set was achieved by comparing our methylation peaks to the recently published (Shearstone et al. 2011) reduced representation bisulfite sequencing (RRBS) data from mouse erythroblasts. Supplemental Figure S6 shows the degree of overlap between the erythroblast MBD-seq peaks and the RRBS data. Consistent with the conventional bisulfite sequencing validation, the overlap between the two data sets increases dramatically when the RRBS values exceed 30%–40% methylation (Supplemental Fig. S6).
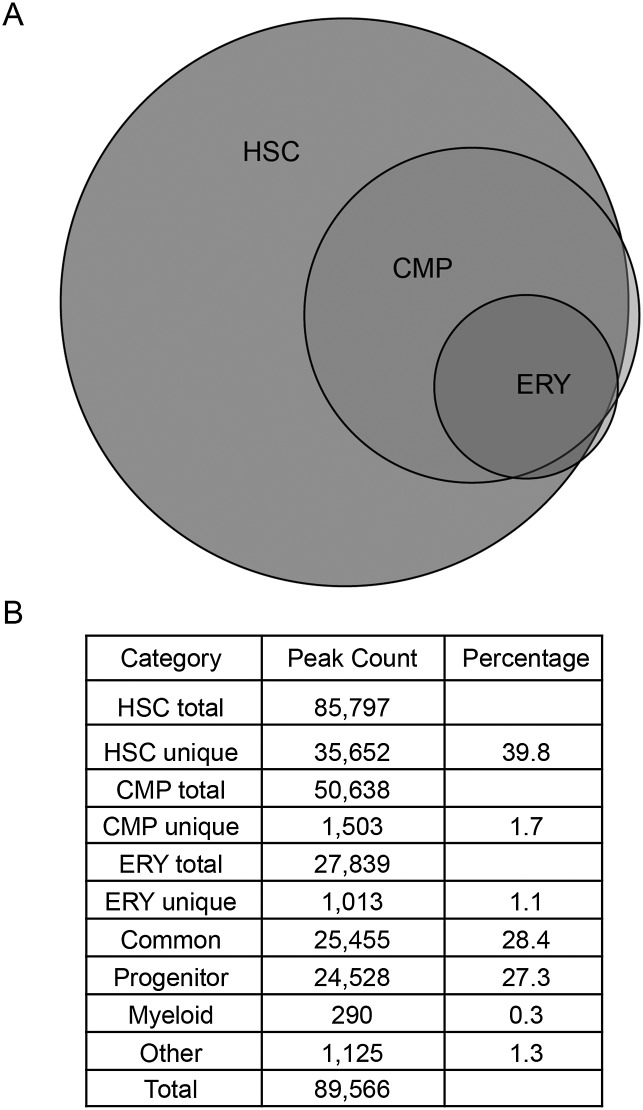
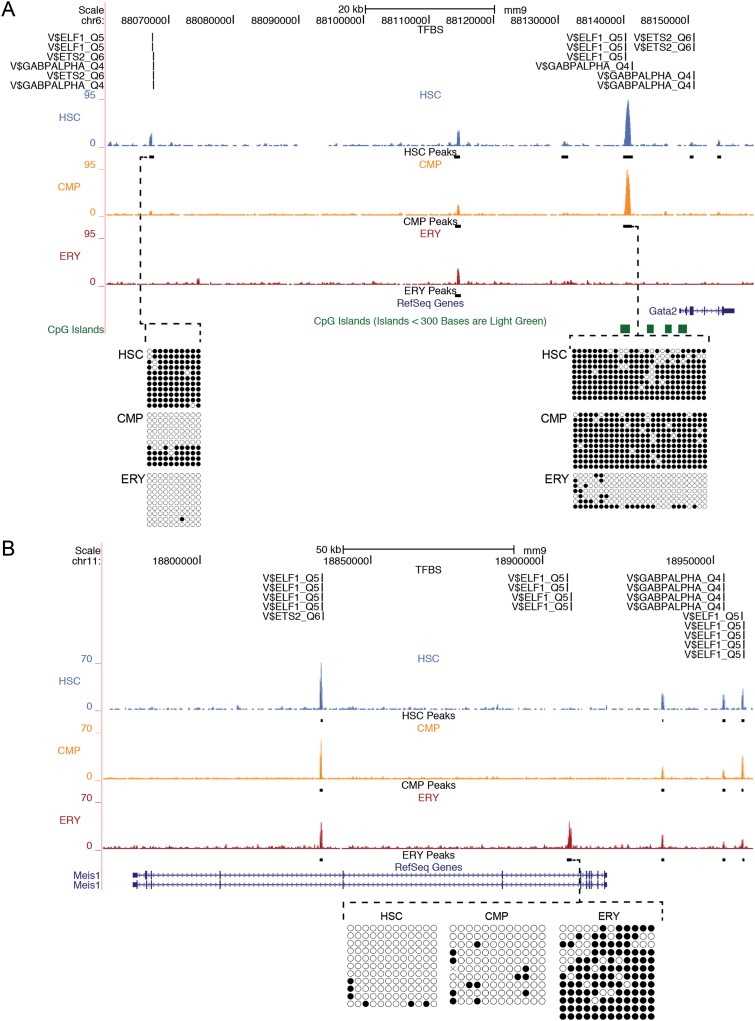
Because global DNA methylation peaks decrease with myeloid differentiation, we determined whether methylation peaks were shared among the cell types or whether the peaks were unique to each of the three cell types. Seven categories of DNA methylation peaks based on presence in one or more cell types are shown in Figure 2. The largest category of DNA methylation peaks, composing nearly 40% of all peaks, were unique to HSCs. Methylation peaks common to all three cell types were the next largest category, representing 28% of all methylation peaks. The third largest category was peaks present in HSCs and CMPs, but absent in ERYs (progenitor ∼27%). Approximately 3% of the total methylation peaks were unique to either ERYs or CMPs, and an even smaller fraction of peaks (0.3%) were absent in HSCs but present in the more differentiated cell types (myeloid). Figure 3A demonstrates examples of HSCs and progenitor-specific methylation peaks upstream of the important hematopoietic transcription factor gene Gata2. An example of an ERY-specific peak in the Meis1 locus is shown in Figure 3B. Overall, the distribution of peaks within each of the cell types demonstrates a progressive global decrease in methylation during differentiation with little acquisition of new methylation peaks during the later stages of differentiation.
Figure 2.
Analysis of peak sharing between cell populations. (A) Venn diagram illustrating the degree of overlap in methylation peaks between cell populations. (B) Total peak count for each cell population, the number of peaks shared between each cell type, and the percentage that each category contributes to the total number. Progenitor peaks are defined as present in HSCs and CMPs but absent in ERYs. Myeloid peaks are absent in HSCs but present in CMPs and ERYs. (Other) Peaks that were absent in the CMP but present in HSCs and ERYs.
Figure 3.
MBD-seq peaks at selected loci. UCSC Genome Browser view of the Gata2 locus on Chr6 (A) and the Meis1 locus on Chr11 (B). Raw sequencing data for each cell population: blue (HSC), orange (CMP), and red (ERY), with significant peaks shown as black bars below each sample. The y-axis indicates peak height, defined by the maximum number of sequencing tags seen in the highest visible peak in each window. Transcription factor consensus sites (TRANSFAC IDs) are indicated above the MBD-seq data in regions of significant peaks. The gene structure is indicated below the MBD-seq data with CpG islands shown in green. Bisulfite sequencing data confirming the cell-type-specific methylation are shown below. (Black circles) Methylated CpG sites; (open circles) unmethylated CpG sites. Each horizontal line indicates a unique clone.
DNA methylation is overrepresented in the coding portion of the genome
We next investigated the genomic distribution of methylation peaks. The genome was divided into five partitions defined by RefSeq genes. The proximal promoter was defined as sequences 1 kb upstream of the transcription start site (TSS) through the first 50 bp past the transcriptional start site. Gene body methylation was defined by the RefSeq gene coordinates minus the first 50 bp past the TSS. Additionally, we looked at the 10-kb regions upstream of and downstream from gene boundaries because we expected these flanking sequences to also contain cis regulatory elements. The remainder of the genome constitutes the intergenic partition. The distribution of methylation peaks in each cell-type category was compared with the relative percentage of sequence in each partition to the total nonrepetitive portion of the genome (genomic average). Significant deviation from the expected distribution was observed for common peaks and for peaks in all multipotent categories (Table 1). An overrepresentation of methylation peaks was seen in the RefSeq portion of the genome, and methylation peaks were underrepresented in intergenic sequences. Methylation peaks were overrepresented in the downstream flanking regions and were similar to the expected percentage in both the distal promoter and 5′-flanking regions in all peak categories.
Table 1.
Distribution of methylation peaks in genomic partitions (% in partition)

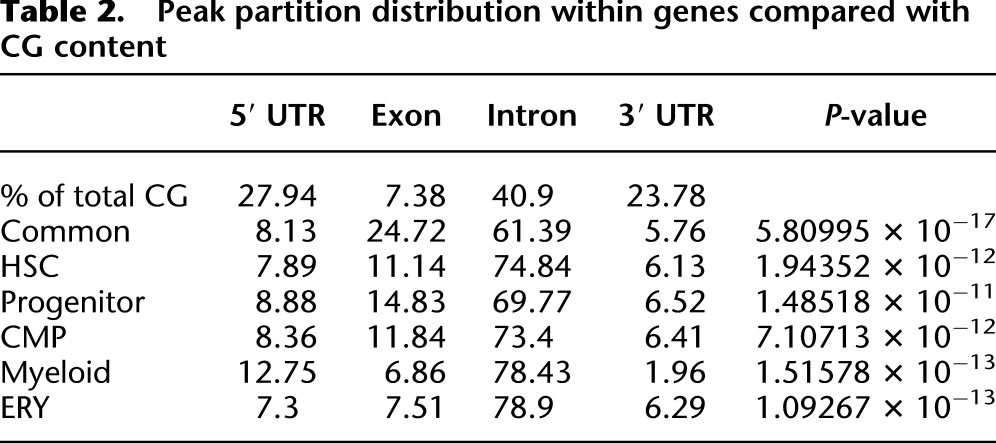
We next investigated the distribution of peaks within the RefSeq portion of the genome. The RefSeq sequences were divided into four categories: 5′-untranslated sequences (8.7%), 3′-untranslated sequences (6.8%), exons (5.3%), and introns (79.2%). Although exons represent ∼5% of the gene sequence, methylation peaks were significantly overrepresented in the exons (7%–25% of all the genic DNA methylation peaks) (Table1) and underrepresented in the introns in most categories. Since the number of potential methylation sites is variable within genic regions, we next determined the relative contribution of CpG dinucleotides in each partition and compared this with peak distributions. Table 2 demonstrates that MBD-seq peak density does not follow CpG distribution, because methylation peaks exceed the relative contribution of CG in both exons and introns, while methylation peaks are found at less than the expected frequency in both the 5′ and 3′ UTR compartments (Table 2).
Table 2.
Peak partition distribution within genes compared with CG content
CpG island methylation is rare in hematopoietic stem cell–specific peaks
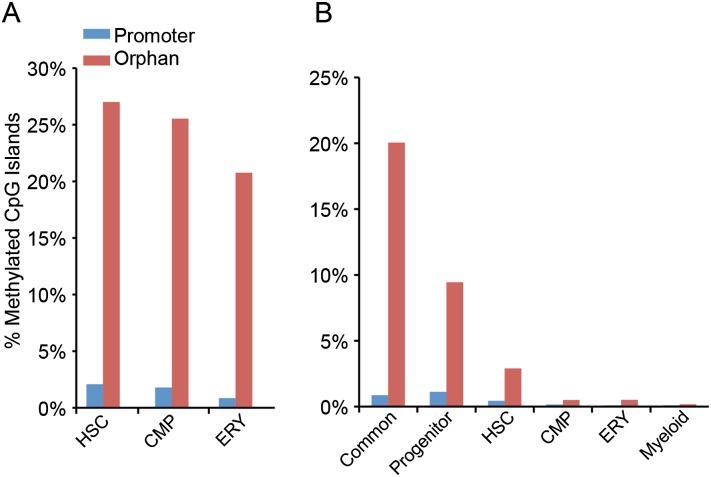
Previous studies have shown that CpG islands in characterized promoters of genes remain unmethylated in most instances, while CpG islands not associated with known promoters, orphan CpG islands, are much more likely to be methylated (Illingworth et al. 2010). Consistent with a previous report of methylated CpG islands in whole mouse blood (Illingworth et al. 2010), we found ∼2% of promoter CpG islands methylated in HSCs, and a smaller percent methylated in the more differentiated hematopoietic cell types (Fig. 4A). Orphan CpG islands were around 10-fold more likely to be methylated in each of the cell types, consistent with the greater role in tissue-specific methylation.
Figure 4.
Overlap of MBD-seq peaks with CpG islands. (A) MBD-seq peaks in the three cell types compared with the complete genomic CpG islands classified by Illingworth et al. (2010). The percent of methylated promoter CpG islands (blue) or orphan (non-promoter) CpG islands (red) is shown for each cell type. (B) Methylated promoter and orphan CpG islands in common and cell-type-specific peaks, as a percentage of total CpG islands.
Investigation of cell-type-specific methylation peaks revealed that the vast majority of all promoter CpG islands are unmethylated in all categories. Increased promoter-associated methylation observed in the progenitor category (HSCs + CMPs) compared with common and HSC-specific promoters (Fig. 4B). In contrast, the methylation of orphan CpG islands varied between peak-type categories. The largest percentage of methylated orphan CpG islands was among the common methylation peaks (20%) (Fig. 4B). Although HSC is the most methylated cell type, the percentage of HSC-specific methylation peaks in orphan CpG islands was 10-fold less than common peaks and around threefold lower than the progenitor category (Fig. 4B). These results suggest that the requirement of DNA methylation for maintenance of HSCs is not primarily due to silencing of genes via methylated CpG islands.
DNA methylation in expressed genes varies by genomic partition
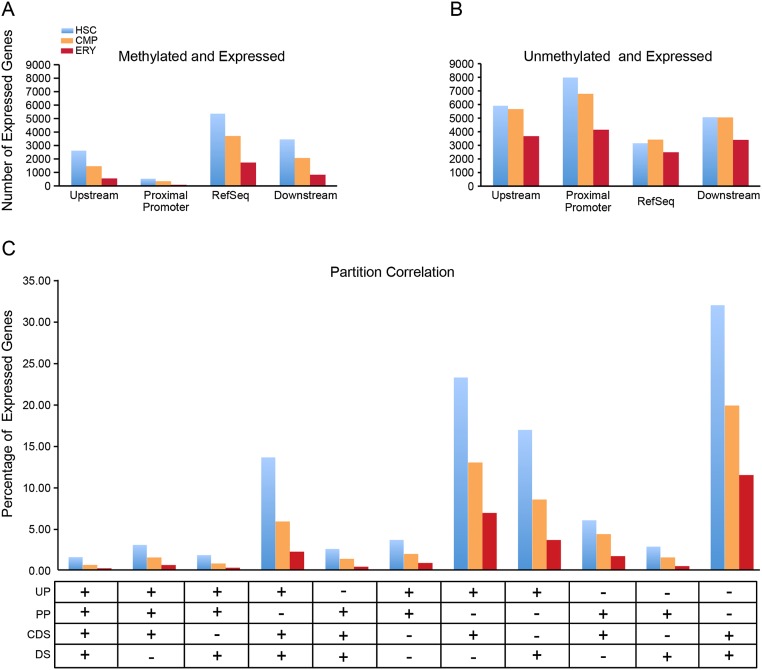
To investigate the role that DNA methylation plays in gene expression, we compared the genomic distribution of DNA methylation peaks to gene expression data obtained from BloodExpress, a database containing gene expression profiles from a large number of mouse hematopoietic cell types (Miranda-Saavedra et al. 2009). Based on gene expression profiles for mouse HSC, CMP, and ERY cell types, the greatest number of genes is expressed in the HSCs (8594), followed by CMPs (7122), and the fewest number of expressed genes are seen in ERYs (4223). Peaks assigned to the upstream 10 kb, proximal promoter, RefSeq gene boundary, and downstream 10 kb were compared in expressed genes. Consistent with the observations of Hodges et al. (2011), the majority of expressed genes lacked methylation peaks in the proximal promoter, with a similar trend seen in the more upstream 10 kb (Fig. 5A,B). In contrast, the majority of expressed genes in HSCs and CMPs contained methylation peaks within the gene body (RefSeq) (Fig. 5A). Methylation peaks were also investigated in genes that were not expressed in each cell type. Consistent with the larger absolute number of nonexpressed genes, the number of methylated nonexpressed genes exceeds the number of methylated expressed genes for each partition (Supplemental Fig. S7). While the ratio of unexpressed methylated genes to expressed methylated genes is similar between the upstream, downstream, and RefSeq partitions, this ratio is elevated in the proximal promoter for each cell type and markedly elevated in ERYs. These data further support the role that proximal promoter methylation plays in gene silencing.
Figure 5.
Methylation in genic partitions of expressed genes. Gene expression was obtained from the BloodExpress (Miranda-Saavedra et al. 2009) gene expression database for each cell type and compared with MBD-seq peaks. (A) The number of expressed genes (y-axis) in each cell type with methylation peaks in the distal promoter, proximal promoter, RefSeq gene body, and downstream region. (B) The number of expressed genes (y-axis) lacking methylation peaks in each of the genic partitions for each cell type. (C) Combinatorial analysis of methylation peaks occurring in all four genic partitions in expressed genes. (UP) Upstream 10 kb; (PP) proximal promoter; (CDS) RefSeq gene boundary; (DS) downstream. The presence (+) or absence (−) of methylation in the indicated partition is shown below the x-axis. The y-axis shows the percentage of expressed genes with each methylation pattern.
On average, genes had multiple methylation peaks, with the RefSeq partition specifically averaging 3.75 peaks per gene in HSCs, 2.7 peaks in CMPs, and 2.1 peaks in ERYs. We investigated the association of methylation peaks in multiple genomic partitions simultaneously to ascertain if specific patterns were associated with positive gene expression. Figure 5C shows the percentage of expressed genes with methylation peaks in two or more of the four partitions: upstream 10 kb (UP), proximal promoter (PP), RefSeq gene boundaries (CDS), and 10 kb downstream (DS). Consistent with the single partition analysis, expressed genes are unlikely to have methylation in the proximal promoter in combination with any other genomic region. Of the two-partition correlations, methylation most frequently occurred together in the gene bodies (CDS) and the 10 kb downstream (DS) partitions, in each of the cell types, with the minimal two-partition correlation occurring in the proximal promoter and the downstream partitions (Fig. 5C). Further analysis of genes with methylation in three or more partitions revealed that 10-fold more expressed genes had methylation in the gene body and flanking regions than in all four partitions in each of the three cell types. Therefore, while proximal promoter methylation is rare in expressed genes, methylation in the gene body and flanking regions outside of the proximal promoter occurs often in expressed genes.
De novo motif discovery reveals differentially methylated transcription factor binding site signatures of hematopoietic differentiation
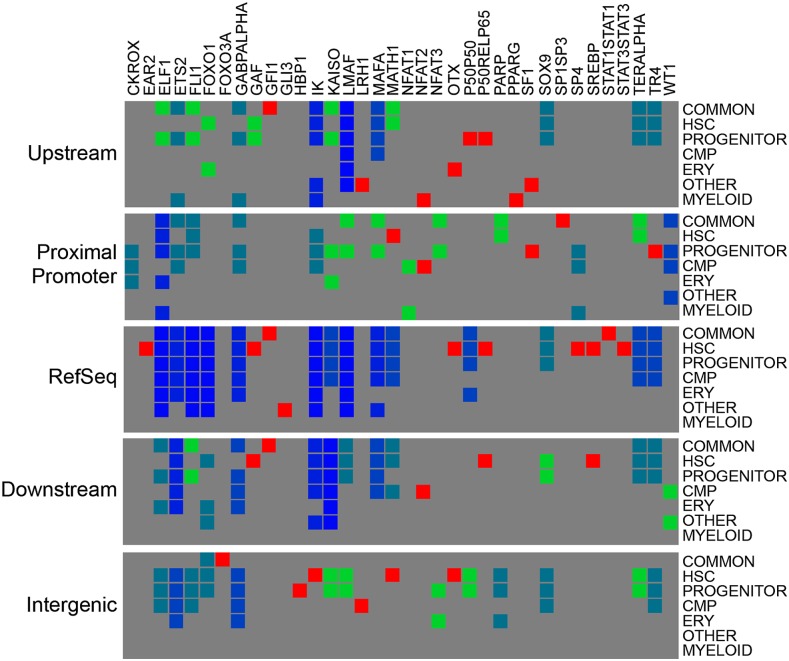
To elucidate developmental programs potentially modified by the presence of DNA methylation, we investigated the sequences underneath the methylation peaks for recurring motifs. De novo motif discovery was performed on all data sets and genomic partitions independently. The top 25 overrepresented motifs were queried against the TRANSFAC (Matys et al. 2006) transcription factor database, and transcription factors with characterized binding sites were identified. Figure 6 contains a summary of the transcription factors with overrepresented motifs occurring at sites of DNA methylation within the five genomic partitions (identified on the left) in each peak category (shown on the right). The heatmap highlights transcription factors that occur in only one peak category (red) such as MATH1 in HSC proximal promoter peaks, two categories (green), three categories (teal), and transcription factors that are overrepresented in almost all data sets (dark blue) such as GABPA.
Figure 6.
Heatmap of overrepresented methylated transcription factor binding motifs. The top 25 overrepresented sequence motifs for each peak category and each genomic partition are compiled into a heatmap. (Top) Transcription factors (TRANSFAC IDs) with confirmed consensus sequences. (Right) Each genomic partition with cell-type categories. (Red boxes) Transcription factor binding sites that are unique to one cell-type peak in a particular partition. Green boxes are present in two cell-type categories, teal boxes represent three categories, and blue boxes indicate presence in three or more cell-type specific categories. Gray indicates that the transcription factor is not overrepresented in the data set.
Comparison of the overrepresented transcription factor binding sites revealed that >10% of all overrepresented motifs corresponded to ETS transcription factors. Although the ETS transcription factor (ELF1, ETS2, FLI1, and GABPA) binding sites were overrepresented in all five genomic partitions, the distribution within cell-type-specific categories was quite different. Common methylation peaks had overrepresentation of all ETS factors in all partitions except in the intergenic partition. In contrast, HSC-unique peaks lacked overrepresentation of GABPA in the promoter and flanking partitions but exhibited overrepresentation of multiple ETS sites within the intergenic partition. These complementary patterns of transcription factor motifs suggest that DNA methylation may modulate ETS transcription factor occupancy during hematopoietic development.
Other transcription factor motifs such as the NFAT (nuclear factor of activated T-cells) were highly specific to single partitions or cell types. The NFAT1-binding site is overrepresented in CMP-unique methylation and myeloid-specific peaks located in the proximal promoter. The NFAT2 motif is overrepresented in CMP-unique methylation peaks located in the proximal promoter and downstream regions, and in the distal promoter of myeloid peaks. In contrast, the NFAT3 motif is overrepresented in common and progenitor methylation peaks located in the proximal promoter. The striking difference between overrepresented motifs in cell-type-specific methylation profiles demonstrates that hematopoietic lineages contain unique signatures of methylation patterns that may regulate changes that occur during differentiation.
Minimal genome-wide co-occupancy of hematopoietic transcription factors with DNA methylation peaks
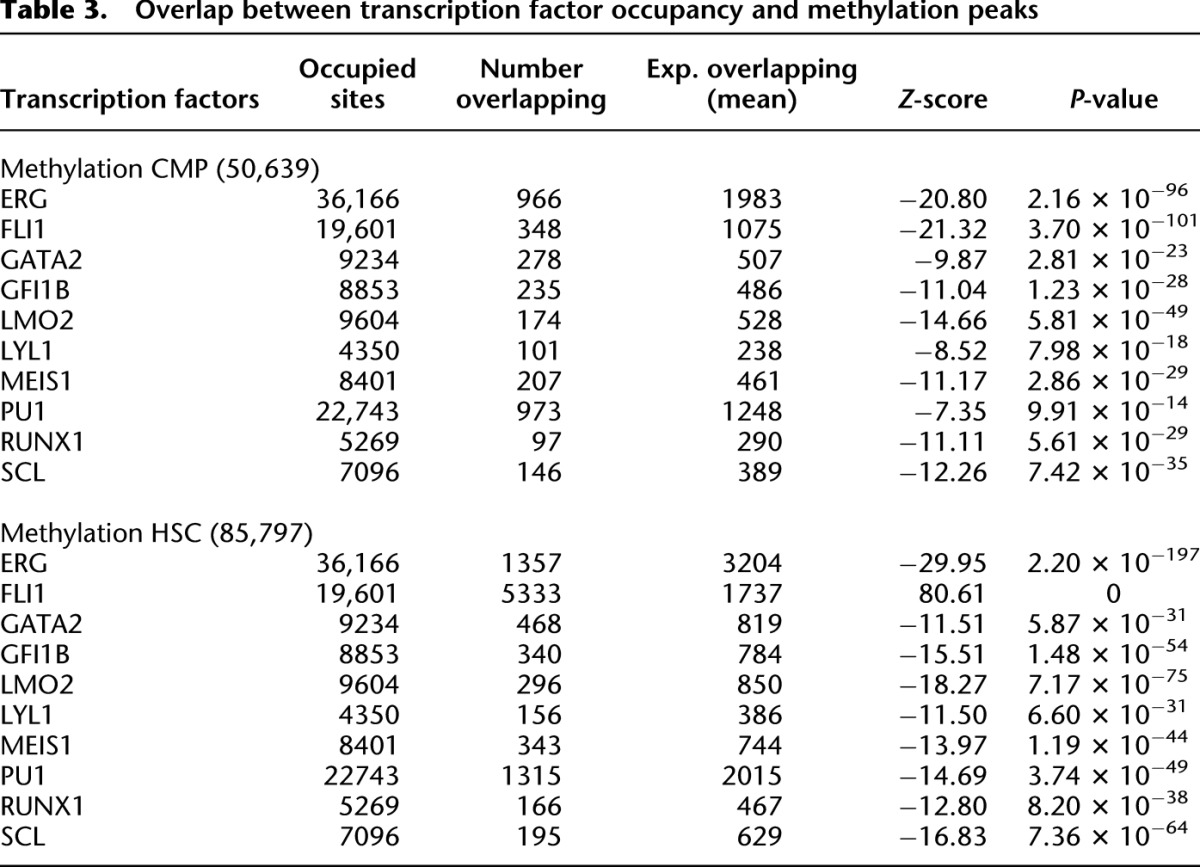
To assess the relationship between genome-wide DNA methylation and transcription factor binding, we compared our methylation data with genome-wide occupancy data for a set of 10 key hematopoietic transcription factors (Wilson et al. 2010). Transcription factor binding in Wilson et al. was ascertained in the immortalized HPC-7 mouse hematopoietic cell line, a multipotent cell that can be differentiated into various myeloid lineages (Pinto do Ó et al. 1998). Overlap between transcription factor peaks and MBD-seq peaks in CMPs and HSCs are shown in Table 3. The genomic coverage of each transcription factor data set and methylation peak data set was used to generate random data sets to calculate the expected genomic overlaps based on chance. A significant underrepresentation of overlap between transcription factor sites and methylation peaks occurred in both CMPs and HSCs (Table 3). The only transcription factor with significant co-occurrence with methylation was FLI1 in HSC methylation peaks. Of the 10 key hematopoietic transcription factors included in the study by Wilson et al. (2010), FLI1 is the only factor with an annotated consensus site that was overrepresented in our DNA methylation peaks.
Table 3.
Overlap between transcription factor occupancy and methylation peaks
Chromatin immunoprecipitation of FLI1 and ELF1 reveals co-occupancy of transcription factors and methylation
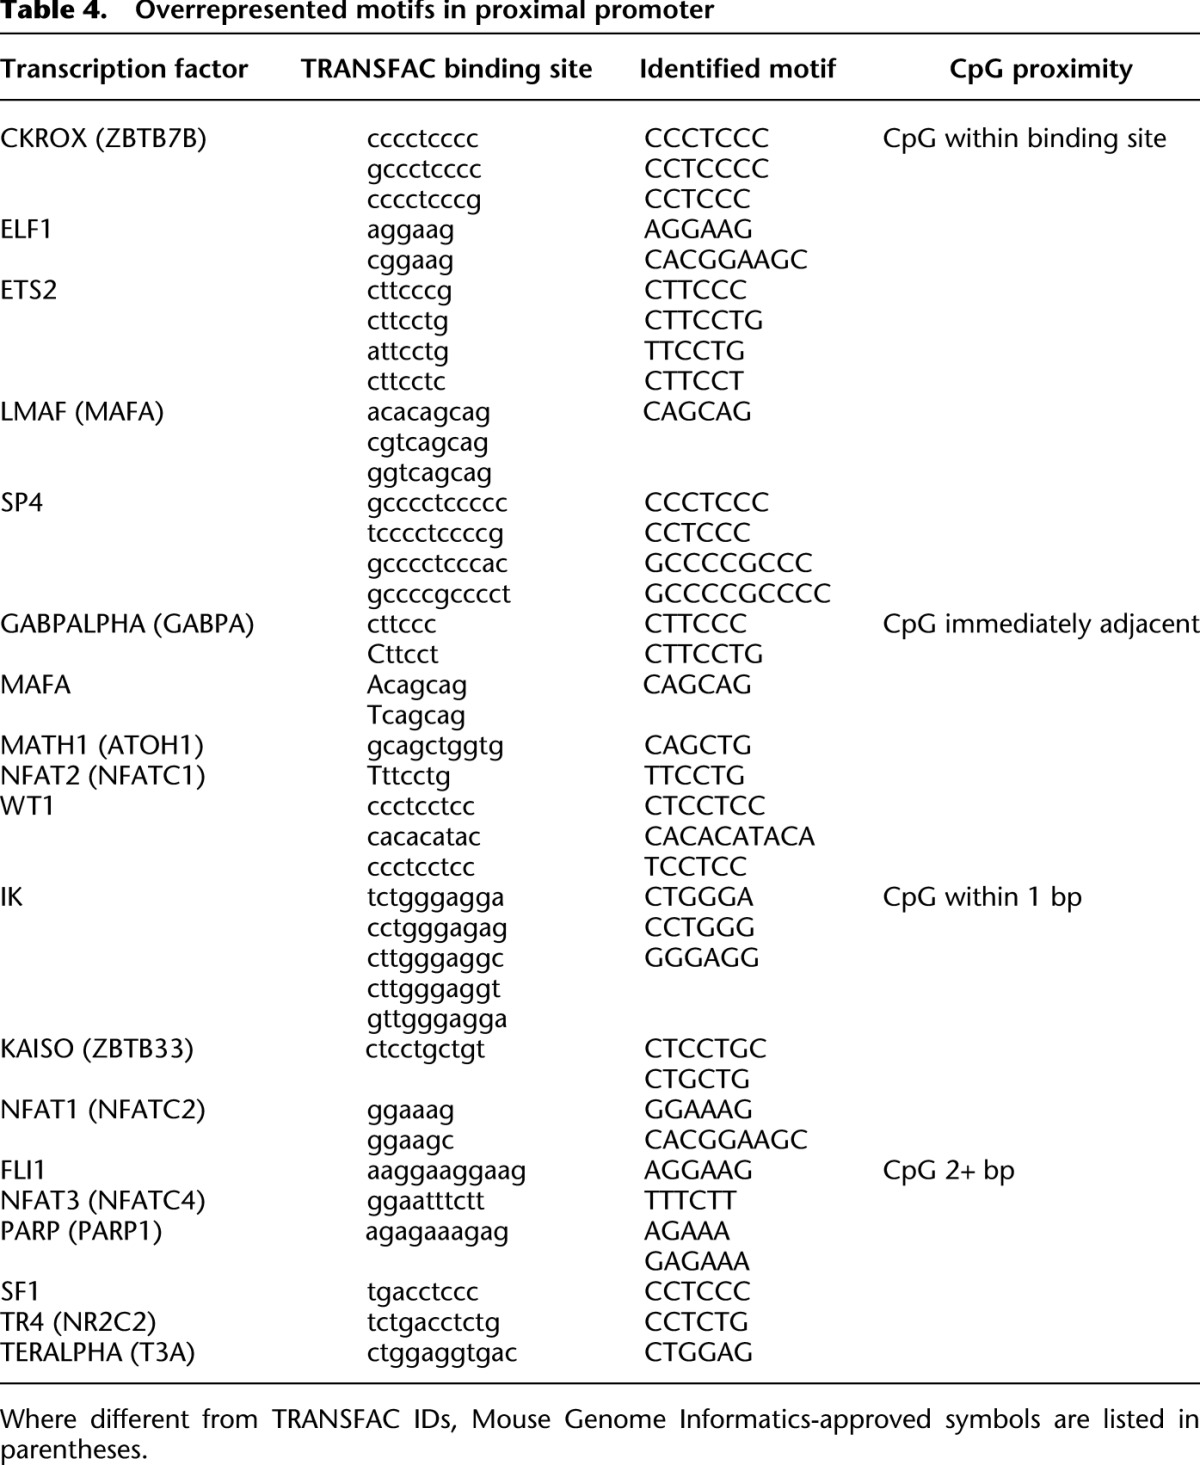
To further investigate the relationship between DNA methylation and transcription factor binding, we next identified the presence of CpG sites in the overrepresented transcription factor motifs. Table 4 contains a list of all transcription factors with known binding sites that were overrepresented in our analysis of the proximal promoter partition. Of the 19 transcription factor motifs associated with sequences overrepresented in methylated proximal promoters, five contained CpG sites within the consensus recognition sequence, and five contained a CpG dinucleotide immediately adjacent to the binding sequence. Many consensus binding sites in our data set lack CpG sites; therefore, it is unclear if methylation directly impacts binding of the transcription factors.
Table 4.
Overrepresented motifs in proximal promoter
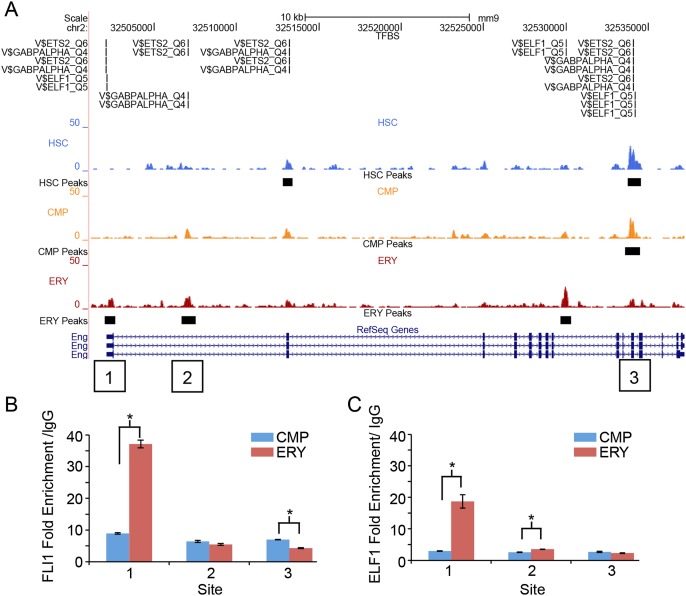
To test the hypothesis that differential methylation directly impacts the binding of transcription factors revealed by our de novo motif discovery, we performed chromatin immunoprecipitation of the ETS factors ELF1 and FLI1. Methylation peaks primarily localized to promoter regions of 10 distinct genes, as well as several genic peaks were selected for validation. ELF1 and FLI1 occupancy was compared in these regions of differential methylation in chromatin from CMPs and ERYs. Figure 7A shows the data for the endoglin (Eng) locus, where several conserved functional elements have been identified (Pimanda et al. 2006, 2008). Consistent with promoter methylation corresponding to gene silencing, this gene is unmethylated and expressed in CMPs, and uniquely methylated and silenced in ERYs, as determined by BloodExpress (Miranda-Saavedra et al. 2009). Although silenced, significantly increased enrichment of both FLI1 and ELF1 was observed in the ERY promoter methylation peak (Fig. 7B,C). Significant differences in binding between differentially methylated sites were observed in two intronic peaks of Eng. The methylation peak in the first intron (site 2) does not overlap a functional conserved element, while the methylation peak in intron 11 (site 3) corresponds to a conserved element that has not been assayed for function. In both cases, the more methylated site was occupied by FLI1 and ELF1 (Fig. 7B,C). Overall, we found that four of six regions with statistically significant differences in transcription factor occupancy showed increased binding in the methylated cell type, while two of six regions had significantly more binding in the less methylated cell type (Fig. 7B,C; Supplemental Fig. S8). We conclude that methylation does not prevent the binding of ELF1 or FLI1.
Figure 7.
FLI1 and ELF1 occupancy of methylation peaks in the Eng gene. (A) UCSC Genome Browser view of the Eng locus on chromosome 2. Transcription factor consensus sites (TRANSFAC IDs) are indicated above the MBD-seq data in regions of significant peaks. QPCR data verifying enriched ChIP binding of FLI1 (B) and ELF1 (C) at three sites of methylation peaks throughout Eng. Site 1, an ERY-specific peak, is within the proximal promoter; site 2, an ERY-specific intronic peak; and site 3, a progenitor (HSC and CMP) peak in the 3′ coding region. Comparison of binding in CMPs and ERYs revealed statistically significant differences of P = 0.004 (site 1, FLI1), P = 0.009 (site 1, ELF1), P = 0.021 (site 2, ELF1), and P = 0.012 (site 3, FLI1).
Discussion
The widespread use of massively parallel sequencing approaches has led to breakthroughs in genomics, especially in the area of epigenetic control of gene regulation. A variety of approaches have been developed to map DNA methylation including whole-genome bisulfite sequencing (MethylC-seq), reduced representation bisulfite sequencing (RRBS), and the enrichment-based sequencing methods MeDIP-seq and MBD-seq. MethylC-seq requires more sequencing reads (50×) than enrichment approaches to yield a comparable level of genome coverage, but provides single-nucleotide resolution (Harris et al. 2010). Reduced representation bisulfite sequencing provides an alternative to whole-genome bisulfite sequencing; however, it provides high-resolution data for only a limited portion of the genome (Meissner et al. 2005). The enrichment approaches detect methylated DNA fragments genome-wide and assume methylation of nearby CpG sites. Comprehensive comparison of the genome-wide method of MethylC-seq to the MBD-seq and MeDIP-seq enrichment methods revealed a >97% concordance rate for methylation calls throughout the genome (Harris et al. 2010). We conclude that the MBD-seq is an accurate and cost-effective approach to survey genome-wide DNA methylation in small numbers of primary cells. In this study, we used MBD-seq combined with peak calling algorithms to describe DNA methylation. Direct comparison of our MBD-seq data with the reduced representation bisulfite sequencing (RRBS) data in primary mouse erythroblasts demonstrated that our MBD-seq peaks are biased toward genomic regions with >30%–40% CpG methylation (Supplemental Fig. S6).
In mouse hematopoietic cells, we found 2%–3% methylated promoter CpG islands in all cell types, consistent with MBD-seq and MeDIP-seq studies in other mouse and human tissues (Weber et al. 2007; Illingworth et al. 2010). Although only a few percent of promoter CpG islands are methylated, CpG islands within genes are more likely to be methylated in a tissue-specific manner (Maunakea et al. 2010), and in our study, we identified that 20% of non-promoter CpG islands were methylated in all hematopoietic cells. Differential methylation of CpG islands, both promoter and non-promoter, was less common in cell-type-specific peaks. This observation is in agreement with the study recently published by Deaton et al. (2011) in which differential methylation of CpG islands between differentiated lymphoid cells was much less profound than the differences observed between lymphoid cells and brain cells. Our results are consistent with the hypothesis that differential methylation at CpG islands is more important for early stages of lineage specification than for final cell fate determination.
A comparison of DNA methylation in pluripotent embryonic stem cells and lineage-committed cells has demonstrated a positive association between global DNA methylation levels and the ability to differentiate into multiple cell types (Lister et al. 2009; Laurent et al. 2010). Similar to what we have observed in hematopoietic stem cells, studies of embryonic stem cells have shown that methylation is not restricted to transcriptional repression, because many expressed genes in stem cells contain DNA methylation within the gene body (Lister et al. 2009; Laurent et al. 2010). Additionally, the correlation between DNA methylation and the repressive histone modification H3K27me3 is not observed in pluripotent embryonic stem cells (Laurent et al. 2010). These findings suggest that DNA methylation in stem cells is not directly involved in inactivation of genes, but may instead be a mark enabling genomic plasticity. Our genome-wide survey of DNA methylation demonstrating high levels of methylation in the multipotent hematopoietic stem cell with progressive loss of methylation during erythroid specification supports the positive role for DNA methylation in cellular plasticity.
DNA methylation dramatically decreases as differentiation proceeds from hematopoietic stem cells to lineage-restricted common myeloid progenitor cells and the terminally committed erythroblast. These data are consistent with the observations of Shearstone et al. (2011), who have also demonstrated global demethylation in terminally differentiating erythroid cells. These genome-wide profiles complement several other recent high-throughput surveys of DNA methylation in primary lymphoid (B- and T-) cells (Ji et al. 2010; Deaton et al. 2011; Shearstone et al. 2011). Ji et al. (2010) used an array-based method to investigate methylation at ∼4.6 million CpG sites in eight distinct hematopoietic cell types including HSC/multipotent progenitor cells, CMPs, lymphoid progenitors, and differentiated T-cells. In contrast to the decreasing global DNA methylation we observed in differentiating myeloid and erythroid cells, both Ji et al. (2010) and Deaton et al. (2011) found little difference in the methylation of primitive and mature lymphoid cells. We conclude that methylation alterations play a much larger role in the differentiation of myeloid and erythroid cells than in the differentiation of lymphocytes. This conclusion is supported by the observation that mice deficient in Dnmt1 have increased production of myeloid and erythroid cells (Broske et al. 2009; Trowbridge et al. 2009).
We observed that regions of DNA methylation were overrepresented for ETS transcription factor binding sites and that there was less than expected overlap between methylation peaks and transcription factor occupancy. The ETS transcription factors are required for both the maintenance of hematopoietic stem cells and for myeloid development (Yang et al. 2011; Yu et al. 2011). While typically viewed as activators of transcription, several recent studies have characterized repressive functions of ETS factors (Dryden et al. 2012; Lee et al. 2012), suggesting that modulation of the binding of these factors may have complex effects on gene expression. Our negative correlation between methylation peaks and global transcription factor binding suggests that methylation negatively impacts the binding of these transcription factors. Alternatively, the lack of co-occurrence of methylation and transcription factor occupancy could be a consequence of transcription factors binding primarily in methylation-deficient regions such as promoters. Our chromatin immunoprecipitation analysis of FLI1 and ELF1 binding in promoters of multiple genes with differential methylation peaks in CMPs and ERYs demonstrated that the more methylated cell type often exhibited significantly enriched binding, which indicates that neither interpretation is entirely correct. Since our methylation peaks span regions of several hundred base pairs, we do not know whether the exact nucleotides bound by transcription factors are methylated. Despite these limitations, we conclude that methylated regions may be important for differential regulation of genes by transcription factors.
While genomic methylation is most reduced in erythroblasts, some functionally important sites of methylation are retained, including the imprinted loci Snrpn (Supplemental Fig. S2) and H19 (Shearstone et al. 2011). Binding sites for transcription factors such as CKROX, a factor important for specification of CD4 T-cells (Sun et al. 2005), and the ETS transcription factor ELF1 were overrepresented in the relatively rare erythroblast-unique methylation peaks. We studied two genes that are silenced in erythroid cells, Meis1 and Eng, which have erythroid-specific methylation peaks that contain consensus sites for ELF1, and both of these sites are bound by ELF1 in erythroblasts. Although ELF1 has not yet been reported to function as a transcriptional repressor, the redundant binding of ETS factors (Hollenhorst et al. 2007; Okada et al. 2011) combined with the recent descriptions of repressive functions of related ETS factors leads us to hypothesize that ETS factors may silence critical genes for proper erythroid development.
In summary, we provide a comprehensive whole-genome map of DNA methylation that can be easily integrated with other occupancy data. The sequences subject to differential methylation during myeloid development lead us to suggest that DNA methylation may offer an additional layer of modulation of key hematopoietic transcription factors. This study provides insight into the interplay between DNA methylation and transcriptional networks that are involved in hematopoietic differentiation.
Methods
Enrichment of primary mouse cells
Hematopoietic stem cells and common myeloid progenitor cells were harvested from adult female C57BL/6 bone marrow. After lysis of red cells in ACK lysing buffer (BioWhittaker), ∼109 cells were subjected to lineage depletion using the following rat anti-mouse antibodies: CD8a, CD4, CD11b, Ly-6G/Ly-6C, CD45R, and Ter119 (BD Biosciences). Lineage depletion was performed as previously described (Nemeth et al. 2003). Lineage-negative cells (lin−) were stained with PE anti-mouse Sca1(clone D7) and APC anti-mouse CD117 (clone 2B8; BD biosciences). Lin− Sca-1+ c-kit+ (HSC; 1%–2% of lineage depleted cells) and lin− Sca-1− c-kit+ (CMP; 10% of lineage depleted cells) were sorted on a BD FACS Aria instrument. Images from a representative sort are shown in Supplemental Figure S1. Cells from five sorts (HSC) and two sorts (CMP) were combined to generate sufficient cells (∼1 × 10⁶ to 2 × 10⁶) for analysis. Erythroblasts were obtained from C57BL/6 d 13.5 embryonic fetal livers disrupted into a single-cell suspension with a 21-gauge needle and stained with APC anti-mouse Ter119 and FITC anti-mouse CD71 antibodies (BD Biosciences). The cells were sorted into the five populations described by Zhang et al. (2003). Cytospins were stained with May-Grunwald Giemsa to demonstrate that the R3 population (CD71+ Ter119+) contained late basophilic erythroblasts (Supplemental Fig. S1).
MBD2 enrichment of methylated DNA
Genomic DNA was isolated from enriched cells with the QIAGEN Puregene kit and sonicated to 200- to 400-bp fragments. MBD2 enrichment was performed with the Active Motif MethylCollector kit. Approximately 1 μg of sonicated genomic DNA was incubated with MBD2-His-conjugated protein and magnetic beads according to the manufacturer's protocol. Between four and eight MBD2-genomic DNA reactions for each biological replicate were purified simultaneously and pooled post-enrichment. After enrichment, both the methylated fraction and supernatant fractions were purified with QIAGEN DNA purification columns. Quantitative PCR amplification of the differentially methylated regions regulating the imprinting of Snrpn and Rasgrf1 and the unmethylated CpG island promoter of Actb was performed with SYBR Green PCR master mix (Applied Biosystems), and was used to validate the enrichment of methylated DNA using the MBD2-pull-down approach (Supplemental Fig. S3).
Bisulfite sequencing validation
Genomic DNA from HSCs, CMPs, and ERYs was bisulfite-converted with the EZ DNA Methylation-Direct kit (Zymo Research). Briefly, 500 ng of DNA was converted according to a standard protocol. The converted DNA was PCR-amplified with bisulfite primers designed using MethPrimer (Li and Dahiya 2002). The primer sequences are listed in Supplemental Table S5. PCR-amplified bisulfite products were cloned using the TOPO TA Cloning kit (Invitrogen) and sequenced. Bisulfite sequences were analyzed with the Quantification Tool for Methylation Analysis (Kumaki et al. 2008).
Next-generation sequencing of MBD2-enriched genomic DNA
Two biological replicates of each enriched cell population and one supernatant sample per cell type were submitted for high-throughput sequencing analysis. Between 225 and 540 ng of MBD2-enriched DNA and 1 μg of supernatant for each cell type were used to construct DNA libraries according to the Illumina protocol. The libraries were sequenced on the Illumina Genome Analyzer platform, and 36-bp single-end reads were used to uniquely identify the MBD2-bound fraction of the mouse genome.
Mapping and peak calling for MBD2 enrichment
Sequenced reads were mapped to the mouse genome (UCSC assembly mm9, NCBI build 37) using the ELAND (AJ Cox, unpubl.) short-read alignment program. Peaks for each cell type were called using MACS (Zhang et al. 2008) with a P-value threshold of P < 10−5. Sequenced reads from the matched supernatant were used as a control for each cell type. When MACS was unable to build a model for a given treatment/control pair, the model restrictions were lowered to compensate. Peak calls made on replicates were post-processed to generate a confident set. Replicate peaks that overlapped by >200 bp were considered for further analysis; at this cutoff the majority of overlaps were retained (Supplemental Fig. S2).
The final sets of peaks were partitioned according to the genomic segments they occupy based on the RefSeq gene coordinate map available for the mm9 genome build. Since DNA methylation peak lengths average 800 bp (Supplemental Table S2), peaks often span intron and exon segment boundaries. To assess the distribution of DNA methylation within the context of more discrete sequences within genes, the mean value of a peak range was used to assign it to a partition.
In silico gene expression analysis
Gene expression was determined using the BloodExpress database (Miranda-Saavedra et al. 2009). Briefly, data sets representing cells obtained from similar purification strategies were selected and compiled for each cell type. HSC gene expression represented the union of the LT-HSC, ST-HSC, and MPP data sets from multiple gene expression studies (Akashi et al. 2003; Chambers et al. 2007; Mansson et al. 2007; Ficara et al. 2008). CMP gene expression represents the compilation of similarly purified c-kit+, sca1− progenitor expressed genes (Akashi et al. 2003; Jankovic et al. 2007) and ERY gene expression was determined based from Ter119+ normoblasts (Chambers et al. 2007). Full details of the cells used in the BloodExpress database are available from http://hscl.cimr.cam.ac.uk/bloodexpress/.
Motif discovery
The complete set of putative binding sites of length 5–10 were enumerated using the WordSeeker approach (Lichtenberg et al. 2010). Each site was evaluated for its overrepresentation in regard to its sequence coverage using Markov chain background models (Lichtenberg et al. 2009) of varying order, ranging from 0 to the maximum allowed order for a given binding site length (maximum order = site length − 2).
The set of enumerated and scored binding sites was sorted in decreasing order based on the overrepresentation score and filtered according to a word factor–based maximization [a site y is discarded if it is completely contained in a site x of equal or longer length and larger overrepresentation: x > y if x = uyv and score(x) > score(y), with u and v being non-empty factors themselves]. The top 25 putative binding sites were retained for further analysis.
The set of predicted binding sites was compared with the set of known transcription factor binding sites annotated in TRANSFAC (Matys et al. 2006). Overlaps between predicted and known binding sites were corrected for overlap to ensure that the TRANSFAC sites colocalized to the predicted sites in the input sequences.
Signature generation
For each known and putatively involved transcription factor, the number of input data sets in which it occurs was computed. Using the matrix2png application (Pavlidis and Noble 2003), a heatmap was created correlating each of the transcription factors with the input data sets characterizing the different stages of differentiation. The temperature of each match is annotated as the number of data sets that share the transcription factor involvement to allow highlighting of unique combinations.
Occupation-methylation correlation analysis
ChIP-seq localization data obtained by Wilson et al. (2010) were overlapped with the methylation peaks. Random peaks of equal cardinality and size were generated and used to quantify the overlap expected by chance. Based on 1000 bootstrapping iterations, the tabulated expected average overlap and standard deviation were computed. In congruence with the observed overlap, Z-scores were inferred and subsequently used to compute P-values using the R toolkit (Ihaka and Gentleman 1996).
Chromatin immunoprecipitation
Primary mouse CMP and ERY cells were sorted as described above and fixed with 1% formaldehyde for 10 min at room temperature. Fixation was quenched with 0.125 M glycine for 10 min at room temperature. Cells were washed twice in 1× PBS containing protease inhibitor and frozen at −80°C. Chromatin immunoprecipitation was performed using the Magna ChIP A/G kit (Millipore). Briefly, cells were lysed and sonicated to 200- to 400-bp fragments; 1 × 10⁶ cells were used for each IP. Antibodies for FLI1 (rabbit polyclonal, Abcam) and ELF1 (C-20) (rabbit polyclonal; Santa Cruz Biotechnology) were used for immunoprecipitation according to the Magna ChIP A/G kit protocol. Rabbit IgG was used as a negative control, and enrichment was determined by quantitative PCR as described above. A list of all of the ChIP primers used is available in Supplemental Table 6. All reactions were performed in duplicate, and IgG pull-down was used for normalization with the ΔCT method. Significant differences in occupancy between cell types was determined by a Student's t-test.
Data access
The data have been submitted to the NCBI Gene Expression Omnibus (GEO) (http://www.ncbi.nlm.nih.gov/geo/) under accession no. GSE38354 and are also available on our website at http://tracks.msseeker.org.
Acknowledgments
This work was funded from NHGRI intramural funds. A.H. is funded by the National Institute of General Medical Sciences Pharmacology Research Associate Training Program. We thank Dr. Ross Hardison for critical evaluation of this manuscript. We also thank the NHGRI Embryonic Stem Cell and Transgenic Mouse Core Facility for animal resources.
Footnotes
[Supplemental material is available for this article.]
Article published online before print. Article, supplemental material, and publication date are at http://www.genome.org/cgi/doi/10.1101/gr.132878.111.
References
- Akashi K, He X, Chen J, Iwasaki H, Niu C, Steenhard B, Zhang J, Haug J, Li L 2003. Transcriptional accessibility for genes of multiple tissues and hematopoietic lineages is hierarchically controlled during early hematopoiesis. Blood 101: 383–389 [DOI] [PubMed] [Google Scholar]
- Bogdanovic O, Veenstra GJ 2009. DNA methylation and methyl-CpG binding proteins: Developmental requirements and function. Chromosoma 118: 549–565 [DOI] [PMC free article] [PubMed] [Google Scholar]
- Broske AM, Vockentanz L, Kharazi S, Huska MR, Mancini E, Scheller M, Kuhl C, Enns A, Prinz M, Jaenisch R, et al. 2009. DNA methylation protects hematopoietic stem cell multipotency from myeloerythroid restriction. Nat Genet 41: 1207–1215 [DOI] [PubMed] [Google Scholar]
- Challen GA, Sun D, Jeong M, Luo M, Jelinek J, Berg JS, Bock C, Vasanthakumar A, Gu H, Xi Y, et al. 2012. Dnmt3a is essential for hematopoietic stem cell differentiation. Nat Genet 44: 23–31 [DOI] [PMC free article] [PubMed] [Google Scholar]
- Chambers SM, Boles NC, Lin KY, Tierney MP, Bowman TV, Bradfute SB, Chen AJ, Merchant AA, Sirin O, Weksberg DC, et al. 2007. Hematopoietic fingerprints: An expression database of stem cells and their progeny. Cell Stem Cell 1: 578–591 [DOI] [PMC free article] [PubMed] [Google Scholar]
- Deaton AM, Webb S, Kerr AR, Illingworth RS, Guy J, Andrews R, Bird A 2011. Cell type-specific DNA methylation at intragenic CpG islands in the immune system. Genome Res 21: 1074–1086 [DOI] [PMC free article] [PubMed] [Google Scholar]
- Dryden NH, Sperone A, Martin-Almedina S, Hannah RL, Birdsey GM, Taufiq Khan S, Layhadi JA, Mason JC, Haskard DO, Gottgens B, et al. 2012. The transcription factor Erg controls endothelial cell quiescence by repressing the activity of nuclear factor (NF)-κB p65. J Biol Chem 287: 12331–12342 [DOI] [PMC free article] [PubMed] [Google Scholar]
- Ficara F, Murphy MJ, Lin M, Cleary ML 2008. Pbx1 regulates self-renewal of long-term hematopoietic stem cells by maintaining their quiescence. Cell Stem Cell 2: 484–496 [DOI] [PMC free article] [PubMed] [Google Scholar]
- Harris RA, Wang T, Coarfa C, Nagarajan RP, Hong C, Downey SL, Johnson BE, Fouse SD, Delaney A, Zhao Y, et al. 2010. Comparison of sequencing-based methods to profile DNA methylation and identification of monoallelic epigenetic modifications. Nat Biotechnol 28: 1097–1105 [DOI] [PMC free article] [PubMed] [Google Scholar]
- Hodges E, Molaro A, Dos Santos CO, Thekkat P, Song Q, Uren PJ, Park J, Butler J, Rafii S, McCombie WR, et al. 2011. Directional DNA methylation changes and complex intermediate states accompany lineage specificity in the adult hematopoietic compartment. Mol Cell44: 17–28. [DOI] [PMC free article] [PubMed] [Google Scholar]
- Hollenhorst PC, Shah AA, Hopkins C, Graves BJ 2007. Genome-wide analyses reveal properties of redundant and specific promoter occupancy within the ETS gene family. Genes Dev 21: 1882–1894 [DOI] [PMC free article] [PubMed] [Google Scholar]
- Ihaka R, Gentleman R 1996. R: A language for data analysis and graphics. J Comput Graph Statist 5: 299–314 [Google Scholar]
- Illingworth RS, Gruenewald-Schneider U, Webb S, Kerr AR, James KD, Turner DJ, Smith C, Harrison DJ, Andrews R, Bird AP 2010. Orphan CpG islands identify numerous conserved promoters in the mammalian genome. PLoS Genet 6: e1001134 doi: 10.1371/journal.pgen.1001134 [DOI] [PMC free article] [PubMed] [Google Scholar]
- Jankovic V, Ciarrocchi A, Boccuni P, DeBlasio T, Benezra R, Nimer SD 2007. Id1 restrains myeloid commitment, maintaining the self-renewal capacity of hematopoietic stem cells. Proc Natl Acad Sci 104: 1260–1265 [DOI] [PMC free article] [PubMed] [Google Scholar]
- Ji H, Ehrlich LI, Seita J, Murakami P, Doi A, Lindau P, Lee H, Aryee MJ, Irizarry RA, Kim K, et al. 2010. Comprehensive methylome map of lineage commitment from haematopoietic progenitors. Nature 467: 338–342 [DOI] [PMC free article] [PubMed] [Google Scholar]
- Kriaucionis S, Heintz N 2009. The nuclear DNA base 5-hydroxymethylcytosine is present in Purkinje neurons and the brain. Science 324: 929–930 [DOI] [PMC free article] [PubMed] [Google Scholar]
- Kumaki Y, Oda M, Okano M 2008. QUMA: Quantification tool for methylation analysis. Nucleic Acids Res 36: W170–W175 [DOI] [PMC free article] [PubMed] [Google Scholar]
- Laget S, Joulie M, Le Masson F, Sasai N, Christians E, Pradhan S, Roberts RJ, Defossez PA 2010. The human proteins MBD5 and MBD6 associate with heterochromatin but they do not bind methylated DNA. PLoS ONE 5: e11982 doi: 10.1371/journal.pone.0011982 [DOI] [PMC free article] [PubMed] [Google Scholar]
- Laurent L, Wong E, Li G, Huynh T, Tsirigos A, Ong CT, Low HM, Kin Sung KW, Rigoutsos I, Loring J, et al. 2010. Dynamic changes in the human methylome during differentiation. Genome Res 20: 320–331 [DOI] [PMC free article] [PubMed] [Google Scholar]
- Lee CG, Kwon HK, Sahoo A, Hwang W, So JS, Hwang JS, Chae CS, Kim GC, Kim JE, So HS, et al. 2012. Interaction of Ets-1 with HDAC1 represses IL-10 expression in Th1 cells. J Immunol 188: 2244–2253 [DOI] [PubMed] [Google Scholar]
- Li LC, Dahiya R 2002. MethPrimer: Designing primers for methylation PCRs. Bioinformatics 18: 1427–1431 [DOI] [PubMed] [Google Scholar]
- Lichtenberg J, Yilmaz A, Welch JD, Kurz K, Liang X, Drews F, Ecker K, Lee SS, Geisler M, Grotewold E, et al. 2009. The word landscape of the non-coding segments of the Arabidopsis thaliana genome. BMC Genomics 10: 463 doi: 10.1186/1471-2164-10-463 [DOI] [PMC free article] [PubMed] [Google Scholar]
- Lichtenberg J, Kurz K, Liang X, Al-ouran R, Neiman L, Nau LJ, Welch JD, Jacox E, Bitterman T, Ecker K, et al. 2010. WordSeeker: Concurrent bioinformatics software for discovering genome-wide patterns and word-based genomic signatures. BMC Bioinformatics (Suppl 12) 11: S6 doi: 10.1186/1471-2105-11-S12-S6 [DOI] [PMC free article] [PubMed] [Google Scholar]
- Lister R, Pelizzola M, Dowen RH, Hawkins RD, Hon G, Tonti-Filippini J, Nery JR, Lee L, Ye Z, Ngo QM, et al. 2009. Human DNA methylomes at base resolution show widespread epigenomic differences. Nature 462: 315–322 [DOI] [PMC free article] [PubMed] [Google Scholar]
- Ma P, Lin S, Bartolomei M, Schultz R 2010. Metastasis tumor antigen 2 (MTA2) is involved in proper imprinted expression of H19 and Peg3 during mouse preimplantation development. Biol Reprod 83: 1027–1035 [DOI] [PMC free article] [PubMed] [Google Scholar]
- Mansson R, Hultquist A, Luc S, Yang L, Anderson K, Kharazi S, Al-Hashmi S, Liuba K, Thoren L, Adolfsson J, et al. 2007. Molecular evidence for hierarchical transcriptional lineage priming in fetal and adult stem cells and multipotent progenitors. Immunity 26: 407–419 [DOI] [PubMed] [Google Scholar]
- Matys V, Kel-Margoulis OV, Fricke E, Liebich I, Land S, Barre-Dirrie A, Reuter I, Chekmenev D, Krull M, Hornischer K, et al. 2006. TRANSFAC and its module TRANSCompel: Transcriptional gene regulation in eukaryotes. Nucleic Acids Res 34: D108–D110 [DOI] [PMC free article] [PubMed] [Google Scholar]
- Maunakea AK, Nagarajan RP, Bilenky M, Ballinger TJ, D'Souza C, Fouse SD, Johnson BE, Hong C, Nielsen C, Zhao Y, et al. 2010. Conserved role of intragenic DNA methylation in regulating alternative promoters. Nature 466: 253–257 [DOI] [PMC free article] [PubMed] [Google Scholar]
- Meissner A, Gnirke A, Bell GW, Ramsahoye B, Lander ES, Jaenisch R 2005. Reduced representation bisulfite sequencing for comparative high-resolution DNA methylation analysis. Nucleic Acids Res 33: 5868–5877 [DOI] [PMC free article] [PubMed] [Google Scholar]
- Miranda-Saavedra D, De S, Trotter MW, Teichmann SA, Gottgens B 2009. BloodExpress: A database of gene expression in mouse haematopoiesis. Nucleic Acids Res 37: D873–D879 [DOI] [PMC free article] [PubMed] [Google Scholar]
- Nemeth MJ, Curtis DJ, Kirby MR, Garrett-Beal LJ, Seidel NE, Cline AP, Bodine DM 2003. Hmgb3: An HMG-box family member expressed in primitive hematopoietic cells that inhibits myeloid and B-cell differentiation. Blood 102: 1298–1306 [DOI] [PubMed] [Google Scholar]
- Okada Y, Nobori H, Shimizu M, Watanabe M, Yonekura M, Nakai T, Kamikawa Y, Wakimura A, Funahashi N, Naruse H, et al. 2011. Multiple ETS family proteins regulate PF4 gene expression by binding to the same ETS binding site. PLoS ONE 6: e24837 doi: 10.1371/journal.pone.0024837 [DOI] [PMC free article] [PubMed] [Google Scholar]
- Pavlidis P, Noble WS 2003. Matrix2png: A utility for visualizing matrix data. Bioinformatics 19: 295–296 [DOI] [PubMed] [Google Scholar]
- Pimanda JE, Chan WY, Donaldson IJ, Bowen M, Green AR, Göttgens B 2006. Endoglin expression in the endothelium is regulated by Fli-1, Erg, and Elf-1 acting on the promoter and a −8-kb enhancer. Blood 107: 4737–4745 [DOI] [PubMed] [Google Scholar]
- Pimanda JE, Chan WY, Wilson NK, Smith AM, Kinston S, Knezevic K, Janes ME, Landry JR, Kolb-Kokocinski A, Frampton J, et al. 2008. Endoglin expression in blood and endothelium is differentially regulated by modular assembly of the Ets/Gata hemangioblast code. Blood 112: 4512–4522 [DOI] [PMC free article] [PubMed] [Google Scholar]
- Pinto do Ó P, Kolterud Å, Carlsson L 1998. Expression of the LIM-homeobox gene LH2 generates immortalized steel factor-dependent multipotent hematopoietic precursors. EMBO J 17: 5744–5756 [DOI] [PMC free article] [PubMed] [Google Scholar]
- Rupon JW, Wang SZ, Gaensler K, Lloyd J, Ginder GD 2006. Methyl binding domain protein 2 mediates γ-globin gene silencing in adult human βYAC transgenic mice. Proc Natl Acad Sci 103: 6617–6622 [DOI] [PMC free article] [PubMed] [Google Scholar]
- Shearstone JR, Pop R, Bock C, Boyle P, Meissner A, Socolovsky M 2011. Global DNA demethylation during mouse erythropoiesis in vivo. Science 334: 799–802 [DOI] [PMC free article] [PubMed] [Google Scholar]
- Sun G, Liu X, Mercado P, Jenkinson SR, Kypriotou M, Feigenbaum L, Galera P, Bosselut R 2005. The zinc finger protein cKrox directs CD4 lineage differentiation during intrathymic T cell positive selection. Nat Immunol 6: 373–381 [DOI] [PubMed] [Google Scholar]
- Tadokoro Y, Ema H, Okano M, Li E, Nakauchi H 2007. De novo DNA methyltransferase is essential for self-renewal, but not for differentiation, in hematopoietic stem cells. J Exp Med 204: 715–722 [DOI] [PMC free article] [PubMed] [Google Scholar]
- Tahiliani M, Koh KP, Shen Y, Pastor WA, Bandukwala H, Brudno Y, Agarwal S, Iyer LM, Liu DR, Aravind L, et al. 2009. Conversion of 5-methylcytosine to 5-hydroxymethylcytosine in mammalian DNA by MLL partner TET1. Science 324: 930–935 [DOI] [PMC free article] [PubMed] [Google Scholar]
- Trowbridge JJ, Snow JW, Kim J, Orkin SH 2009. DNA methyltransferase 1 is essential for and uniquely regulates hematopoietic stem and progenitor cells. Cell Stem Cell 5: 442–449 [DOI] [PMC free article] [PubMed] [Google Scholar]
- Weber M, Hellmann I, Stadler MB, Ramos L, Paabo S, Rebhan M, Schubeler D 2007. Distribution, silencing potential and evolutionary impact of promoter DNA methylation in the human genome. Nat Genet 39: 457–466 [DOI] [PubMed] [Google Scholar]
- Wilson NK, Foster SD, Wang X, Knezevic K, Schutte J, Kaimakis P, Chilarska PM, Kinston S, Ouwehand WH, Dzierzak E, et al. 2010. Combinatorial transcriptional control in blood stem/progenitor cells: Genome-wide analysis of ten major transcriptional regulators. Cell Stem Cell 7: 532–544 [DOI] [PubMed] [Google Scholar]
- Yang ZF, Drumea K, Cormier J, Wang J, Zhu X, Rosmarin AG 2011. GABP transcription factor is required for myeloid differentiation, in part, through its control of Gfi-1 expression. Blood 118: 2243–2253 [DOI] [PMC free article] [PubMed] [Google Scholar]
- Yu S, Cui K, Jothi R, Zhao DM, Jing X, Zhao K, Xue HH 2011. GABP controls a critical transcription regulatory module that is essential for maintenance and differentiation of hematopoietic stem/progenitor cells. Blood 117: 2166–2178 [DOI] [PMC free article] [PubMed] [Google Scholar]
- Zhang J, Socolovsky M, Gross AW, Lodish HF 2003. Role of Ras signaling in erythroid differentiation of mouse fetal liver cells: Functional analysis by a flow cytometry-based novel culture system. Blood 102: 3938–3946 [DOI] [PubMed] [Google Scholar]
- Zhang Y, Liu T, Meyer CA, Eeckhoute J, Johnson DS, Bernstein BE, Nusbaum C, Myers RM, Brown M, Li W, et al. 2008. Model-based analysis of ChIP-Seq (MACS). Genome Biol 9: R137 doi: 10.1186/gb-2008-9-9-r137 [DOI] [PMC free article] [PubMed] [Google Scholar]


