

Abstract
While exome sequencing is readily amenable to single-nucleotide variant discovery, the sparse and nonuniform nature of the exome capture reaction has hindered exome-based detection and characterization of genic copy number variation. We developed a novel method using singular value decomposition (SVD) normalization to discover rare genic copy number variants (CNVs) as well as genotype copy number polymorphic (CNP) loci with high sensitivity and specificity from exome sequencing data. We estimate the precision of our algorithm using 122 trios (366 exomes) and show that this method can be used to reliably predict (94% overall precision) both de novo and inherited rare CNVs involving three or more consecutive exons. We demonstrate that exome-based genotyping of CNPs strongly correlates with whole-genome data (median r2 = 0.91), especially for loci with fewer than eight copies, and can estimate the absolute copy number of multi-allelic genes with high accuracy (78% call level). The resulting user-friendly computational pipeline, CoNIFER (copy number inference from exome reads), can reliably be used to discover disruptive genic CNVs missed by standard approaches and should have broad application in human genetic studies of disease.
Targeted capture and sequencing of coding exons (“exome sequencing”) has revealed common single-nucleotide polymorphisms (SNPs), rare sequence variants, short indels, and breakpoints of structural variation (Ng et al. 2009; for review, see Bamshad et al. 2011) but has been largely refractory to the discovery of copy number variants (CNVs). In contrast to whole-genome sequencing data, exome capture and sequencing results in nonuniform read-depth between captured regions and strong systematic biases between batches of samples. These biases, as well as the sparse nature of the capture, make exome sequencing unsuitable for “traditional” CNV detection algorithms, such as raw read-depth (Alkan et al. 2009; Chiang et al. 2008; Yoon et al. 2009), read-pair alignment (Korbel et al. 2007, 2009; Hormozdiari et al. 2009), or split-read mapping (Ye et al. 2009; Karakoc et al. 2011). In this study, we combine read-depth data from exome sequencing with singular value decomposition (SVD) methods to discover rare CNVs and genotype known copy number polymorphic (CNP) regions from eight HapMap samples and 122 autism spectrum disorder (ASD) mother-father-proband trios sequenced as part of separate study to primarily discover de novo SNPs and indels (O'Roak et al. 2012). We validated the discovered events using orthogonal data sets, including whole-genome sequencing and tiling array comparative genomic hybridization (array-CGH) data for HapMap samples, as well as SNP array and quantitative PCR for events discovered in the autism trios. In light of the tens of thousands of exomes anticipated to be sequenced and analyzed in the near future, we believe this method will have widespread application for the discovery and association of both rare and common copy number variation in disease and will complement existing methods to discover single-nucleotide variation from exome sequencing data.
Methods
Samples and data sets
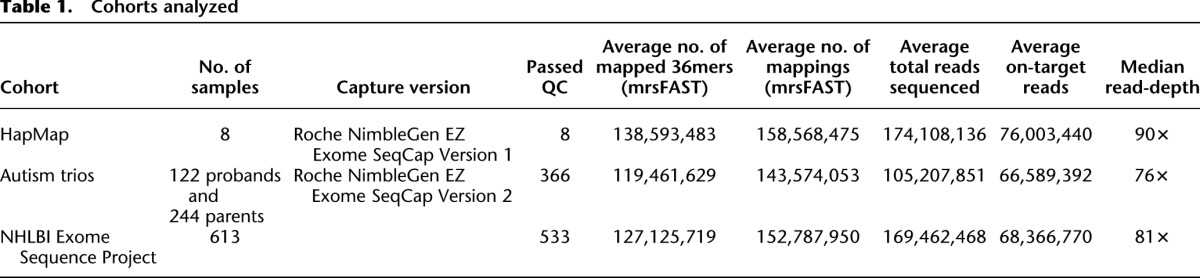
We used exome sequencing data from eight HapMap individuals (NA12878, NA15510, NA18507, NA18517, NA18555, NA18956, NA19129, and NA19240) and exomes from 122 mother-father-proband ASD trios (for 366 total individuals). In addition, we utilized exome data from 533 individuals from the NHLBI Exome Sequencing Project (ESP) as a means to derive accurate estimates of the distribution of sequence coverage at each exon. Underlying exome sequence data are available from the Short Read Archive for the HapMap exomes (SRA039053) and from the dbGaP exchange area (for ASD exomes: phs000482.v1.p1; for ESP exomes: phs000279.v1.p1, phs000290.v1.p1, phs000291.v1.p1, phs000281.v1.p1, phs000254.v1.p1, with additional cohorts pending; more information at http://evs.gs.washington.edu/EVS/). All exomes were captured using either the Roche NimbleGen EZ Exome SeqCap version 2 (for ESP samples and ASD trios) or version 1 (for HapMap samples) in-solution exome capture kits (44 Mbp captured, including 36-Mbp exon target). Short-read sequencing was performed using either an Illumina HiSeq 2000 platform or an Illumina GAII, with a mix of 50-bp and 76-bp paired-end reads (Table 1; for additional details, see Supplemental Note).
Table 1.
Cohorts analyzed
Mapping
Sequence reads were divided into nonoverlapping 36-bp constituents and mapped to exons and the 300-bp flanking sequence of the repeat-masked hg19 reference sequence using mrsFAST (Hach et al. 2010), allowing for up to two mismatches per 36 bp. We calculated RPKM (reads per thousand bases per million reads sequenced) (Mortazavi et al. 2008) values for 194,080 exome capture targets (see Supplemental Note) and excluded from further analysis 3964 probes with a median RPKM of less than one, as these probes were likely failed or improperly targeted. The median RPKM for our probes was 17.5, with a standard deviation of 22.0 and a maximum of ∼900.
Singular value decomposition
RPKM values were transformed into standardized z-scores (termed ZRPKM values) based on the mean and standard deviation across all analyzed exomes and organized into an exon-by-sample matrix (X). Using SVD, we decomposed X into three matrices:
The values in the S matrix, known as “singular values,” can be used to examine the relative amount of contributed variance from each component. We used a plot of these singular values, known as a “scree plot,” to identify this experimental noise. Our analysis reveals that the first 10–15 components disproportionally contribute to the variance of the data (Supplemental Fig. S2). Given that we expect biological variation, in the form of rare CNVs as well as common CNPs, to be a minor contributor to the overall variance of the exon-by-sample matrix X, we formulated the basis of our algorithm by eliminating these strongest components. We selected the number of components for elimination based on the inflection point of the scree plot. Algorithmically, in order to remove the strongest k components, we set S1…Sk to zero to form S′, and then recalculate X as the dot product of U, S′, and VT (Fig. 1). We termed these final values SVD-ZRPKM values—each of which represents the normalized relative copy number of an exon in a sample.
Figure 1.

Method overview and CNV discovery. Exome sequencing reads from FASTQ files were divided into nonoverlapping 36-bp constituents (A) and aligned to targeted regions (B), allowing for up to two mismatches per 36-bp alignment. (C) For each exon or targeted region, we calculated RPKM values and then transformed these into “ZRPKM” values based on the median and standard deviation of each exon across all samples. (D) ZRPKM values were inputted into the SVD transformation, where we removed the first 12–15 singular values. Finally, a centrally weighted 15-exon average was passed over the SVD-ZRPKM values in order to reduce false positives, and a ±1.5 SVD-ZRPKM threshold was used to discover CNVs. (E) Final image shows ZRPKM values from 1000 consecutive exons on chromosome 16, plotted for 533 ESP exome background samples (black traces) and NA18507 (pink trace). Blue bar corresponds to a rare duplication in NA18507 at the METTL9/OTOA locus at chr16p12.2 that was validated by SNP microarray CNV analysis.
Discovery of rare CNVs and genotyping CNPs
For discovery of rare CNVs (Fig. 1; Supplemental Fig. S1), we removed between 12 and 15 (k) singular values, a number we empirically adjusted based on the inflection point of the scree plot (Supplemental Fig. S2). We set discovery thresholds at −1.5 or +1.5 SVD-ZRPKM for rare deletions and duplications, respectively, and required at least three exome probes to exceed the threshold (Supplemental Note). For genotyping CNP regions in the genome, we opted to remove only five components in order to prevent the SVD algorithm from removing bona fide signal from highly CNP loci (Supplemental Note; Supplemental Fig. S11). The signal intensity was calculated by determining the average of the SVD-ZRPKM values for the exons/targets in the region of interest. As the output from our algorithm provides a relative value, we estimated absolute copy number from the SVD-ZRPKM values via two methods: (1) using population frequency information of copy number states (Campbell et al. 2011) and (2) creating a standard curve using a copy number estimated from whole-genome sequencing data of matched HapMap samples (Sudmant et al. 2010; Supplemental Note).
The SVD method depends on concurrently analyzing many samples, so that systematic noise becomes evident and can subsequently be removed. For the eight HapMap samples, we included an additional 533 ESP samples and removed 12 components. For analysis of the ASD trios, we combined the 122 trios (366 samples) with 366 randomly selected samples from the ESP data set and removed 15 components. In our comparison of mrsFAST and BWA mappings, we used 492 ESP samples (for which BWA mappings were available) and the eight HapMap samples. Overall variance was lower in the BWA-based mappings, thus only six components needed to be removed during the SVD normalization.
Quality control
To control for sample and probe performance, we performed two separate checks using SVD-ZRPKM values: (1) We excluded from further analysis any probe with a median RPKM across all analyzed samples ≤1, as such probes were likely failed or improperly targeted probes, and (2) we excluded samples if the standard deviation of their SVD-ZRPKM values exceeded 0.5. As both the z-transformation and the SVD algorithm are dependent on the analysis of all samples concurrently, we recomputed both the ZRPKM and SVD-ZRPKM values after having removed poorly performing samples.
Validation
We specifically selected samples that had been subjected to extensive prior experimental validation. Copy number variation of the eight HapMap samples was previously assessed by array-CGH, whole-genome shotgun sequencing, and targeted clone sequencing (Kidd et al. 2008; The 1000 Genomes Project Consortium 2010; Sudmant et al. 2010; Conrad et al. 2011). Accurate estimates of copy number for duplicated loci were determined experimentally by single-channel array-CGH data and qPCR (Sudmant et al. 2010; Campbell et al. 2011). CNV data for the 366 autism exomes were obtained by SNP Microarray (Illumina 1M) and by targeted array-CGH as described previously (Sanders et al. 2011; O'Roak et al. 2012). Additionally, we used a custom NimbleGen array-CGH chip or specific quantitative PCR assays to validate additional events discovered that were not confirmed by existing SNP or array data (for details and primers used, see Supplemental Note).
CoNIFER implementation
We implemented our algorithm as a collection of python programs under the name CoNIFER (copy number inference from exome reads), available at http://conifer.sourceforge.net. CoNIFER can accept files containing BAM alignment files or RPKM values from samples and outputs a number of charts (e.g., scree plots), a text file containing calls, and images corresponding to each call. Additionally, the raw SVD-ZRPKM values can be saved, facilitating genotyping of CNP loci and further analysis. The computational resources to run CoNIFER are lightweight. BAM-format files can be converted into read-depth files in ∼20–30 min; then given read-depth or read-count values for targeted exons or probes, the CoNIFER and the SVD-normalization can be run with minimal hardware requirements (e.g., 500 samples processed in <1 h using ≤4 GB of memory).
Results
Our method exploits differences in sequence read-depth from exome data sets to predict copy number variation (Fig. 1). We focused on characterizing two distinct classes of genetic variation: rare CNVs and CNPs. The former are individually rare in populations (<1% frequency) and are predominantly found in unique regions of the genome. In contrast, CNPs are common, both between individuals and between populations, and are frequently associated with segmental duplications (Girirajan et al. 2010). The absolute copy number of multi-allelic CNPs embedded in segmental duplications ranges widely from zero to more than 40 copies, and this variation is typically referred to as multi-copy or multi-allelic (Sudmant et al. 2010). Our approach utilizes relative read-depth values for each exon; for exons with highly diverse copy number across a population, the population standard deviation will be high as well, thus shrinking the range of relative values observed at that exon (although this does not diminish the signal itself, only the absolute values). In effect, this makes a threshold-based discovery algorithm less sensitive for CNPs and exons of high copy number diversity, but does not impact genotyping of these CNPs and exons when their location is known. Because of these fundamental differences, we chose to pursue the characterization of CNVs and CNPs differently: For CNVs, discovery within the exome data was unbiased by location, whereas for CNPs, we used a priori information regarding the location of copy number variable loci.
CNV discovery in HapMap samples
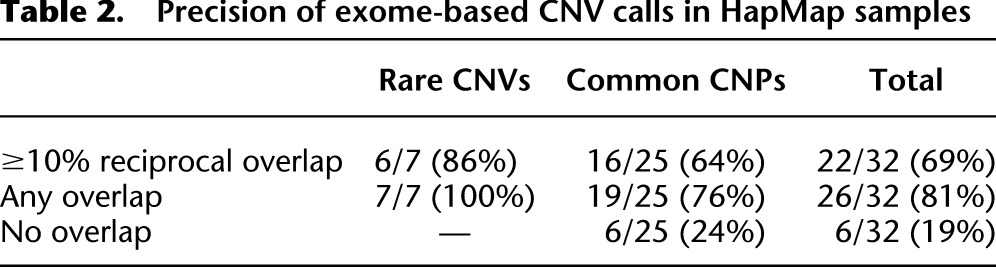
In order to assess the precision of our method, we intersected our exome-based deletion and duplication calls from five of the HapMap control exomes with a previously generated call set from high-resolution array-CGH data (Conrad et al. 2011). Of the 32 events detected by CoNIFER (Supplemental Table S1), seven were rare CNVs and 25 were CNPs; after intersecting with the reference set and requiring 10% reciprocal overlap, our method yielded 6/7 (86%) precision for rare CNVs and 16/25 (64%) for CNPs (Table 2; Supplemental Table S2). Examination of the discordant calls revealed that the one rare CNV did not pass the 10% reciprocal overlap cutoff because a single distant exome probe was included in the call, and 7/10 discordant calls were located in genes such as C4A, PGA3/4, GSTT1, and CCL3/4. For these regions, the discrepancy between our method (a reference-free approach) and the reference-based array-CGH calls is not unexpected (i.e., the “reference effect”). The last two events were duplications in HERC2P3 and PI4KAP2, both found in a highly repetitive region of the genome in which array-CGH is likely ineffective.
Table 2.
Precision of exome-based CNV calls in HapMap samples
We also estimated sensitivity for detecting CNVs using the Conrad data set: Starting with 486 high-resolution array-CGH calls that overlapped at least three exome probes, there were five rare CNVs (<1% population prevalence) in unique portions of the genome within the five overlapping samples between our data set and the samples examined by Conrad and colleagues (2011). Our algorithm identified 5/5 of these rare CNVs (Supplemental Table S2). Close examination of the remaining 481 Conrad calls reveals that three are false positives (Supplemental Fig. S7) and 20 reside in somatically rearranged regions (Supplemental Fig. S4). However, the majority of the remaining regions are either found within segmental duplications (416/481, 86%) or are polymorphic but not duplicated (i.e., zero, one, or two copies; 42/481, 8.7%) (Supplemental Table S2). For these regions, the SVD-ZRPKM values can be used to resolve the copy number for each region individually (for description of the method, see below). When we examined 378 of these 481 calls for which whole-genome absolute copy number estimates were available (Sudmant et al. 2010), we find that the SVD-ZRPKM signal at 222/378 (59%) of these strongly correlated (r2 ≥ 0.9) with whole-genome copy number, indicating that the SVD-ZRPKM signal at these loci accurately characterizes the copy number of individuals. Furthermore, across loci with reference genome copy number less than eight (276/378), the median r2 is 0.95, with strong correlations seen at 186/276 (67%) loci. This included 40/42 (95.2%) of the polymorphic CNPs not mapping within annotated segmental regions (Supplemental Table S2)—the two regions that failed, KRTAP9-2 and ZNF468, are part of more ancient duplications that may complicate exome capture.
CNV discovery in ASD trios
We next estimated the precision of our method for rare CNVs using exome sequence from 109 ASD probands trios for which Illumina 1M SNP microarray data were available (Sanders et al. 2011; O'Roak et al. 2012). Initially, 317 autosomal calls of three or more exons were detected in 104 probands (Supplemental Fig. S3); however, to assess the accuracy of our algorithm in detecting rare CNVs, we filtered calls where (1) the call overlapped segmental duplications or nonunique portions of the genome by >50% (153/317, 48%), or (2) the call was found in a somatically rearranged locus, such as the HLA locus (one call). Additionally, we filtered calls if the call was the duplication of a gene known to exist as a processed pseudogene in that individual (40/317, 13%; for methods and discussion, see Supplemental Fig. S17; Supplemental Note), as such events—while detectable from exome data using our algorithm and other sequence-based algorithms—cannot be detected using SNP microarray platforms, which predominately place probes in intronic or nongenic sequence. In the remaining set of 124 putative CNVs in 74 probands, we identified eight events as de novo, 87 events as inherited from either parent, and 29 events which resembled polymorphic CNPs in the population (Supplemental Table S3).
Next, we orthogonally validated these CNVs and CNPs using Illumina 1M SNP microarray data for events large enough to span enough SNP probes. This comparison resulted in initial overall concordance of 95/124 (77%) (Table 3). We experimentally validated a subset of the remaining events using qPCR and array-CGH by designing a customized oligonucleotide microarray. These experiments confirmed 15/18 (83%) events (Supplemental Figs. S19, S20; Supplemental Table S3). In summary, our method discovered and confirmed seven novel rare CNVs and four novel CNP loci; for both categories, the events are too small to be detected using high-density SNP microarrays. Taken together, 117 of our 124 putative CNV calls were validated, leading to orthogonally validated precision of 94% (Table 3).
Table 3.
Validation of exome-based CNV calls in autism probands
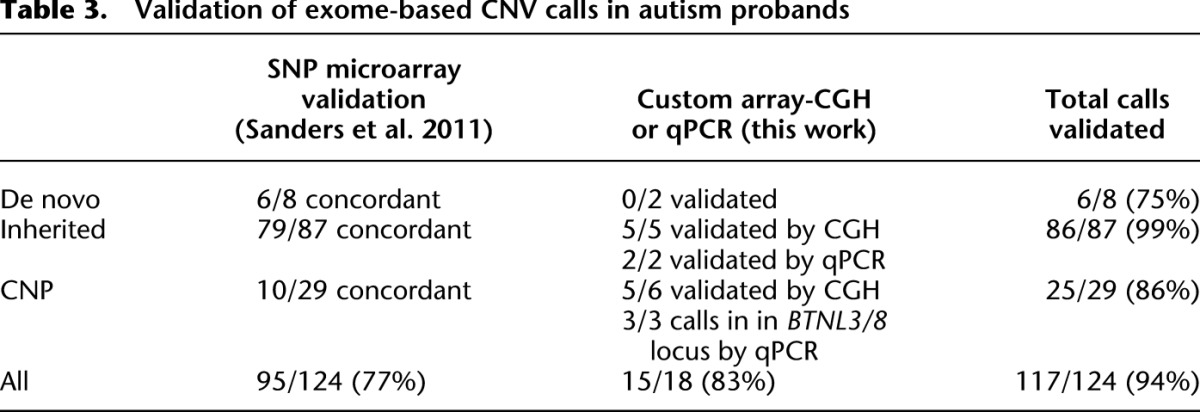
Finally, we gauged the sensitivity for discovery of rare CNVs using our algorithm against previously discovered and annotated CNVs in the ASD probands (Supplemental Table S8; Sanders et al. 2011). There were 109 possible calls in the overlapping set of probands with a minimum of three exome probes and <50% segmental duplication content; of these, Sanders and colleagues considered 64 to be high-confidence CNV calls based on ≥20 SNP probes. When we applied our algorithm to the same samples, we found a total of 83/109 (76%) CNVs; for CNVs with ≥20 Illumina SNP probes, our discovery climbs to 54/64 (84%). These calls are listed in Supplemental Table S4. When we examined the concordance rate between platform of calls primarily within segmental duplications, our exome-based method recovers only 10/52 calls (19%). As described elsewhere within this work, we suggest that the copy number of these known regions be estimated via the genotyping approach using the mean of SVD-ZRPKM signals across the region.
Genotyping CNP variants
We took two approaches in assessing our method's ability to determine the copy number of CNPs: (1) a relative correlation approach between the continuous SVD-ZRPKM values and whole-genome-sequence derived copy number estimates, and (2) an unsupervised clustering approach of exome-based genotype values in order to derive absolute copy number states for CNP loci.
For the first approach, we selected 62 previously identified CNP loci and genes (Supplemental Table S5) and calculated the copy number of each locus based on whole-genome read-depth data using previously described methodology, which has been experimentally validated using single-channel array-CGH intensity data (Sudmant et al. 2010). For each locus, we correlated the estimated whole-genome copy number with the average of SVD-ZRPKM values for the exons in the locus (Fig. 2). The median r2 value between exome-based and whole-genome–based genotyping at each locus was 0.91 (Fig. 3A; Supplemental Table S5), indicating a high degree of reliability between exome and whole-genome copy number estimation for CNP loci. Furthermore, after stratifying the results by the median copy number of each locus, we found that for loci with median copy number of eight or less, 32 of 39 loci (82%) were highly correlated (r2-value ≥ 0.9), but for loci with median copy number greater than eight, the median locus r2 was only 0.32.
Figure 2.

CNP locus genotyping of RHD and C4A. (A) SVD-transformed values for exons for the Rhesus deletion factor locus (RHD/RHCE) show distinct copy number states across both paralogous genes. (B) Histogram of average SVD-ZRPKM values for the ESP data set (533 individuals) and seven HapMap samples. Clustering was performed using an unsupervised algorithm (Supplemental Note). (C) Correlation between SVD-ZRPKM genotype values (y-axis) and absolute copy number estimate (x-axis) based on whole-genome read-depth for seven HapMap samples and experimentally validated by array-CGH. (D–F) Similar to above, for C4A locus.
Figure 3.

Genotyping accuracy across 62 CNP loci. (A) Distribution of correlation coefficients of SVD-ZRPKM to whole-genome copy number estimate (Sudmant et al. 2010) across 62 CNP loci for seven HapMap samples, split by the median copy number of each locus. For loci with copy number less than eight, 32/39 had strong correlations between exome and whole-genome estimates, indicating that exome-based SVD-ZRPKM can be used to genotype such loci. (B) Results from unsupervised clustering algorithm for 43 autosomal loci for which genotype information was available (Campbell et al. 2011).
Second, we assessed the accuracy of our approach in determining the absolute copy number of common CNPs. We leveraged available genotype information for seven of the HapMap samples in this study across 43 autosomal CNP loci previously studied by Campbell and colleagues (Supplemental Table S6; Campbell et al. 2011). For each locus, we again used the locus average of the SVD-ZRPKM values and clustered these genotype values using an unsupervised clustering algorithm (Supplemental Note). Each cluster was then assigned the most likely copy number based on the most common copy number state previously identified. By use of this unsupervised method, we correctly predicted absolute copy for 235/301 (78%) calls (Fig. 3B; Supplemental Table S6) with an overall absolute genotype correlation across all 43 CNP loci of r2 = 0.73.
Our algorithm uses relative read-depth values (introduced both by the z-transformation and the SVD algorithm itself) in order to overcome significant batch biases in exomes, thus sacrificing the genome-wide linear model of read-depth and copy number exploited by whole-genome structural variation discovery algorithms. Nonetheless, the two approaches presented above can be used to “anchor” the relative SVD-ZRPKM values to absolute copy number. First, the strong r2 correlation for many loci can be exploited as a “standard curve” for each locus, and the absolute copy number for exome samples can be estimated. Alternatively, SVD-ZRPKM values can be clustered (Supplemental Note) into copy number groups, thus facilitating absolute copy number estimates without the use of whole-genome data.
Methodological considerations
The number of components selected for removal is an important parameter in our algorithm and warrants further consideration. Removing too few components leaves the algorithm at risk for residual systematic bias; conversely, removing too many components will begin to remove bona fide signal from exomes, especially at large, common segmental duplications within which a large proportion of analyzed exomes contribute a strongly altered read-depth signal. We tested how well the SVD algorithm could remove systematic noise without removing signal from biological events (e.g., CNVs and CNPs). First, we examined the recall rate and signal-to-noise ratio (SNR) of CNVs discovered via our algorithm in the ASD probands as we removed additional components. For rare CNVs, we found that even if 30 components were removed, 56/57 CNVs survived SVD transformation (Supplemental Fig. S11); furthermore, the SNR for these CNVs remained robust at even higher SVD (50–100) cutoffs (for an example, see Supplemental Fig. S13). In contrast, for common CNPs, recall rate and SNR dropped more rapidly starting at 30 SVD components. As suggested, such CNPs should be genotyped at comparatively lower SVD cutoffs in order to preserve their signal. In a second experiment, we calculated the concordance of our calls with the Illumina SNP-based calls (Sanders et al. 2011) at increasing SVD removal thresholds (Supplemental Fig. S12). We found that removing up to 30 SVD components did not adversely affect the fraction of discovered CNVs; in contrast, this did reduce the fraction of nonconcordant calls (i.e., fewer false positives).
Another important consideration for exome sequencing is the total number of on-target reads (i.e., reads that map to a captured region). For our algorithm, we have simulated the effect of lower overall exome coverage by down-sampling 10 exomes each at 75%, 50%, and 25% of their original coverage (simulating between 14 million and 153 million on-target 36mers per exome). The RPKM normalization robustly corrects for lower coverage, and we find that the signal for rare CNVs is only minimally affected at lower coverage levels. However, using our algorithm we find analyzing exomes with fewer on-target reads results in increased variance across their SVD-ZRPKM values, indicating a higher level of random noise and leading to potentially reduced sensitivity and specificity. In both simulations (Supplemental Fig. S15) and our empirical results (Supplemental Fig. S16) of the ASD proband exomes, we suggest a minimum of 50 million on-target reads.
We also assessed the effect of multiple versus unique mapping in CNV detection. As we generated our read-depth estimates from mrsFAST-based alignments, in which reads can map to a virtually unlimited number of locations given a set edit distance, we were interested to see how our method would perform using alignments that included only reads with unique mappings. Such alignments are commonly created for the discovery of SNPs and SNVs, analyses that are easily confounded when multiple mappings are considered. We used available BWA-based alignments that were generated using commonly used parameters and filtering steps suitable for SNP-centric analyses, including removal of reads with multiple mappings (Supplemental Note). We calculated RPKM values from these BWA alignments for the HapMap samples and a subset of the ESP exomes. We observed that signal for rare deletions and duplications in the HapMap samples was attenuated (Supplemental Fig. S5), and that the median SNR for the seven rare deletions and duplications was 58% lower for the BWA-based mappings (Supplemental Table S7; Supplemental Note). In addition, we genotyped 47/62 loci in Supplemental Table S5 and found a striking difference in the correlation between BWA-based mappings (median r2 = 0.36) and mrsFAST-based mappings (median r2 = 0.92). The remaining 15/62 loci did not have any probes with adequate BWA read-depth, making them intractable and false negatives by this approach. The difference in correlation with mrsFAST mappings was mostly notable for loci with copy numbers ranging between seven and 12 (Supplemental Fig. S6B). These data highlight the importance of considering alignments with multiple mappings enabled, especially for loci with increased copy number (e.g., the LRRC37A3 locus) (Supplemental Fig. S6C). We wish to emphasize that these observed differences are not reflective of the difference of BWA and mrsFAST per se, although enabling multiple mappings for BWA comes at significantly increased computation expense (Hach et al. 2010). In addition, the complete removal of reads with multiple mappings may be overly stringent, and it is possible that better results may be obtained when using “default” BWA parameters where a randomly chosen mapping for reads with multiple mappings is kept. However, even in this case, we expect significant attenuation of signal in duplicated portions of the genome, as each read could only increase signal by an average of 1/N (where N is expected copy number) in comparison to a robust treatment of multiple mappings.
Finally, we compared our algorithm to ExomeCNV (Sathirapongsasuti et al. 2011), which is designed to detect copy number aberration in the context of cancer using closely matched tumor–normal pairs of exomes. Nevertheless, we were interested to see if ExomeCNV could be used to detect germline variation. We analyzed (using default settings) (see Supplemental Note) four HapMap exomes with NA19240 as the reference and compared the results to a validated call set from these genomes (Conrad et al. 2011). Overall, ExomeCNV predicted 450 CNVs, of which only 63 (14%) had >10% reciprocal overlap with the validated call set. In contrast, our algorithm identified 24 calls among these four samples, of which 21 (88%) overlapped the validated call set. We note that ExomeCNV uses uncalibrated read-depth to estimate copy number, and depending upon batch effects, this can result in the algorithm reporting a significant fraction of the exome as non-diploid (Supplemental Fig. S7). Furthermore, similar to the BWA-based alignments (see above), ExomeCNV has limited dynamic range in CNP loci and duplicated genes: The average r2 correlation across tested CNPs was 0.57 (compared to our algorithm, r2 = 0.92) (Supplemental Fig. S8).
Discussion
We have outlined a method for making read-depth data from exomes amenable to rare CNV discovery, as well as copy number genotyping of CNP loci. We used SVD normalization to overcome a host of coverage biases introduced by the capture and sequencing of exomes. Our method allows for differing sample preparations and capture reactions to be integrated into the same experiment, provided each “batch” is sufficiently large (n ≥ 8). This includes correct normalization of the X chromosome, such that deletions and duplications can be assayed regardless of the sample's sex. Additionally, our method can integrate exomes captured with different exome capture target designs: The eight HapMap exomes were captured using the Roche NimbleGen SeqCap EZ version 1, while all other exomes in our experiments were captured using the SeqCap EZ version 2 capture kit. We have successfully used the CoNIFER method on a variety of other platforms, including the Illumina SureSelect exome capture platform, older NimbleGen capture designs, as well custom Agilent designs. Remarkably, we find that sufficient dynamic range response remains to accurately predict the copy of duplicated genes up to eight copies. The upper limit of this response is likely an effect of the stoichiometry of the exome-capture reaction, and we suggest that this may be improved simply by adjusting the concentrations and targets of exome-capture platforms.
Owing to the significantly lower probe density and the targeted nature of exome-capture platforms, our algorithm cannot fully replace currently available high-density array-CGH or SNP microarray platforms if genome-wide detection of CNVs is the goal. Currently, available exome capture platforms target fewer than 200,000 exons or regions within the genome, while other platforms contain upward of 1 million probes. The estimated sensitivity for exome-based discovery of rare CNVs containing three or more exons is ∼76% (Supplemental Table S4) in comparison to high-density array platforms; therefore, some exonic CNVs are likely to be missed by our approach. We emphasize that these metrics are based on relatively unique regions of the genome (<50% segmental duplication) where performance is optimal. The targeted nature of the exome capture gives our algorithm increased power to detect genic CNVs and CNPs <14 kbp in size (Supplemental Fig. S18), as well as the ability to genotype (but not necessarily discover) copy number for more complex genic regions poorly characterized by SNP microarrays (see below). For 10-kbp events intersecting at least three exons, we have determined that our algorithm has 8.9-fold increased power over Illumina 1M Duo SNP microarrays. In analyzing the ASD probands, we have found several examples of such small CNVs not previously detected using SNP microarrays and have confirmed these events using a targeted array-CGH platform.
Another important consideration in interpreting exome read-depth data is the presence of polymorphic processed pseudogenes. In our study of autism trios, we found that 13% (40/316) of events correspond to changes in the copy of processed pseudogenes residing elsewhere in the genome (Supplemental Table S3; Supplemental Fig. S17). Such events have been difficult or impossible to discover using traditional SNP microarray approaches, as the probes for these assays often do not explicitly target the coding exons themselves. While such events may be easily inferred based on the absence of intronic sequence, a comprehensive catalog of polymorphic processed pseudogenes, we predict, will improve the detection of bona fide exonic deletions and duplications.
An important note of caution is that the nature of the z-transformation paired with the SVD component removal makes our algorithm unsuitable for the detection of chromosomal aneuploidy. Although detecting such events using read-depth is possible in principle, our algorithm processes each chromosome separately, and extremely large events are likely to be normalized as part of the first few components. Although we know of no aneuploidy in the exomes we analyzed, we have observed such normalization when considering the X chromosome. Removing as few as three components fully eliminates the difference in copy number of the X chromosome between males and females (Supplemental Fig. S22), although rare CNVs and smaller CNPs can still be accurately assayed on the X chromosome.
Furthermore, the z-transformation required to normalize the read-depth data necessitates the distinction between discovery of rare CNVs and the genotyping of polymorphic CNPs. We have shown that the CoNIFER method can detect rare CNVs and that the transformed read-depth signal preserves information about the copy number for CNPs. However, for highly polymorphic CNPs (often in annotated segmental duplications), discovery using fixed thresholds is comparatively less sensitive. Therefore, CoNIFER is limited in its power to discover novel CNP loci without a priori knowledge of their location (although more complex segmentation algorithms tuned specifically for such discovery could be applied to the SVD-ZRPKM values).
Based on our results and simulations, there are a few practical considerations to ensure successful analysis of exomes using the CoNIFER software program. First, all of our exomes were captured from genomic DNA that had not undergone whole-genome amplification (WGA), and we have found that WGA exomes perform very poorly in our analysis. Second, we recommend sequencing exomes to a minimum coverage of 50 million on-target 36mers. Third, although any short-read alignment tool can be used in principle, we strongly recommend using alignments that have enabled multiple mappings per read. Finally, a primary feature of CoNIFER is the ability to mix capture reactions, experiments, and sequencing runs, but care should be taken when combining data across significantly different platforms—in these cases, only the common set of probes between platforms should be used in order to avoid false negatives.
We envision a number of algorithmic improvements. Although using mrsFAST mappings both increases the SNR for rare CNVs and improves genotyping accuracy for CNPs, these mappings often cannot distinguish between paralogous genes. By restricting the RPKM calculation to exons and regions that contain paralog-specific single-nucleotide variants (Sudmant et al. 2010), we hope to be able to extend our method to genotype duplicated genes in a paralog-specific manner. We also expect to lower the minimum number of exons required to detect a CNV. We applied our method to genotyping single exons (such as the third exon of GHR) (Santos et al. 2004) and found the SVD-ZRPKM values robustly distinguished different copy number classes of a single exon. By developing a discovery set of CNP exons, genes, and loci—as well as their copy number states in populations—future disease-association studies will be better informed. Finally, though array-based technologies have described many CNP–disease associations (Girirajan et al. 2010), discovery of loci has been limited to those with low median copy number, and our approach here will be able to examine CNP loci with higher copy number. By use of our approach with large clinical cohorts currently undergoing exome sequencing, we expect to find new disease associations with rare CNVs, CNP loci, and paralog-specific copy number of known CNP loci.
Acknowledgments
We thank S. Ng, S. McGee, and T. Brown for helpful comments in the preparation of this manuscript; M. State and the Simons Simplex Collection Genetics Consortium for providing Illumina genotyping data; K. Patterson for exome coverage statistics; and A. Schachtel for suggesting the CoNIFER name. This work was supported by NIH grants HD065285 (E.E.E.), HHSN273200800010C (D.A.N.), and HL102926 (D.A.N.) and the Simons Foundation Autism Research Initiative (E.E.E.). E.E.E. is an investigator of the Howard Hughes Medical Institute.
Footnotes
[Supplemental material is available for this article.]
Article published online before print. Article, supplemental material, and publication date are at http://www.genome.org/cgi/doi/10.1101/gr.138115.112.
References
- The 1000 Genomes Project Consortium 2010. A map of human genome variation from population-scale sequencing. Nature 467: 1061–1073 [DOI] [PMC free article] [PubMed] [Google Scholar]
- Alkan C, Kidd JM, Marques-Bonet T, Aksay G, Antonacci F, Hormozdiari F, Kitzman JO, Baker C, Malig M, Mutlu O, et al. 2009. Personalized copy number and segmental duplication maps using next-generation sequencing. Nat Genet 41: 1061–1067 [DOI] [PMC free article] [PubMed] [Google Scholar]
- Bamshad MJ, Ng SB, Bigham AW, Tabor HK, Emond MJ, Nickerson DA, Shendure J 2011. Exome sequencing as a tool for Mendelian disease gene discovery. Nat Rev Genet 12: 745–755 [DOI] [PubMed] [Google Scholar]
- Campbell CD, Sampas N, Tsalenko A, Sudmant PH, Kidd JM, Malig M, Vu TH, Vives L, Tsang P, Bruhn L 2011. Population-genetic properties of differentiated human copy-number polymorphisms. Am J Hum Genet 88: 317–332 [DOI] [PMC free article] [PubMed] [Google Scholar]
- Chiang DY, Getz G, Jaffe DB, O'Kelly MJT, Zhao X, Carter SL, Russ C, Nusbaum C, Meyerson M, Lander ES 2008. High-resolution mapping of copy-number alterations with massively parallel sequencing. Nat Methods 6: 99–103 [DOI] [PMC free article] [PubMed] [Google Scholar]
- Conrad DF, Pinto D, Redon R, Feuk L, Gokcumen O, Zhang Y, Aerts J, Andrews TD, Barnes C, Campbell P, et al. 2011. Origins and functional impact of copy number variation in the human genome. Nature 464: 704–712 [DOI] [PMC free article] [PubMed] [Google Scholar]
- Girirajan S, Campbell CD, Eichler EE 2010. Human copy number variation and complex genetic disease. Annu Rev Genet 45: 203–226 [DOI] [PMC free article] [PubMed] [Google Scholar]
- Hach F, Hormozdiari F, Alkan C, Hormozdiari F, Birol I, Eichler EE, Sahinalp SC 2010. mrsFAST: A cache-oblivious algorithm for short-read mapping. Nat. Methods 7: 576–577 [DOI] [PMC free article] [PubMed] [Google Scholar]
- Hormozdiari F, Alkan C, Eichler EE, Sahinalp SC 2009. Combinatorial algorithms for structural variation detection in high-throughput sequenced genomes. Genome Res 19: 1270–1278 [DOI] [PMC free article] [PubMed] [Google Scholar]
- Karakoc E, Alkan C, O'Roak BJ, Dennis MY, Vives L, Mark K, Rieder MJ, Nickerson DA, Eichler EE 2011. Detection of structural variants and INDELs from exome data. Nat Methods 9: 176–178 [DOI] [PMC free article] [PubMed] [Google Scholar]
- Kidd JM, Cooper GM, Donahue WF, Hayden HS, Sampas N, Graves T, Hansen N, Teague B, Alkan C, Antonacci F, et al. 2008. Mapping and sequencing of structural variation from eight human genomes. Nature 453: 56–64 [DOI] [PMC free article] [PubMed] [Google Scholar]
- Korbel JO, Urban AE, Grubert F, Du J, Royce TE, Starr P, Zhong G, Emanuel B, Weissman SM, Snyder M, et al. 2007. Systematic prediction and validation of breakpoints associated with copy-number variants in the human genome. Proc Natl Acad Sci 104: 10110. [DOI] [PMC free article] [PubMed] [Google Scholar]
- Korbel JO, Abyzov A, Mu XJ, Carriero N, Cayting P, Zhang Z, Snyder M, Gerstein MB 2009. PEMer: A computational framework with simulation-based error models for inferring genomic structural variants from massive paired-end sequencing data. Genome Biol 10: R23 doi: 10.1186/gb-2009-10-2-r23 [DOI] [PMC free article] [PubMed] [Google Scholar]
- Mortazavi A, Williams BA, McCue K, Schaeffer L, Wold B 2008. Mapping and quantifying mammalian transcriptomes by RNA-Seq. Nat Methods 5: 621–628 [DOI] [PubMed] [Google Scholar]
- Ng SB, Buckingham KJ, Lee C, Bigham AW, Tabor HK, Dent KM, Huff CD, Shannon PT, Jabs EW, Nickerson DA, et al. 2009. Exome sequencing identifies the cause of a mendelian disorder. Nat Genet 42: 30–35 [DOI] [PMC free article] [PubMed] [Google Scholar]
- O'Roak BJ, Vives L, Girirajan S, Karakoc E, Krumm N, Coe BP, Levy R, Ko A, Lee C, Smith JD, et al. 2012. Sporadic autism exomes reveal a highly interconnected protein network of de novo mutations. Nature 485: 246–250 [DOI] [PMC free article] [PubMed] [Google Scholar]
- Sanders SJ, Ercan-Sencicek AG, Hus V, Luo R, Murtha MT, Moreno-De-Luca D, Chu SH, Moreau MP, Gupta AR, Thomson SA, et al. 2011. Multiple recurrent de novo CNVs, including duplications of the 7q11.23 Williams syndrome region, are strongly associated with autism. Neuron 70: 863–885 [DOI] [PMC free article] [PubMed] [Google Scholar]
- Santos Dos C, Essioux L, Teinturier C, Tauber M, Goffin V, Bougnères P 2004. A common polymorphism of the growth hormone receptor is associated with increased responsiveness to growth hormone. Nat Genet 36: 720–724 [DOI] [PubMed] [Google Scholar]
- Sathirapongsasuti JF, Lee H, Horst BAJ, Brunner G, Cochran AJ, Binder S, Quackenbush J, Nelson SF 2011. Exome sequencing-based copy-number variation and loss of heterozygosity detection: ExomeCNV. Bioinformatics 27: 2648–2654 [DOI] [PMC free article] [PubMed] [Google Scholar]
- Sudmant PH, Kitzman JO, Antonacci F, Alkan C, Malig M, Tsalenko A, Sampas N, Bruhn L, Shendure J, 1000 Genomes Project, et al. 2010. Diversity of human copy number variation and multicopy genes. Science 330: 641–646 [DOI] [PMC free article] [PubMed] [Google Scholar]
- Ye K, Schulz MH, Long Q, Apweiler R, Ning Z 2009. Pindel: A pattern growth approach to detect break points of large deletions and medium sized insertions from paired-end short reads. Bioinformatics 25: 2865 doi: 10.1093/bioinformatics/btp394 [DOI] [PMC free article] [PubMed] [Google Scholar]
- Yoon S, Xuan Z, Makarov V, Ye K, Sebat J 2009. Sensitive and accurate detection of copy number variants using read depth of coverage. Genome Res 19: 1586–1592 [DOI] [PMC free article] [PubMed] [Google Scholar]