

Abstract
Genetic dissection of complex, polygenic trait variation is a key goal of medical and evolutionary genetics. Attempts to identify genetic variants underlying complex traits have been plagued by low mapping resolution in traditional linkage studies, and an inability to identify variants that cumulatively explain the bulk of standing genetic variation in genome-wide association studies (GWAS). Thus, much of the heritability remains unexplained for most complex traits. Here we describe a novel, freely available resource for the Drosophila community consisting of two sets of recombinant inbred lines (RILs), each derived from an advanced generation cross between a different set of eight highly inbred, completely resequenced founders. The Drosophila Synthetic Population Resource (DSPR) has been designed to combine the high mapping resolution offered by multiple generations of recombination, with the high statistical power afforded by a linkage-based design. Here, we detail the properties of the mapping panel of >1600 genotyped RILs, and provide an empirical demonstration of the utility of the approach by genetically dissecting alcohol dehydrogenase (ADH) enzyme activity. We confirm that a large fraction of the variation in this classic quantitative trait is due to allelic variation at the Adh locus, and additionally identify several previously unknown modest-effect trans-acting QTL (quantitative trait loci). Using a unique property of multiparental linkage mapping designs, for each QTL we highlight a relatively small set of candidate causative variants for follow-up work. The DSPR represents an important step toward the ultimate goal of a complete understanding of the genetics of complex traits in the Drosophila model system.
The complex etiology of most human diseases and traits of ecological significance has severely hampered their genetic dissection. Traditional linkage studies of complex traits have been plagued by low mapping resolution (Mackay 2001), with QTL typically resolved to wide regions approaching 10 cM, requiring further fine-mapping to clone the causative allele. In addition, since just two phenotypically distinct lines are generally employed as the parents of the mapping panel, only a fraction of the sites contributing to trait variation in the population are tested, and the full complexity of the genetic architecture of the trait is underestimated.
In recent years, characterization of causative loci has been dominated by the genome-wide association study (GWAS) paradigm. These studies have provided extraordinary insight into the biology of human disease (Hirschhorn and Gajdos 2011), but it is now clear that replicable associations contribute just a tiny fraction to the variability in any given complex trait (McCarthy et al. 2008; Manolio et al. 2009). The main challenges for the GWAS paradigm are the low power to detect true, but subtle-effect causative variants given the stringent correction for multiple testing that must be applied (Yang et al. 2010), and the fact that low frequency variants are poorly interrogated. If rare, presumably deleterious alleles are responsible for a large fraction of trait variation (Mackay 2010; Zhu et al. 2011), GWAS are likely to be unable to identify variants that cumulatively explain the bulk of standing genetic variation (Weiss and Terwilliger 2000; Pritchard 2001; Reich and Lander 2001; Pritchard and Cox 2002).
Given the difficulties faced by simple QTL mapping methods and GWAS, most of the nucleotide variants conferring phenotypic change have remained elusive, and no complex phenotype has been genetically dissected to anything approaching completion. In model genetic systems, a strategy that combines the high mapping resolution offered by multiple generations of recombination, with the high statistical power afforded by a linkage-based design, can serve to complement the GWAS approach. This strategy maps QTL in a population composed of a genotypically diverse set of inbred lines derived from multiple founders. Four such resources have been described to date: the mouse Collaborative Cross (Churchill et al. 2004; Aylor et al. 2011; Philip et al. 2011), the Arabidopsis multiparent RIL (Recombinant Inbred Line) population (AMPRIL) (Huang et al. 2011), the Arabidopsis multiparent advanced generation inter-cross lines (MAGIC) (Kover et al. 2009), and the maize nested associated mapping population (NAM) (Buckler et al. 2009; McMullen et al. 2009). These powerful resources provide accurate estimates of QTL positions and effects and, by virtue of being founded by multiple genotypes, allow estimates of the number and frequency of alleles at QTL. Importantly, because these populations are composed of a series of homozygous, genotyped RILs, they represent stable genetic reference panels that facilitate systems-level analyses of genetic architecture.
Here we introduce the first multi-founder, advanced generation genetic reference panel for the elite model system Drosophila melanogaster: The Drosophila Synthetic Population Resource (DSPR). The DSPR consists of >1600 genotyped RILs derived from a pair of highly recombinant F50 intercross populations initially founded by a total of 15 completely resequenced inbred lines. Our resources are freely available as a community resource for investigators seeking to elucidate the genetic basis of complex trait variation (FlyRILs.org). The two main goals of this paper are first to describe the development and general properties of the DSPR, and second to experimentally demonstrate the capability and performance of the DSPR by genetically dissecting the classic quantitative character, alcohol dehydrogenase (ADH) activity.
Results
Development of the DSPR
The DSPR is composed of two large panels of RILs. Each panel was derived from a different synthetic recombinant population, pA or pB, founded with eight highly inbred strains (Fig. 1; Supplemental Table 1). The set of 15 founders—one line (AB8) is included in both populations—is of diverse geographic origin and should include a large swath of the genetic variation in D. melanogaster. After founding, each synthetic population was maintained as a pair of independent subpopulations at large census size for 50 generations to expand the genetic map, after which we generated over 800 RILs for each population.
Figure 1.

Breeding scheme for the eight-way DSPR RILs.
We characterized nucleotide-level variation encompassed by the DPSR by genome sequencing all 15 founder strains. After aligning raw, paired-end Illumina reads to the reference genome (iso1) and applying various quality filters, we identified 1.89 million SNPs, with the average genome coverage at SNPs ranging from 45.6 to 58.1× per founder (Supplemental Tables 2, 3A).
Finished RILs were genotyped by sequencing 96-plex restriction-site associated DNA (RAD) libraries (Baird et al. 2008). The average number of unpaired 100-bp RAD reads for each of the 1670 successfully genotyped RILs was 860,000 (95% of RILs have >347,000 reads), and these data reveal 10,275 SNPs (Supplemental Table 3B). A hidden Markov model (HMM) was used to convert this set of SNP markers to the underlying founder genotype for each genomic segment, and uncover the mosaic haplotype structure of each RIL (Supplemental Table 4A,B). The result of the HMM is a soft genotype assignment, giving the probability a genomic segment is derived from each of the eight founders. Owing to our high marker density, for 95% of all positions over all RILs the most likely founder type has a probability >0.95 (Supplemental Fig. 1).
Details of all freely available community resources associated with the DSPR project (RILs, sequences, genotypes, QTL mapping software) are presented in Supplemental Material and at FlyRILs.org.
Properties of the DSPR
Only 1% of genomic positions in the finished DSPR RILs are assigned a heterozygous founder genotype by the HMM, and these often occur near centromeres (Fig. 2). This low residual heterozygosity is supported by the SNP data, where the median fraction of polymorphic SNPs per RIL is 2%. These values compare favorably with a smaller set of two-way RILs used widely by the Drosophila community (Nuzhdin et al. 1997) and are consistent with values expected based on simulation (Broman 2005).
Figure 2.

Founder genotype frequency variation across the genome in the DSPR RILs. The first eight rows show the frequency of each homozygous founder genotype in the pA (pA1, dark blue; pA2, light blue) and pB (pB1, dark red; pB2, pink) DSPR RILs. The 1/8 line shows the expected frequency for equal founder composition. The bottom row shows the frequency of heterozygous genotypes (note the y-axis scale is considerably reduced for these plots).
The accumulation of recombination breakpoints during synthetic population intercrossing results in expansion of the genetic map. We define a breakpoint as that interval in which the founder ancestry of a RIL transitions from a probability of >0.95 for one founder type to >0.95 for a different founder type. In the DSPR the sizes of recombination breakpoint regions follow an exponential distribution with a median physical distance of 148 kb (24 bp to 2.4 Mb) (Supplemental Fig. 2A). Intervening founder segment sizes between recombination breakpoints follow an exponential distribution as expected (Broman 2005), with a median size of 3.0 cM and 3.2 cM for the autosomes and X chromosome, respectively (Supplemental Fig. 2B). Map expansion in the DSPR was ∼20 times that of the standard Drosophila map, with fairly uniform expansion throughout the entire length of chromosomes (Supplemental Fig. 3), facilitating high-resolution mapping of QTL. This level of expansion is slightly less than the 27× and 35× expansion expected for autosomes and the X chromosome, respectively (Teuscher and Broman 2007). This result is perhaps due to the sampling properties of recombination events during maintenance of the synthetic populations, and/or because some small segments resulting from pairs of recombination events in close proximity are not tagged by our marker set (see below).
Assuming an ideal synthetic population breeding scheme, on average the eight founders should contribute equally to every RIL. This is not the case in the DSPR, and founder contributions deviate from the expected proportion of 0.125. This has been observed previously in similar, highly recombinant D. melanogaster synthetic populations (Macdonald and Long 2007). The average proportion of each founder genotype in a given RIL ranges from 0.03 to 0.26 (Supplemental Fig. 4), and the average frequency of a founder genotype at a position ranges from 0 to 0.8 (Fig. 2). Thus, some genomic regions are dominated by a single founder genotype, and some entirely lack material from one or more founders. Nevertheless, over the genome the DSPR shows high founder representation: Assuming a founder is present at a position if five or more RILs possess that haplotype, of the 15 possible founder genotypes that could be represented at each position over both populations, the average number of haplotypes observed is 12, with a minimum of eight.
We cannot discount the possibility that some of the heterogeneity in the founder composition of the DPSR RILs came during the inbreeding phase, as has been observed in the Collaborative Cross (Philip et al. 2011). However, given our deliberate effort to reduce segment length in the RILs via 50 generations of free recombination, and our use of mass breeding rather than a specific, multigeneration crossing design (Rockman and Kruglyak 2008), the unbalanced allelic structure is most likely to have resulted from the action of random genetic drift, and both purifying and positive selection during maintenance of the synthetic populations. Combining the eight founder genomes using a fixed funnel design over three generations (Churchill et al. 2004) may have yielded the balanced founder representation seen in the Collaborative Cross population (Aylor et al. 2011), but would have come at a cost of a marked decrease in mapping resolution in the DSPR.
Comparison of RILs derived from the same population, but from different subpopulations, suggests that between founding of the synthetic population and completion of inbreeding both drift and selection contributed to uneven founder representation. In Figure 2, chromosomal regions where the curves from the two subpopulations parallel each other (e.g., the X chromosome for founder B1) suggest a common selection pressure altered the haplotype frequency of this founder. In contrast, regions where the two curves diverge (e.g., the distal end of chromosome 2L for founder A4) suggest the action of drift.
Validation of the HMM results
The RAD genotyping method provided high marker density across the genome resulting in high performance of the HMM (King et al. 2012). However, no genotyping method provides perfect information. To validate our HMM results, we sequenced the full genomes of four pA RILs and present data from line A1.100 as an example (all four RILs show similar results). Comparison of the most likely founder genotype assignment across all SNPs (excluding ∼1.4 million sites in the 1 cM around centromeric regions and from telomeres) in the fully sequenced RIL with the same locations in the same RAD genotyped RIL shows 97% identity across the genome (Supplemental Fig. 5). Regions where the most likely founder genotypes do not match are small, with a median size of 17 kb, and for 81% of these nonmatching regions, the RAD founder genotype assignment is uncertain (the most likely founder genotype probability is <95%). We observe 11 segments, ranging in size from 406 bp to 506 kb, in the sequenced data set that are not resolved by the RAD genotype data (Supplemental Fig. 5). While some of these breakpoints may represent true recombination breakpoints missed by the RAD genotyping, segments of such a small size could also result from gene conversion events or sequencing alignment errors.
Demonstration of the methodology
To empirically evaluate QTL mapping power and resolution in the DSPR, we sought to genetically dissect variation in overall activity of the ADH enzyme. This trait provides a valuable “positive control” for our approach, since a large fraction of the variation in ADH activity is known to be due to sites at the Adh locus (Laurie et al. 1991; Laurie and Stam 1994; Stam and Laurie 1996). A kinetic enzyme assay confirms the 15 founders show variation for ADH activity (Supplemental Fig. 6) and highlights the known large effect of the nonsynonymous Fast/Slow (F/S) polymorphism—the four Slow founders exhibit a qualitatively different phenotype from all but one of the 11 Fast founders. The ∇1 intronic insertion/deletion polymorphism that influences the amount of ADH protein produced (Laurie and Stam 1994) also segregates in the founders although its influence is not clear from direct assays of the inbred founder strains.
Scoring 814 pA RILs and 824 pB RILs for the trait revealed substantial variation (Supplemental Fig. 7), and we estimated the broad sense heritability of our measure of ADH activity as 0.60 in pA and 0.57 in pB (see Methods). For QTL mapping we employed RIL means to reduce the environmental variance, and the broad sense heritability of these mean measures is 0.92 in pA and 0.90 in pB (hereafter, we will refer to these values as heritability). As anticipated, we succeeded in identifying a large-effect QTL directly over Adh in both panels of RILs (Fig. 3). This QTL (Q1) explains 49% and 28% of the heritability in the pA and pB RILs, respectively, and a 2-LOD support interval implicates a 370-kb (0.5 cM) region that includes Adh along with 21 other genes. In pB we also map two trans-acting QTL (Q2 and Q3) to ∼800-kb windows on chromosome 3, one to the middle of 3L and one to the middle of 3R (Fig. 3; Table 1). Interestingly, Q2 maps to the same broad genetic interval as a previously identified locus that has a trans-regulatory effect on ADH level (King and McDonald 1987).
Figure 3.

Positions of loci contributing to variation in ADH activity. QTL identified in analysis of raw ADH activity data (above) and analysis adjusted for Adh polymorphisms F/S and ∇1 (below). (Horizontal dashed lines) QTL significance thresholds determined by permutation. (Black diamond) Position of the Adh locus.
Table 1.
Details of all QTL identified
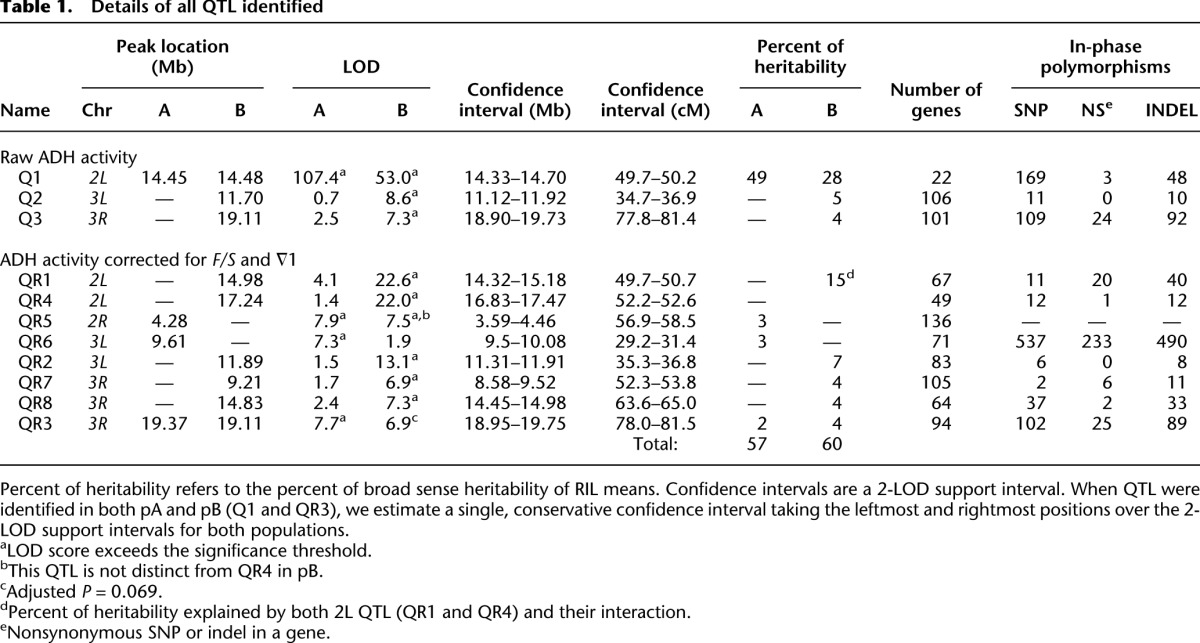
To further explore the genetics of ADH activity we rescanned the genome after statistically controlling for the three Adh haplotypes defined by F/S and ∇1 (Fig. 3). Eight QTL, including five not seen in the initial scan, were mapped to intervals averaging 728 kb (1.6 cM). The support intervals for QR2 and QR3—the same pair of trans-acting QTL previously mapped with the raw ADH activity data (Q2 and Q3)—were narrowed, but otherwise their properties were unchanged. Two of the QTL mapped after accounting for the F/S and ∇1 variants are closely associated with the Adh region (Fig. 3). One maps directly to the Adh locus itself (QR1), confirming the presence of cis-acting variants at Adh other than F/S and ∇1 (Stam and Laurie 1996). A second QTL (QR4) maps 2.6 Mb (2.4 cM) to the right of Adh on chromosome 2L, and may have only been identified as an independent QTL due to the genetic map expansion available in the DSPR. We detected a significant interaction between QR1 and QR4, indicative of epistasis (P = 0.014) (Supplemental Fig. 8).
The eight QTL mapped after conditioning on known functional alleles segregating at Adh each account for 2%–7% of segregating variation. This demonstrates that even for modest-effect QTL the DSPR has excellent mapping resolution and power. Combining over both of our genome scans for ADH activity, the total percentage of the genetic variance explained by mapped QTL is 57% and 60% in the pA and pB RILs, respectively (Table 1).
Identifying candidate causative polymorphisms
An ultimate goal of any genetic analysis of complex traits is to identify the precise causative nucleotide variants that give rise to phenotypic variation. A feature of mapping approaches employing multiparent synthetic populations is that one can estimate the phenotype for each founder haplotype at the QTL, and determine the pattern of shared allelic effects across founders (Macdonald and Long 2007; Aylor et al. 2011). We term this procedure “QTL phasing” (see Methods).
For pA, where the F/S and ∇1 variants at Adh are in complete linkage disequilibrium (LD), our phasing heuristic predicts two alleles segregate at the Adh-associated QTL Q1, and the founders fall into two clear groups, A1/A2 and A4/A5/A6/A7/AB8 (Fig. 4; Supplemental Table 5). The result is more complex for pB since F/S and ∇1 are not in complete LD, and we identify a closely linked epistatic QTL in this population (see above). Our phasing strongly suggests three alleles are present in pB, highlighting three founder groups, B7, B3, and B1/B2/B4/B6/AB8 (Fig. 4; Supplemental Table 5). There is also significant, although lower support for an additional allele further partitioning the founders into groups B1/B2/B4 and B6/AB8. Notice that the three major ADH activity classes do not entirely correspond to the known causative variants F/S and ∇1 (Fig. 4). Founders B3 and B6, both genotypically Fast and ∇1-Low, fall into different classes, indicating an additional closely linked, or allelic variant modifies ADH activity variation in pB. This result is consistent with the observation that at least three sites in the transcribed region of Adh contribute to protein expression (Stam and Laurie 1996).
Figure 4.

Founder haplotype means at the major Adh-associated QTL from the analysis of the raw ADH activity data. Founders are shaded to highlight the three major phenotypic classes identified by our phasing heuristic, and below are the genotypes of the founders at F/S and ∇1.
Access to high-coverage founder genome sequences gives us the opportunity to identify SNPs, and potential segregating indels, within a QTL interval that match the configuration predicted by phasing the founder phenotype means (Yalcin et al. 2005; Keane et al. 2011). This subset of the extant genetic variation most likely includes the true causative site. Under the major Adh-associated QTL (Q1; Supplemental Tables 5, 6A) 217 polymorphic events match the QTL phase, including three nonsynonymous SNPs, one of which is the F/S variant.
In general, our phasing heuristic implicated a relatively modest number of 14–191 in-phase segregating polymorphisms associated with the small-effect QTL (Supplemental Fig. 9; Supplemental Tables 5, 6A,B). For instance, only 21 segregating events are in phase with Q2 despite this interval encompassing 106 genes. If we assume the causative site is a coding variant we implicate just a single candidate gene for QR2, QR4, and QR7. In addition, for QR1 we identify a promising candidate causative indel in an intron of GABA-B-R1, a gene implicated in alcohol-induced behavioral impairment (Dzitoyeva et al. 2003).
In contrast to all other mapped QTL, a large number of polymorphisms (1027) match the inferred phase of QR6. This is because we lack phase information for six of the founders at this QTL: Four founders are absent from the RILs at this position, and we were unable to confidently assign phase for two others. Furthermore, phasing of the remaining founders reveals that all but one fall into the same allelic group, such that any site with an allele unique to the singleton strain is immediately implicated as putatively causative. This result highlights the fact that any phasing strategy will ultimately yield far fewer candidate functional variants for subsequent validation if two or more founders share the minor QTL allele.
Discussion
We have described the design and features of the first completed multiparent advanced generation intercross resource available for an animal model system. The DSPR consists of a set of >1600 highly inbred eight-way RILs, each genotyped for a genome-wide set of >10,000 SNPs. As a result of sequencing each of the 15 founder strains to high coverage we were able to use an HMM to confidently assign a founder genotype to each segment in each RIL. In addition, access to sequence from all founders allows users of the DSPR to define all polymorphisms within any mapped QTL interval. These resources allow for accurate characterization of QTL, and a route toward identification of the underlying causative genes and loci.
The DSPR is able to provide high resolution positional information on mapped QTL because the synthetic populations from which the RILs were derived were maintained as large, recombining populations for 50 generations (for simulation studies showing both the power and resolution of the resource, see King et al. 2012). Allowing these extra generations of recombination in an intercross leads to a trade-off between mapping resolution and equal founder representation. An increased number of generations will result in a greater number of recombination events, and higher mapping resolution. At the same time, the forces of selection and drift will have a longer time to operate, leading to greater variation in founder genotype representation. In the DSPR, the multiple rounds of recombination resulted in very small segment sizes (averaging just 3 cM), but came at a cost of unequal founder genotype representation across the genome (see Fig. 2). Unbalanced founder composition can lead to QTL going undetected if a variant unique to a set of missing founders is lost. In addition, multiple missing founders at a QTL location may lead to a much larger number of candidate causative variants being implicated, as we observed with QR6 (Table 1; Supplemental Table 5). However, such difficulties should not be pervasive in the DSPR because the number of founder genotypes at each position is still quite high, with on average 12 of the 15 founders present.
A feature of the DSPR, in common with the Collaborative Cross (Churchill et al. 2004) and the Arabidopsis MAGIC lines (Kover et al. 2009), is that phenotyping a single panel of strains allows one to simultaneously interrogate a large amount of genetic and functional diversity. Since alleles from each of the founders will be fixed on a range of otherwise highly variable genetic backgrounds, the phenotypic effects of founder haplotypes at QTL can be estimated accurately. The pattern of effects over founders—what we term QTL phasing—can in turn be employed to examine whether QTL are bi- or multiallelic, to estimate the frequency of alleles at the QTL (Macdonald and Long 2007), to distinguish tight linkage from pleiotropy (Macdonald and Long 2007), and to highlight a subset of the genes within QTL intervals that are most likely to harbor functional variation (Yalcin et al. 2005; Aylor et al. 2011; Keane et al. 2011).
We tested the performance of the DSPR by genetically dissecting overall activity and expression of the ADH enzyme, a classic quantitative character whose genetic basis is fairly well understood (Laurie-Ahlberg et al. 1980; King and McDonald 1987; Laurie-Ahlberg and Stam 1987; Laurie and Stam 1988, 1994; Choudhary and Laurie 1991; Stam and Laurie 1996). We were able to confirm that the DSPR is able to successfully recapitulate much of what is known about the natural genetics of ADH activity. In addition to mapping a large-effect QTL directly to Adh, where two causative polymorphisms were already known to reside, we precisely mapped several previously unidentified trans-acting factors each explaining just 2%–5% of the variation. These novel ADH activity QTL are mapped to intervals <1 Mb and, by virtue of our QTL phasing, implicate only a relatively small number of candidate genes and variants. Overall, our work in the DSPR maps QTL, contributing up to 60% to the genetic variation in ADH activity (Table 1). The remaining unexplained segregating variation is likely to map to sites having individually very small effects of perhaps <1%, which are extremely difficult to reliably identify with any mapping approach.
Our overall results suggest the genetics of ADH expression is more complex than previously known. A key advantage of the DSPR in terms of elucidating such complexity is the ability to detect and characterize QTL regions exhibiting a high degree of allelic heterogeneity. When multiple alleles are segregating in a region, each individual allele will often be at low frequency, and may go undetected in a GWAS. In contrast, although multiparent mapping panels only include a subset of the rare alleles segregating in a region, once sampled their detection is no longer dependent on their population frequency (Macdonald and Long 2007). Indeed the distribution of minor allele frequencies in the DSPR panel contains few rare alleles (frequencies <1%) while the Drosophila Genetic Reference Panel (DGRP) of 168 naturally derived, resequenced inbred lines contains an excess of rare alleles (Mackay et al. 2012). In this regard, linkage-based mapping methodologies employing multiple founding genotypes can complement population-based association studies such as the DGRP (Mackay et al. 2012), and allow investigators to characterize some of the “missing” heritability not captured by the GWAS approach (Manolio et al. 2009).
We show that the phenotypic means associated with each founder at mapped QTL can be used to identify a small set of genetic polymorphisms that likely includes the causative allele. If causative SNPs are often coding variants, the DSPR can quickly implicate a handful of genes and SNPs worthy of further study. Given the battery of molecular and functional genetic tools available for the D. melanogaster system, there are a number of routes available to experimentally validate the true causative allele. Alternatively, the total number of phase matching polymorphisms is sufficiently low that all could be confirmed using an association study framework (Mackay et al. 2012), incurring only a modest multiple testing penalty in comparison with a typical GWAS (perhaps P < 10−4 as opposed to P < 10−8).
Over the past 20 yr enormous scientific effort has focused on identifying the genetic variants underlying complex traits. However, we remain unable to explain more than a small percentage of the heritability for the vast majority of complex traits. The DSPR detects both small-effect (<5% of heritability) and low-frequency variants, and can explain a large fraction of the total segregating variation. As a genetic reference panel freely available to the community (FlyRILs.org) the DSPR allows multiple traits to be assayed in multiple environments, facilitating analyses of pleiotropy, genotype-by-environment and genotype-by-sex interactions, and ultimately providing a detailed picture of the underlying genetic architecture of complex traits.
Methods
Development of the eight-way RILs
Each synthetic population (pA and pB) was initiated with eight founder strains, seven unique to a population (A1–A7 or B1–B7), and one common to both populations (AB8). In the first generation, lines were intercrossed (e.g., A1 × A2, A2 × A3, … AB8 × A1), and 10 F1 flies per genotype per sex were used to establish the next generation. Adult F2 flies were used to seed two separate 1/2 gallon population bottles, and the two replicate subpopulations (pAr1 and pAr2 or pBr1 and pBr2) were maintained independently by transferring adults en masse to fresh bottles every 12–13 d.
At the F50 generation males and virgin females were used to initiate 576 pair matings for each of the four subpopulations. In the next, and in all subsequent generations, 1–3 single male × single virgin female crosses were set up for each incipient RIL. If all crosses for a given line at a given inbreeding generation failed, the line was maintained via a single mated female, and not considered to have been inbred for that generation. Inbreeding continued for up to 25 generations, leading to a total of ∼1700 completed RILs (minimum 20 generations of inbreeding, 81% inbred for 22–25 generations).
Genome sequencing
Using polytene squashes and genotyping assays (Andolfatto et al. 1999; Matzkin et al. 2005) we determined that two of the founders harbor a common cosmopolitan inversion: Founder A2 has In(3R)Payne and B5 has In(2L)t. We identified A2 individuals homozygous for the standard chromosome arrangement for genome sequencing but could not isolate homozygous standard B5 individuals (the strain appears to have a balanced lethal on chromosome 2L, as all B5 individuals tested were heterozygous for In(2L)t). As a result, for sequencing we created flies that are trans-heterozygous for the standard 2L from B5 against founder AB8 and against iso1 (y1; cn1 bw1 sp1), the sequenced strain of D. melanogaster (Adams et al. 2000).
For each of the 15 founders, the homozygous standard chromosome 3 arrangement of A2, both trans-heterozygous B5 genotypes, and four finished RILs, we isolated and purified DNA from 50 adult females. Following Qubit quantification (Invitrogen), 1–3 μg of DNA was sheared to ∼300 bp using a Covaris acoustic shearer, and used to generate paired-end Illumina DNA sequencing libraries. Libraries were run over two to three PE54 lanes on a GAII sequencer, and FASTQ files generated using the standard Illumina pipeline. Raw reads from the founders were aligned to the D. melanogaster genome (release 5.1) using MosaikAligner, custom scripts were used to create a pileup table for each founder, and pileup tables were collectively used to identify SNPs (see Supplemental Material).
RIL genotyping
To construct RAD libraries for each RIL we extracted and purified DNA from 12–15 females, and normalized all samples to 10 ng/μL using a NanoDrop ND-1000. To uniquely mark each of the 18 DNA plates, and control for sample mix-ups and plate spins, we included one sample of iso1 DNA in a different well of each plate. Multiplexed RAD libraries were made with 50 μL of diluted DNA using proprietary protocols (Floragenex), similar to those described in Baird et al. (2008), using SgrAI as the restriction endonuclease. Finished 96-plex RAD libraries were sequenced over two to three SE100 lanes on a GAII sequencer, or a single SE100 lane on a HiSEQ2000.
The FASTQ files were processed using a custom Perl script that stripped the barcodes from any given lane of reads, and generated 96 new barcode-specific FASTQ files. The barcode-stripped, lane-specific FASTQ files were processed with the same pipeline used for the founders to generate 1710 pileup tables, one for each genotyped sample (1692 RILs, and 18 replicate iso1 samples). We filtered candidate RAD markers to retain those SNPs that (1) also scored as a SNP in the founders, (2) had non-zero coverage for at least 50% of the RILs, (3) were heterozygous in <20% of the RILs, and (4) assuming coverage was >10 in the iso 1samples, showed <0.05 heterozygosity in iso1. The final set of 10,275 high-quality SNP markers represents 4026 SgrAI restriction cut sites.
Five RILs were excluded from our analysis due to insufficient read coverage. The genotype data also indicated that 12 of the RILs had high heterozygosity over much of the genome, indicating a post-inbreeding contamination event. In addition, we detected five RILs that appear to have been contaminated either prior to, or very early during the inbreeding process. These latter events were detected by first identifying a set of diagnostic alleles for each ancestral synthetic population, i.e., alleles fixed in pA but segregating as SNPs in pB, and vice versa. A RIL harboring a large fraction of alleles diagnostic for the alternate population strongly suggests a contamination event. Overall, we successfully obtained genotype data for 1670 RILs.
Determining founder ancestry across the genome of each RIL
We constructed an HMM to infer the underlying founder ancestry of each genomic segment in each RIL, utilizing the set of biallelic SNPs identified in the RILs and founders (King et al. 2012). We followed standard methods for HMMs (Rabiner 1989; Mott et al. 2000; Mann 2006; Broman and Sen 2009) and assumed a genotyping error rate of 0.5%. Transition probabilities were defined as the probability of a recombination event occurring between any given pair of markers and were initially estimated from the map conversion tables available on FlyBase, and scaled up to correspond to the multiple generations of recombination experienced by the DSPR. In D. melanogaster crossing over only occurs in females and the FlyBase map is in female units. Therefore, the autosomes effectively experience 25 generations of recombination, and the X chromosome (which spends 2/3 of the time in females) experiences 33.3 generations of recombination. Our expected map expansion following the completion of both the recombination and inbreeding phases is 27 for autosomes and 35 for the X chromosome (Teuscher and Broman 2007). The HMM calculates, at each marker, for each RIL, the eight probabilities the marker is derived from each of the eight founders (homozygous states), and the 28 probabilities the underlying state segregates for two founder genotypes (heterozygous states).
Phenotyping alcohol dehydrogenase (ADH) enzyme activity
We adapted the colorimetric, kinetic ADH enzyme assay described in Clark and Wang (1994), and controlled for variation in the total amount of protein present in any given homogenate via a Bradford assay (see Supplemental Material). At the end of data collection, each test genotype (15 founders and 1737 RILs) was assigned a mean normalized ADH activity measure based on an average on 8.08 biological and technical assay replicates. RIL phenotype means are provided in Supplemental Table 7.
Estimating heritability
Broad sense heritability of ADH activity in pA and pB was estimated by calculating the genetic and phenotypic variance components from a linear mixed model using the lme and VarCorr functions in the nlme package in R (Pinheiro et al. 2011). We estimated the heritability of RIL means as the estimated genetic variance component over the total variance of RIL means.
QTL mapping
To perform QTL mapping, we converted the 36 state probabilities described above to eight additive probabilities by assuming heterozygous states are intermediate between the two homozygous states. These additive probabilities and the 36 raw state probabilities are available both at http://FlyRILs.org/Data and as a set of R packages (DSPRqtlDataA and DSPRqtlDataB; see http://FlyRILs.org/Tools/Tutorial for a step-by-step tutorial). We have also released an R package (DSPRqtl) to facilitate data analysis for users (see http://FlyRILs.org/Tools/Tutorial for a step-by-step tutorial).
We performed QTL mapping in two stages, both of which were implemented using R (R Development Core Team 2011). First, we performed a multiple regression, regressing our measure of ADH activity on the eight additive probabilities with no covariates, separately for the pA and pB populations. We converted the resulting F-statistic to a LOD score (Broman and Sen 2009), and determined the genome-wide significance threshold via 1000 permutations (Churchill and Doerge 1994). Second, we performed standard interval mapping (Lander and Botstein 1989; Broman and Sen 2009) locally around each mapped QTL to localize peaks more precisely and estimate confidence intervals. A conservative 2-LOD support interval was used to estimate confidence intervals on the locations of all QTL.
To help identify additional QTL influencing ADH activity, we performed a second analysis that statistically controls for the effects of the two known causative polymorphisms at Adh (F/S and ∇1). We performed genome scans separately for pA and pB as above but included allele class as a covariate. We considered three hierarchical models:
where μ is the grand mean, A is allele class at Adh, and Gi is the ith founder genotype probability. We then calculated three LOD scores by comparing the likelihoods (LL) of the three models:
with thresholds identified via permutation tests (Churchill and Doerge 1994). The significance of the additive genetic effect is indicated by LODA. We determined significance of the interaction effect according to the recommendations of Broman and Sen (2009) by testing for a significant interaction term only at locations where LODF is significant, with no additional correction for multiple tests. Finding no evidence for interaction effects, we corrected the ADH activity phenotype for the F/S and ∇1 polymorphisms for both pA and pB together to better facilitate later comparisons between the two populations using the model:
We subsequently performed genome scans separately for pA and pB using the residuals from this model to localize any additively acting QTL.
Identifying candidate causative sequence polymorphisms
To categorize founders into QTL allelic classes, we only used RILs that had a single founder type with >95% certainty at the QTL peak. After assigning these RILs a hard founder genotype, we ranked the founder genotype means at the peak. We then fit a series of models with an increasing number of partitions among the ranked founder groups until adding an additional group did not significantly improve the fit of the model. The general method is as follows. The optimal first partition is found by performing a set of ANOVAs with the founders in all possible sets of two distinct “high” and “low” classes, and choosing the model with the highest F-value as the best two-class partition. This two-class partition model is compared to the model with all founders belonging to a single group using an F-test. If the two-class model is a significantly better fit than the single class model (at P < 10−4), this partition is fixed and all possible three-class models (that include the fixed optimal two-class partition) are tested. Once again, we choose the model with the highest F-value as the optimal model for that round, and then test this optimal three-class model fit against the optimal two-class model fit. This process continues until adding an additional partition does not result in a significantly better fit.
To identify SNPs and indels that match the predicted allelic configuration for each QTL we used the following procedure. For the large Adh-associated QTL we identify three allelic groups from the founder means: (1) A1, A2, B7; (2) B3; (3) A4, A5, A6, A7, B1, B2, B4, B6, AB8. At this QTL position, none of the RILs have the founder A3 or founder B5 genotype. In addition, the state of the underlying polymorphisms in B3 is equally likely to match the “low” or “high” group (Fig. 4). We scanned the 350-kb region underlying the QTL (2L:14,330,000..14,680,000) to identify all polymorphisms that perfectly match the pattern implied by the QTL phasing, i.e., 22?1111111?1??21 for founders A1–A7, AB8, B1–B7, AB8. Polymorphisms were identified from the SAMtools-derived consensus sequences associated with the founder genomes. For many QTL we could combine the phase-matching patterns for the pA and pB populations based on the phase assignment for founder AB8 (the founder shared by both populations). In other cases AB8 was missing, or its phase was poorly inferred, and the phasing associated with populations pA and pB took on two possible configurations.
Data access
All data associated with the DSPR project are hosted at FlyRILs.org, along with a form allowing users to request fly lines, and the R/DSPRqtl analytical software we have developed (this package can be installed directly within R—see FlyRILs.org/Tools/Tutorial/index.html for details). The raw sequence reads from this study have been submitted to the NCBI Sequence Read Archive (SRA) (http://www.ncbi.nlm.nih.gov/sra) under accession no. SRA051306 (RIL RAD genotyping) and SRA051316 (founder resequencing).
Acknowledgments
We thank Tara Marriage, Chad Mills, Brian Sanderson, and Eric Schmidt for help with experimental work, the UCI Genomics High Throughput Facility for sequencing, and three anonymous reviewers for insightful comments. This work was supported by the following NIH R01 grants: RR024862 to S.J.M. and A.D.L., GM085260 to S.J.M., GM085251 to A.D.L., GM078338 to S.S., and GM074244 to K.W.B.
Footnotes
[Supplemental material is available for this article.]
Article published online before print. Article, supplemental material, and publication date are at http://www.genome.org/cgi/doi/10.1101/gr.134031.111.
Freely available online through the Genome Research Open Access option.
References
- Adams MD, Celniker SE, Holt RA, Evans CA, Gocayne JD, Amanatides PG, Scherer SE, Li PW, Hoskins RA, Galle RF, et al. 2000. The genome sequence of Drosophila melanogaster. Science 287: 2185–2195 [DOI] [PubMed] [Google Scholar]
- Andolfatto P, Wall JD, Kreitman M 1999. Unusual haplotype structure at the proximal breakpoint of In(2L)t in a natural population of Drosophila melanogaster. Genetics 153: 1297–1311 [DOI] [PMC free article] [PubMed] [Google Scholar]
- Aylor DL, Valdar W, Foulds-Mathes W, Buus RJ, Verdugo RA, Baric RS, Ferris MT, Frelinger JA, Heise M, Frieman MB, et al. 2011. Genetic analysis of complex traits in the emerging Collaborative Cross. Genome Res 21: 1213–1222 [DOI] [PMC free article] [PubMed] [Google Scholar]
- Baird NA, Etter PD, Atwood TS, Currey MC, Shiver AL, Lewis ZA, Selker EU, Cresko WA, Johnson EA 2008. Rapid SNP discovery and genetic mapping using sequenced RAD markers. PLoS ONE 3: e3376 doi: 10.1371/journal.pone.0003376 [DOI] [PMC free article] [PubMed] [Google Scholar]
- Broman KW 2005. The genomes of recombinant inbred lines. Genetics 169: 1133–1146 [DOI] [PMC free article] [PubMed] [Google Scholar]
- Broman KW, Sen S 2009. A guide to QTL mapping with R/qtl. Springer, New York [Google Scholar]
- Buckler ES, Holland JB, Bradbury PJ, Acharya CB, Brown PJ, Browne C, Ersoz E, Flint-Garcia S, Garcia A, Glaubitz JC, et al. 2009. The genetic architecture of maize flowering time. Science 325: 714–718 [DOI] [PubMed] [Google Scholar]
- Choudhary M, Laurie CC 1991. Use of in vitro mutagenesis to analyze the molecular basis of the difference in Adh expression associated with the allozyme polymorphism in Drosophila melanogaster. Genetics 129: 481–488 [DOI] [PMC free article] [PubMed] [Google Scholar]
- Churchill GA, Doerge RW 1994. Empirical threshold values for quantitative trait mapping. Genetics 138: 963–971 [DOI] [PMC free article] [PubMed] [Google Scholar]
- Churchill GA, Airey DC, Allayee H, Angel JM, Attie AD, Beatty J, Beavis WD, Belknap JK, Bennett B, Berrettini W, et al. 2004. The Collaborative Cross, a community resource for the genetic analysis of complex traits. Nat Genet 36: 1133–1137 [DOI] [PubMed] [Google Scholar]
- Clark AG, Wang L 1994. Comparative evolutionary analysis of metabolism in 9 Drosophila species. Evolution 48: 1230–1243 [DOI] [PubMed] [Google Scholar]
- Dzitoyeva S, Dimitrijevic N, Manev H 2003. γ-Aminobutyric acid B receptor 1 mediates behavior-impairing actions of alcohol in Drosophila: Adult RNA interference and pharmacological evidence. Proc Natl Acad Sci 100: 5485–5490 [DOI] [PMC free article] [PubMed] [Google Scholar]
- Hirschhorn JN, Gajdos ZK 2011. Genome-wide association studies: Results from the first few years and potential implications for clinical medicine. Annu Rev Med 62: 11–24 [DOI] [PubMed] [Google Scholar]
- Huang X, Paulo MJ, Boer M, Effgen S, Keizer P, Koornneef M, van Eeuwijk FA 2011. Analysis of natural allelic variation in Arabidopsis using a multiparent recombinant inbred line population. Proc Natl Acad Sci 108: 4488–4493 [DOI] [PMC free article] [PubMed] [Google Scholar]
- Keane TM, Goodstadt L, Danecek P, White MA, Wong K, Yalcin B, Heger A, Agam A, Slater G, Goodson M, et al. 2011. Mouse genomic variation and its effect on phenotypes and gene regulation. Nature 477: 289–294 [DOI] [PMC free article] [PubMed] [Google Scholar]
- King JJ, McDonald JF 1987. Post-translational control of alcohol dehydrogenase levels in Drosophila melanogaster. Genetics 115: 693–699 [DOI] [PMC free article] [PubMed] [Google Scholar]
- King EG, Macdonald SJ, Long AD 2012. Properties and power of the Drosophila Synthetic Population Resource for the routine dissection of complex traits. Genetics 191 doi: 10.1534/genetics.112.138537 [DOI] [PMC free article] [PubMed] [Google Scholar]
- Kover PX, Valdar W, Trakalo J, Scarcelli N, Ehrenreich IM, Purugganan MD, Durrant C, Mott R 2009. A Multiparent Advanced Generation Inter-Cross to fine-map quantitative traits in Arabidopsis thaliana. PLoS Genet 5: e1000551 doi: 10.1371/journal.pgen.1000551 [DOI] [PMC free article] [PubMed] [Google Scholar]
- Lander ES, Botstein D 1989. Mapping Mendelian factors underlying quantitative traits using RFLP linkage maps. Genetics 121: 185–199 [DOI] [PMC free article] [PubMed] [Google Scholar]
- Laurie CC, Stam LF 1988. Quantitative analysis of RNA produced by slow and fast alleles of Adh in Drosophila melanogaster. Proc Natl Acad Sci 85: 5161–5165 [DOI] [PMC free article] [PubMed] [Google Scholar]
- Laurie CC, Stam LF 1994. The effect of an intronic polymorphism on alcohol dehydrogenase expression in Drosophila melanogaster. Genetics 138: 379–385 [DOI] [PMC free article] [PubMed] [Google Scholar]
- Laurie CC, Bridgham JT, Choudhary M 1991. Associations between DNA sequence variation and variation in expression of the Adh gene in natural populations of Drosophila melanogaster. Genetics 129: 489–499 [DOI] [PMC free article] [PubMed] [Google Scholar]
- Laurie-Ahlberg CC, Maroni G, Bewley GC, Lucchesi JC, Weir BS 1980. Quantitative genetic variation of enzyme activities in natural populations of Drosophila melanogaster. Proc Natl Acad Sci 77: 1073–1077 [DOI] [PMC free article] [PubMed] [Google Scholar]
- Laurie-Ahlberg CC, Stam LF 1987. Use of P-element-mediated transformation to identify the molecular basis of naturally occurring variants affecting Adh expression in Drosophila melanogaster. Genetics 115: 129–140 [DOI] [PMC free article] [PubMed] [Google Scholar]
- Macdonald SJ, Long AD 2007. Joint estimates of quantitative trait locus effect and frequency using synthetic recombinant populations of Drosophila melanogaster. Genetics 176: 1261–1281 [DOI] [PMC free article] [PubMed] [Google Scholar]
- Mackay TF 2001. The genetic architecture of quantitative traits. Annu Rev Genet 35: 303–339 [DOI] [PubMed] [Google Scholar]
- Mackay TF 2010. Mutations and quantitative genetic variation: Lessons from Drosophila. Philos Trans R Soc Lond B Biol Sci 365: 1229–1239 [DOI] [PMC free article] [PubMed] [Google Scholar]
- Mackay TF, Richards S, Stone EA, Barbadilla A, Ayroles JF, Zhu D, Casillas S, Han Y, Magwire MM, Cridland JM, et al. 2012. The Drosophila melanogaster Genetic Reference Panel. Nature 482: 173–178 [DOI] [PMC free article] [PubMed] [Google Scholar]
- Mann TP. 2006. Numerically stable hidden Markov model implementation. http://bozeman.genome.washington.edu/compbio/mbt599_2006/hmm_scaling_revised.pdf.
- Manolio TA, Collins FS, Cox NJ, Goldstein DB, Hindorff LA, Hunter DJ, McCarthy MI, Ramos EM, Cardon LR, Chakravarti A, et al. 2009. Finding the missing heritability of complex diseases. Nature 461: 747–753 [DOI] [PMC free article] [PubMed] [Google Scholar]
- Matzkin LM, Merritt TJ, Zhu CT, Eanes WF 2005. The structure and population genetics of the breakpoints associated with the cosmopolitan chromosomal inversion In(3R)Payne in Drosophila melanogaster. Genetics 170: 1143–1152 [DOI] [PMC free article] [PubMed] [Google Scholar]
- McCarthy MI, Abecasis GR, Cardon LR, Goldstein DB, Little J, Ioannidis JP, Hirschhorn JN 2008. Genome-wide association studies for complex traits: Consensus, uncertainty and challenges. Nat Rev Genet 9: 356–369 [DOI] [PubMed] [Google Scholar]
- McMullen MD, Kresovich S, Villeda HS, Bradbury P, Li H, Sun Q, Flint-Garcia S, Thornsberry J, Acharya C, Bottoms C, et al. 2009. Genetic properties of the maize nested association mapping population. Science 325: 737–740 [DOI] [PubMed] [Google Scholar]
- Mott R, Talbot CJ, Turri MG, Collins AC, Flint J 2000. A method for fine mapping quantitative trait loci in outbred animal stocks. Proc Natl Acad Sci 97: 12649–12654 [DOI] [PMC free article] [PubMed] [Google Scholar]
- Nuzhdin SV, Pasyukova EG, Dilda CL, Zeng ZB, Mackay TF 1997. Sex-specific quantitative trait loci affecting longevity in Drosophila melanogaster. Proc Natl Acad Sci 94: 9734–9739 [DOI] [PMC free article] [PubMed] [Google Scholar]
- Philip VM, Sokoloff G, Ackert-Bicknell CL, Striz M, Branstetter L, Beckmann MA, Spence JS, Jackson BL, Galloway LD, Barker P, et al. 2011. Genetic analysis in the Collaborative Cross breeding population. Genome Res 21: 1223–1238 [DOI] [PMC free article] [PubMed] [Google Scholar]
- Pinheiro J, Bates D, DebRoy S, Sarkar D, R Development Core Team 2011. nlme: Linear and Nonlinear Mixed Effects Models. R package version 3.1-101 [Google Scholar]
- Pritchard JK 2001. Are rare variants responsible for susceptibility to complex diseases? Am J Hum Genet 69: 124–137 [DOI] [PMC free article] [PubMed] [Google Scholar]
- Pritchard JK, Cox NJ 2002. The allelic architecture of human disease genes: Common disease–common variant…or not? Hum Mol Genet 11: 2417–2423 [DOI] [PubMed] [Google Scholar]
- R Development Core Team. 2011. R: A language and environment for statistical computing. R Foundation for Statistical Computing. http://www.R-project.org/
- Rabiner LR 1989. A tutorial on hidden Markov models and selected applications in speech recognition. Proc IEEE 77: 257–286 [Google Scholar]
- Reich DE, Lander ES 2001. On the allelic spectrum of human disease. Trends Genet 17: 502–510 [DOI] [PubMed] [Google Scholar]
- Rockman MV, Kruglyak L 2008. Breeding designs for recombinant inbred advanced intercross lines. Genetics 179: 1069–1078 [DOI] [PMC free article] [PubMed] [Google Scholar]
- Stam LF, Laurie CC 1996. Molecular dissection of a major gene effect on a quantitative trait: The level of alcohol dehydrogenase expression in Drosophila melanogaster. Genetics 144: 1559–1564 [DOI] [PMC free article] [PubMed] [Google Scholar]
- Teuscher F, Broman KW 2007. Haplotype probabilities for multiple-strain recombinant inbred lines. Genetics 175: 1267–1274 [DOI] [PMC free article] [PubMed] [Google Scholar]
- Weiss KM, Terwilliger JD 2000. How many diseases does it take to map a gene with SNPs? Nat Genet 26: 151–157 [DOI] [PubMed] [Google Scholar]
- Yalcin B, Flint J, Mott R 2005. Using progenitor strain information to identify quantitative trait nucleotides in outbred mice. Genetics 171: 673–681 [DOI] [PMC free article] [PubMed] [Google Scholar]
- Yang J, Benyamin B, McEvoy BP, Gordon S, Henders AK, Nyholt DR, Madden PA, Heath AC, Martin NG, Montgomery GW, et al. 2010. Common SNPs explain a large proportion of the heritability for human height. Nat Genet 42: 565–569 [DOI] [PMC free article] [PubMed] [Google Scholar]
- Zhu Q, Ge D, Maia JM, Zhu M, Petrovski S, Dickson SP, Heinzen EL, Shianna KV, Goldstein DB 2011. A genome-wide comparison of the functional properties of rare and common genetic variants in humans. Am J Hum Genet 88: 458–468 [DOI] [PMC free article] [PubMed] [Google Scholar]