

Abstract
A quantitative and highly sensitive method for the analysis of glycosaminoglycan (GAG)-derived disaccharides is presented that relies on capillary electrophoresis (CE) with laser-induced fluorescence (LIF) detection. This method enables complete separation of seventeen GAG-derived disaccharides in a single run. Unsaturated disaccharides were derivatized with 2-aminoacridone (AMAC) to improve sensitivity. The limit of detection was at the attomole level and about 100-fold more sensitive than traditional CE-ultraviolet detection. A CE separation timetable was developed to achieve complete resolution and shorten analysis time. The RSD of migration time and peak areas at both low and high concentrations of unsaturated disaccharides are all less than 2.7% and 3.2%, respectively, demonstrating that this is a reproducible method. This analysis was successfully applied to cultured Chinese hamster ovary cell samples for determination of GAG disaccharides. The current method simplifies GAG extraction steps, and reduces inaccuracy in calculating ratios of heparin/heparan sulfate to chondroitin sulfate/dermatan sulfate, resulting from the separate analyses of a single sample.
Keywords: 2-aminoacridone, capillary electrophoresis, chondroitin /dermatan sulfate, heparan sulfate /heparin, hyaluronan, glycosaminoglycan
Proteoglycans (PGs)1 are a group of glycoconjugates ubiquitously presented in the extracellular matrix and on the surface of all eukaryotic cells, as well in basement membranes of various tissues, where they participate in many cellular, physiological and pathological processes, such as chemokine and cytokine activation, microbial recognition, tissue morphogenesis during embryonic development, immune response, tumor progression and invasion [1–6]. PGs are composed of various core proteins post-translationally modified with one to >100 long, unbranched, and anionic polysaccharides, called glycosaminoglycans (GAGs) [7]. GAGs are composed of repeating disaccharide units of hexuronic acid, D-glucuronic acid (GlcA) and/or its C5-epimer L-iduronic acid (IdoA), and hexosamine, D-glucosamine (GlcN) or D-galactosamine (GalN) [8–10]. With the exception of hyaluronic acid (HA), GAGs are sulfated polysaccharides with complex structures different based on degree of charge, pattern of sulfo group substitution, and hexuronic acid epimerization [4, 11]. There are three major classes of GAGs in animals differing by their polysaccharide backbone structure: HA, heparan sulfate (HS)/heparin (HP), and chondroitin sulfate (CS)/ dermatan sulfate (DS). HA, the simplest GAG, containing neither sulfo groups nor is it attached to a core protein, is composed of a →3) α-GlcNAc (1→4) α-GlcA (1→ repeating unit (where Ac is acetyl). HS/HP are O-sulfo group substituted GAGs with →4) α-GlcNAc or α-GlcNS (1→4) β-GlcA or α-IdoA (1→ repeating units (where S is sulfo). CS/DS are O-sulfo group substituted GAGs with →3) α-GalNAc (1→4) β-GlcA or α-IdoA (1→ repeating units [11]. Biosynthesis of GAGs takes place in Golgi, begins with stepwise addition of four monosaccharides, acting as a tetrasaccharide linker on a core protein serine residue in the endoplasmic reticulum [7]. Sugar chain elongation of GAGs then occurs as sequential addition of uridine diphosphate (UDP)-GlcNAc and UDP-GlcA, determining the GAG chain belongs to HS/HP family, or as addition of UDP-GalNAC and UDP-GlcA, determining the GAG chain belongs to CS/DS family. Then the growing chains of GAGs can be modified at various positions: N-deacetylation/N-sulfonation of GlcNAc units catalyzed by N-deacetylase/N-sulfotransferases in HS/HP chains; C-5 epimerization of GlcA to IdoA catalyzed by C-5 epimerase in HS/HP and also DS chains, and modification of IdoA catalyzed by 2-O-sulfotransferase can then take place; O-sulfonation in GlcNAc units catalyzed by 3-O-sulfotransferase and 6-O-sulfotransferase in HS/HP, and O-sulfonation in GalNAc units catalyzed by 4-O-sulfotransferase or 6-O-sulfotransferase [7, 12–13]. These post-polymerization enzymatic modification steps result in a heterogeneity and diversity in the disaccharide residues of GAG polysaccharide chains as well as the polydispersity of chain sizes, all of which are responsible for the crucial biological functions of GAGs, for example, HS/HP are implicated in critical biological processes, such as regulation of enzymatic catalysis in the coagulation cascade, cell-cell interactions [14–15] and CS/DS may be involved in participating and mediating cell-cell interactions and cellular communication [16].
GAGs are extremely difficult to analyze because of their negative charge, polydispersity, and structural heterogeneity [17]. A common strategy of detailed structural analysis of GAGs involves the enzymatic depolymerization of GAGs to obtain their disaccharide constituents. The GAG disaccharides produced by exhaustive lyase-catalyzed digestion contain an Δ-unsaturated hexuronic acid (ΔUA) at their non-reducing end with an unique absorbance at 232 nm [18–19] and a molar extinction coefficient of approximately 6000 M−1cm−1 [20]. Exhaustive heparin lyase treatment of HS/HP affords eight major HS/HP-derived disaccharides. There are also a several of rare HS/HP-derived disaccharides that can be formed from among the 23 possible known disaccharide sequences [12]. Chondroitin lyase treatment of CS/DS or HA produces eight CS/DS disaccharides and one HA disaccharide. The structures of seventeen commercially available, lyase-prepared HS/HP, CS/DS and HA disaccharides are shown in Table 1. Following the sequential enzymatic treatment, quantitative disaccharide analysis was applied to explore the structural information, which are directly related to biological functions of GAGs. Modern separation techniques, such as high-performance liquid chromatography (HPLC) [21–23], ultra-performance liquid chromatography (UPLC) [24–25], gel permeation chromatography (GPC) [26–27], polyacrylamide gel electrophoresis (PAGE) [28], and capillary electrophoresis (CE) have been applied to GAG analysis to help solve many complex structures [29–32].
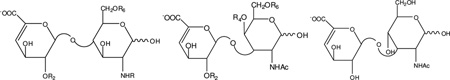
Table 1.
The structures of the seventeen ΔUA-disaccharide standards from HP/HS, CS/DS and HA
 | |||||
|---|---|---|---|---|---|
| Reference number |
Disaccharide | Structure | R | ||
| HS/HP disaccharides, up left | R2 | R6 | R | ||
| 1 | TriSHS | ΔUA(2S)-GlcNS(6S) | SO3− | SO3− | SO3− |
| 2 | 2S6SHS | ΔUA(2S)-GlcNAc(6S) | SO3− | SO3− | Ac |
| 3 | 2SNSHS | ΔUA(2S)-GlcNS | SO3− | H | SO3− |
| 4 | NS6SHS | ΔUA-GlcNS(6S) | H | SO3− | SO3− |
| 5 | 2SHS | ΔUA(2S)-GlcNAc | SO3− | H | Ac |
| 6 | 6SHS | ΔUA-GlcNAc(6S) | H | SO3− | Ac |
| 7 | NSHS | ΔUA-GlcNS | H | H | SO3− |
| 8 | 0SHS | ΔUA-GlcNAc | H | H | Ac |
| CS/DS disaccharides, up middle | R2 | R4 | R6 | ||
| 9 | TriSCS | ΔUA(2S)-GalNAc(4S)(6S) | SO3− | SO3− | SO3− |
| 10 | SDCS | ΔUA(2S)-GalNAc(6S) | SO3− | H | SO3− |
| 11 | SBCS | ΔUA(2S)-GalNAc(4S) | SO3− | SO3− | H |
| 12 | SECS | ΔUA-GalNAc(4S)(6S) | H | SO3− | SO3− |
| 13 | 2SCS | ΔUA(2S)-GalNAc | SO3− | H | H |
| 14 | 6SCS | ΔUA-GalNAc(6S) | H | H | SO3− |
| 15 | 4SCS | ΔUA-GalNAc(4S) | H | SO3− | H |
| 16 | 0SCS | ΔUA-GalNAc | H | H | Ac |
| HA disaccharide, up right | |||||
| 17 | 0SHA | ΔUA-GlcNAc | H | H | H |
CE is one of the most powerful techniques for GAG analysis because of its high sensitivity, resolving power, and separation efficiency, combined with short analysis time, straightforward operation [33], and its compatibility with a variety of detection methods, including ultraviolet (UV) spectroscopy, mass spectrometry (MS) [34], nuclear magnetic resonance (NMR) spectroscopy and LIF [29, 35–36]. Analysis of GAGs, performed by CE with both normal and reversed polarity [37–38], has been previously reviewed [33, 39]. In reversed polarity, low pH is used to reduce electroosmotic flow and the analyte, applied at the cathode, migrates under electrophoresis towards the detector at the anode. Determination of disaccharides from complex biological sample containing only a few micrograms of GAGs often requires higher sensitivity than is typically associated with UV detection and some GAG disaccharides do not have a 4-deoxy-α-L-threo-hex-4-enopyranosyluronic acid (ΔUA) residue for UV detection at 232 nm [40–41]. Moreover, limited repeatability of migration time and peak areas resulting from complex biological matrix and microheterogeneity in separation environment, poses significant challenges to GAG analysis by CE. The conjugation of a fluorophore can greatly increase detection sensitivity using LIF [42]. One of the most frequently used derivatization methods is reductive amination of carbohydrates, which frequently relies on aromatic fluorescent amines including, 2-aminopyridine (2-AP) [43], 8-aminopyrene-1,3,6-trisulfonate (APTS) [44], 8-aminonaphthalene-1,3,6-trisulfonic acid (ANTS) [45], and 2-aminoacridone (AMAC) [29, 42]. AMAC is neutral and highly fluorescent with λex = 428 nm and λem = 525 nm, and has been previously used to GAG analysis using reversed polarity [29, 42, 46]. Militsopoulou et al. were able to resolve eight major and four minor HS/HP AMAC-labeled disaccharide standards in a single run respectively using 50 mM phosphate buffer, pH 3.5, and reversed polarity at 30 kV, with sensitivities ten-fold greater than those previously achieved with UV detection at 232 nm [29, 42]. Hitchcock et al. were able to resolve eleven of the twelve (8 major and 3 of the 4 rare) HP/HS AMAC-labeled disaccharides and eight CS/DS AMAC-labeled standard disaccharides in separate runs with 50 mM phosphate buffer, pH 3.5, and reversed polarity at 30 kV with disaccharide quantities as low as 1 pmol prior to derivatization [32]. While this was an extraordinary achievement, it required two separate and independent analyses. Currently, all reported methods using CE-LIF for determination of GAG disaccharides require separate recoveries from multiple lyase-digestion steps, and separate analyses of HS/HP and CS/DS in two chromatographic runs, resulting in a complicated and time-consuming analytical process. In addition, the resulting data from different analyses can introduce inaccuracy to the calculated ratio of HS/HP and CS/DS GAGs present in one sample. Here we present a simplified procedure to analyze seventeen AMAC-labeled disaccharides prepared from HS/HP, CS/DS and HA by a single CE-LIF experiment, and it was successfully applied to GAG-derived disaccharides analysis from biological source
Materials and methods
Materials
Vivapure Q Mini H spin columns were purchased from Sartoriou Stedim Biotech (Bohemia, NY, USA). Unsaturated disaccharide standards of CS/DS (0SCS: ΔUA-GalNAc, 4SCS: ΔUA-GalNAc4S, 6SCS: ΔUAGalNAc6S, 2SCS: ΔUA2S-GalNAc, SBCS: ΔUA2S-GalNAc4S, SDCS: ΔUA2S-GalNAc6S, SECS: ΔUA-GalNAc4S6S, TriSCS: ΔUA2S-GalNAc4S6S), unsaturated disaccharide standards of HS/HP (0SHS: ΔUA-GlcNAc, NSHS: ΔUA-GlcNS, 6SHS: ΔUA-GlcNAc6S, 2SHS: ΔUA2S-GlcNAc, 2SNSHS: ΔUA2S-GlcNS, NS6SHS: ΔUA-GlcNS6S, 2S6SHS: ΔUA2S-GlcNAc6S, TriSHS: ΔUA2S-GlcNS6S), and unsaturated disaccharide standard of HA (0SHA: ΔUA-GlcNAc) were obtained from Seikagaku Co. Japan. Internal standard IS: ΔUA2S-GlcNCOEt6S was from Iduron Co. Manchester, U.K.. AMAC and sodium cyanoborohydride (NaCNBH3) were from Sigma-Aldrich, St. Louis, USA. Actinase E was from Kaken Biochemicals, Japan. Chondroitin lyase ABC from Proteus vulgaris and chondroitin lyase ACII from Arthrobacter aurescens was from Seikagaku Co., Japan. Recombinant Flavobacterial heparin lyase I, II, and III were expressed in our laboratory using E. coli strains, provided by Professor Jian Liu, University of North Carolina, College of Pharmacy, Chapel Hill, NC, USA. All other chemicals were of HPLC grade.
CHO-S cell culture
Suspension adapted CHO-S cells were grown in CD–CHO medium supplemented with 2% HT (hypoxanthine/thymidine mixture, Gibco–Invitrogen, Carlsbad, CA, USA) and 8 mM Glutamax (Gibco–Invitrogen, Carlsbad, CA, USA). The cells were incubated in a 5% CO2 and 37 °C incubator. For routine maintenance, cells were seeded at 2×10⁵ cells/mL fresh media and cells were subcultured every 3 to 4 days. Cell viability was measured with hemocytometry and trypan blue exclusion method.
Recovery of GAGs from CHO-S cells by strong anion exchange column
CHO-S cells (1 × 10⁷) was freeze-dried overnight and incubated with actinase E (2mg/mL) in 1 mL solution at 55 ° C for 20 h [47]. After remove the particulates from the resulting solutions by a 0.22 µm membrane, the peptides was removed by a Microcon Centrifugal Filter Units YM-10 (10 k MWCO) by centrifuging at 10,000 × g. Then residual GAGs on membrane was collected and purified by Vivapure MINI Q H spin column by eluting with three 300 µL washes each of water, 0.2 M, 0.5 M and 16% NaCl. The 0.5 M and 16% aqueous NaCl washes were each desalted by a Microcon Centrifugal Filter Units YM-10 (10 k MWCO) by centrifuging at 10,000 × g. Then GAGs were recovered from top layer and lyophilized for disaccharide analysis.
Preparation of Δ-disaccharides from GAGs
CS/DS GAGs from CHO-S cells were converted to disaccharides by enzymatic treatment with chondroitin lyase ABC (10 m-units) and chondroitin lyase ACII (10 m-units) for 10 h at 37 °C. After boiling the chondroitin lyases at 100 °C for 2 min to inactivate and cooling to room temperature, the HS/HP in GAGs were converted to disaccharides by enzymatic treatment with a mixture of heparin lyase I, II, and III (10 mU each) for 10 h at 37 °C. All the disaccharides were recovered using a 30 kDa MWCO spin column (Millipore, USA) and freeze-dried.
Derivatization of Δ-unsaturated disaccharides with AMAC
A mixture of seventeen ΔUA-disaccharide standards (5 µg/per each disaccharide), or freeze-dried ΔUA-disaccharides from biological samples (roughly 5 µg/per each disaccharide) and internal standard ΔUA2S-GlcNCOEt6S were added to a 10 µL 0.1 M AMAC solution in acetic acid /dimethyl sulfoxide (3:17, v/v) and mixed by vortexing for 5 min. Next, 10 µL of 1 M NaBH3CN was added to the reaction mixture and incubated at 45 °C for 4 h [48]. Finally, the AMAC-derivatized ΔUA-disaccharide mixtures were diluted to different concentrations with 50% (v/v) aqueous dimethyl sulfoxide and CE-LIF analysis was performed.
Conditions for CE-LIF analysis
CE analyses were performed on an HPCE system (Agilent Technologies) equipped with a ZETALIF (Picometrics, France) detector (Δex = 488 nm). Resolution and analysis were performed on an uncoated fused-silica capillary column (50 µm ID, 85 cm total length, 70 cm effective length) at 25 °C, using 50 mM phosphate buffer, pH 3.5, at different voltages, as shown in figures, reversed polarity. New capillary was treated with methanol, 1M HCl, 1M NaOH, 0.1 M NaOH, water and operating buffer, until the baseline got constant. Between each run, the capillary was flushed with 0.1 M NaOH (3 min), HPLC grade water (3 min), and operating buffer (4 min). The operating buffer was filtrated through a 0.2 µm membrane filter. All solutions were degassed. Samples were introduced using the pressure mode (50 mbar × 5 s) at the cathode.
Conditions for UPLC-MS analysis
LC-MS analyses were performed on an Agilent 1200 LC/MSD instrument (Agilent Technologies, Inc. Wilmington, DE) equipped with a 6300 ion-trap. The column used was an Acquity UPLC BEH C18 column (2.1 × 150 mm, 1.7 µm, Waters, Milford, MA, USA) at 45 °C. For dual ammonium acetate and methanol gradient, eluent A was 80 mM ammonium acetate solution and eluent B was methanol. Solution A and 12% solution B was flowed (95 µL/min) through the column for 15 min followed by linear gradients 12–15% solution B from15 to 30 min, 15–30% solution B from 30 to 60 min and 30%-100% solution B from 60 to 62 min [41].
Results and discussion
Derivatization of unsaturated disaccharides
The AMAC-derivatization procedure chosen in this study was simple and rapid [29]. The AMAC fluorophore can be efficiently introduced at the reducing end of GAG-derived disaccharides by reductive amination (Fig. 1). This process relies on the initial formation of Schiff base between the AMAC amino group and the hemiacetal at the disaccharide’s reducing end and the followed by sodium cyanoborohydride reduction. AMAC, a 50-fold to 100-fold excess was applied for high efficiency derivatization. After AMAC labeling, the derivatized HS/HP, CS/DS and HA disaccharides mixture were monitored by comparing UV absorbance at 232 nm and 255 nm (AMAC-labeled ΔUA disaccharides absorb at 255 nm). The absence of residual starting ΔUA disaccharides suggests high derivatization efficiency, satisfactory for CE-LIF analysis. Caution must be applied since it is only possible to assess derivatization efficiency at concentrations sufficient for UV detection and biological samples often afford disaccharides at very low concentrations.
Figure 1.

Fluorophore derivatization reaction of ΔUA-disaccharides with AMAC. A generalized GAG disaccharide is shown that can either be 1,3 or 1,4 linked and can contain a GalN or GlcN residue at the reducing end where Y or W = H or glycosidic, X = H or SO3−, Y = H or SO3− or glycosidic, and Z = Ac or SO3−.
Under the separation conditions, excess AMAC receives a positive charge making it impossible for AMAC to enter the capillary under reversed polarity mode. This was demonstrated by injecting a mixture of AMAC, reagents, and GAG-derived disaccharides, into the capillary under the same CE condition. No peaks were found in the electropherogram, so cleanup of excess AMAC was unnecessary.
CE timetable for separation of AMAC-labeled seventeen HP/HS, CS/DS and HA ΔUA-disaccharides with internal standard
It was necessary to develop a timetable for CE separation of seventeen AMAC-labeled GAG-derived disaccharides because they cannot be completely resolved under a single separation voltage within an acceptable analysis time. The separation efficiency relies significantly on the length and inner diameter of the capillary [49], so in our study, a fused-silica column of 50 µm ID was used to minimize thermal effects, and because the separation efficiency is relatively constant at long lengths [46], thus, a capillary of an effective length of 70 cm was selected for use in this study. Buffer species can have significant impact on separation efficiency. Phosphate buffer had been proven effective for separation of AMAC-labeled HS/HP, CS/DS and HA disaccharides [29, 32, 42]. Moreover, the effect of ionic strength on separation efficiency is straightforward [49], decreasing the ionic strength of the operating buffer decreases conductivity, lowering current flow, decreasing temperature gradients within the capillary column, and increasing separation efficiency. However, low conductivity of operating buffer can cause triangular shaped peaks, which can degrade the separation efficiency. In the current study, optimizing the concentration of buffer only has a minor effect on resolution. Another critical parameter, governing CE separation of seventeen AMAC-labeled disaccharides is the separation voltage. HS/HP and CS/DS disaccharides can be completely resolved under a certain voltage in separate experiments [32]. Disulfated HS/HP and CS/DS disaccharides with added internal standard disaccharide cannot be resolved until the separation voltage has been decreased to 20 kV, and monosulfated, trisulfated, and unsulfated HA disaccharides can be quickly and completely separated at 30 kV. A lower separation voltage increases disaccharide migration time requiring longer analysis times. Under the buffer conditions in this study, the separation of seventeen AMAC-labeled disaccharides with added internal standard disaccharide takes more than 90 min at 20 kV. In addition, electrolysis of buffer can occur during a long analysis, resulting in incomplete separation and poor repeatability. Electrophoregrams of analyses performed under different separation voltages of 20 kV and 30 kV are shown in Fig. 2A and 2B. Under 20 kV separation voltage, only 14 components with internal standard were resolved in 70 minutes; and under separation voltage of 30 kV, 17 components with internal standard were detected in 60 minutes, however 2S6SHS and internal standard were not completely resolved.
Figure 2.

Electrophoregrams of analyses performed under different separation voltages. All three analyses were performed at 25°C, pressure injection of 50 mbar × 5 s at reversed polarity, using 50 mM phosphate buffer, pH 3.5. Injection volume is 5 nL, concentration of solution is 5 ng/µL. 17 standard disaccharides from HS/HP, CS/DS and HA: 1. Tri SCS, 2. Tri SHS, 3. SDCS, 4. SBCS, 5. SECS, 6. 2S6SHS, 7. NS2SHS, 8. NS6SHS, 9. 2SCS, 10. 6SCS, 11. 4SCS, 12. 2SHS, 13. 6SHS, 14. NSHS, 15. 0SHS, 16. 0SCS, 17. 0SHA; *IS standards for internal standard. (A) Electrophoregram under 20 kV separation voltage, only 14 components with internal standard were resolved in 70 minutes; (B) Electrophoregram under 30 kV separation voltage, 17 components with internal standard were detected in 60 minutes, however 2S6SHS and internal standard is not completely resolved; (C) Electrophoregram under different separation voltages controlled by event timetable, a complete resolution of 17 AMAC-labeled ΔUA-disaccharides and internal standard was achieved within 70 minutes.
As a result, a timetable was applied to the CE separation, shown in Table 2. While this timetable is more complex than the conditions previously reported for the individual separation of HS/HP- and CS/DS-derived disaccharide mixtures [32], such programed elution is relatively straightforward on modern CE instruments. The electrophoregram shows complete resolution of seventeen AMAC-derivatized disaccharides (Fig. 2C). All disaccharides and internal standard were well resolved in a relatively short analysis time. An analysis time of approximately 1 h for a mixture of AMAC-derivatized HS/HP and CS/DS disaccharides compares favorably to two separate analyses of 20–30 min previously reported [32].
Table 2.
CE Timetable for separation of AMAC-labeled 17 disaccharides with added internal standard disaccharide
| Time | Event (separation voltage, reserved polarity, kV) |
Disaccharides |
|---|---|---|
| 0:00 | 30 | Trisulfated disaccharides (TriSHS, TriSCS) |
| 15:00 | 30 | |
| 15:01 | 20 | Disulfated disaccharides (2S6SHS, 2SNSHS, NS6SHS, SDCS, SBCS, SECS) |
| 25:00 | 20 | |
| 25:01 | 30 | Mono-, and nonsulfated disaccharides (2SHS, 6SHS, NSHS, 0SHS, 2SCS, 6SCS, 4SCS, 0SCS, 0SHA) |
| 70:00 | 30 |
Repeatability, sensitivity and quantitative characteristics of the method
Eighteen injections at each concentration, of the seventeen AMAC-labeled ΔUA-disaccharides and internal standard (IS), were made after 1, 2, 3, 7, 14 and 30 days of AMAC-derivatization using a single capillary under identical conditions. Peak areas showed RSDs from 0.5% to 2.7%, and migration times showed RSDs from 1.2% to 3.2%. Intra-day RSDs of peak areas ranged from 0.3% to 1.8% and intra-day RSDs of migration times ranged from 0.9% to 3.0%. It is noteworthy that these injections were made with 2 ng/µL, 10 ng/µL, and 50 ng/µL of each ΔUA-disaccharide, so the separation conditions described are reliable over a range of concentrations typically observed in biological sources.
The linearity and sensitivity of the method were tested by analyzing seventeen standard AMAC-labeled ΔUA-disaccharides in solutions over a wide range of concentrations (0.05 ng/µL to 100 ng/µL per ΔUA-disaccharide) and measuring their peak areas. The detector signal response was different for different ΔUA-disaccharides. Most components could be detected at 0.05 ng/µL, although ΔDi-TriSHS, and ΔDi-NSHS could only be detected at 0.1 ng/µL, and ΔDi-0SHA only at 0.5 ng/µL. The detection limit varied from 0.3 fmol to 4.4 fmol for different ΔUA-disaccharides. The limit of quantification (LOQ) by LIF detector (Δex = 488 nm) were also estimated from the measurement as a signal to noise of 10:1, ranged from 8 fmol to 567 fmol for different disaccharides. A calibration curve, and LOQ for each ΔUA-disaccharide are presented in Table 3. These results show approximately 100-fold higher sensitivity when compared to UV detection of nonderivatized ΔUA-disaccharide at 232 nm. This clearly demonstrates fluorescent labeling is very useful for the analysis of the GAGs present in trace amounts in complex biological samples. There might be several reasons for the variability in the LOQ for the various disaccharides (Table 3). The analyte is a 17-component mixture of disaccharides prepared from three classes of polysaccharides (i.e., HS/PP, CS/DS and HA) and the derivatization reaction can only be truly optimized for a single disaccharide and at a single concentration. While derivatization appeared to be quantitative for all components at a concentration sufficiently high to be analyzed by CE using UV detection, this may not be true for when lower concentrations of disaccharides are derivatized with AMAC. Indeed, it appears that the more highly sulfated disaccharides (i.e., TriSHS and TriSCS) may be less efficiently derivatized. Moreover OSHA, eluting last from the capillary shows a much broader peak suggesting a reason for its relatively high LOQ. Thus, the use of a standard curve as well as an internal standard is strongly recommended in analyzing sample containing low concentrations of unknown GAGs.
Table 3.
Linearity equations for AMAC-labeled HS/HP and CS/DS, HA ΔUA-disaccharides
| Disaccharide type |
Disaccharide | Linearity equations(a) | Limit of quantification (fmol) |
|---|---|---|---|
| HP/HS | TriSHS | Y(b) = (0.132±0.002)X(c) −(0.154±0.084), R2=0.997 |
567 |
| 2S6SHS | Y= (0.619±0.014)X+(0.506±0.542), R2=0.996 |
141 | |
| NS2SHS | Y= (0.781±0.016)X−(0.399±0.627), R2=0.996 |
110 | |
| NS6SHS | Y= (0.449±0.011)X−(0.312±0.442), R2=0.994 |
240 | |
| 2SHS | Y= (1.840±0.041)X−(1.348±1.608), R2=0.996 |
59 | |
| 6SHS | Y= (1.378±0.026)X−(0.955±1.039), R2=0.997 |
66 | |
| NSHS | Y= (0.702±0.015)X−(0.690±0.621), R2=0.996 |
8 | |
| 0SHS | Y= (4.327±0.061)X+(0.916±2.428), R2=0.998 |
15 | |
| CS/DS | TriSCS | Y= (0.688±0.013)X−(0.891±0.524), R2=0.996 |
106 |
| SDCS | Y= (1.467±0.013)X−(0.780±0.509), R2=0.999 |
28 | |
| SBCS | Y= (1.708±0.036)X+(0.112±1.437), R2=0.995 |
55 | |
| SECS | Y= (1.167±0.024)X+(0.847±0.958), R2=0.996 |
69 | |
| 2SCS | Y= (4.007±0.112)X+(4.976±4.442), R2=0.993 |
41 | |
| 6SCS | Y= (6.529±0.161)X−(8.214±6.407), R2=0.995 |
27 | |
| 4SCS | Y= (3.038±0.060)X−(1.744±2.384), R2=0.996 |
35 | |
| 0SCS | Y= (5.979±0.064)X+(0.610±2.521), R2=0.999 |
8.3 | |
| HA | 0SHA | Y= (0.592±0.011)X−(0.813±0.519), R2=0.998 |
201 |
Linearity equations were calibrated by17 AMAC-labeled ΔUA-disaccharide solutions spiked with internal standard ΔUA2S-GlcNCOEt6S at 0.05, 0.1, 0.5, 1, 5, 10, 20, 50, 75, 100 ng/µL per ΔUA-disaccharide, N=3.
Y presents the peak areas.
C presents the concentration of each ΔUA-disaccharide.
Application of the method to biological samples
Quantitative disaccharide compositional analysis is one of the most common strategies for structural characterization of GAGs, which is directly related to their biological function study. However, the fact that GAGs are not very abundant in many biological samples poses great challenge to GAG-derived disaccharides analysis. In our laboratory macro-scale extraction method were developed for compositional profiling of GAGs from biological sources and excellent recoveries were achieved [47], but additional study is also necessary to optimize and simplify the extraction procedure, because current methods of HS/HP-, CS/DS- and HA-derived disaccharides analysis are completed in separate chromatographic experiments, which calls for time-consuming multiple sample recoveries and separate analyses steps. Besides, one of the important aspects of compositional analysis of GAGs is to determine ratios of different GAG families, however analytical data from multiple analyses can introduce possible inaccuracy. Yang et al have successfully established a UPLC-MS method to resolve seventeen AMAC-labeled disaccharides in a single run on a standard C18 column with picomole detection level and applied it to biological samples [41]. However, by using CE-LIF as separation and detection tool also have some advantages: (1) washing and equilibrating a bare fused-silica column was finished in 10 minutes, while it usually takes 20 to 40 minutes to equilibrate a C18 column; (2) the resolution power of CE can avoid the use of expensive ion-pairing reagent necessary for reversed-phase ion-pair method; (3) a normal UPLC-MS injection is at the level of several microliters, while CE-LIF analysis only consumes 10–100 nL for each run.
Chinese hamster ovary (CHO) cells are widely used in the biopharmaceutical industry for the production of recombinant therapeutic proteins, they are also known to be effective in the biosynthesis of HS but not HP. Currently in our laboratory research is focused on the metabolic engineering of the HS biosynthetic pathway to produce secreted CHO cell heparin. AMAC-derivatized ΔUA-disaccharides obtained from endogenous GAGs from CHO-S and D29 cells were analyzed by CE-LIF (Fig. 3). The data shows that only four different disaccharides were present in CHO-S cells, 4SCS (36.5%), 6SCS (2.3%), NSHS (15.4%), and 0SHS (45.8%), ratio of HS/HP to CS/DS was 1.6; and in D29 cells, only NS2SHS (4.6%), 4SCS (2.3%), NSHS (88.0%), and 0SHS (5.0%), ratio of HS/HP to CS/DS was 42.5. These results are consistent to our analysis using RP-UPLC-MS (Fig. 4), and previous published result [50]. It is noteworthy that CHO-S and CHO-D29 cells show different disaccharide compositions than CHO-K cells, possibly because CHO-S and CHO-D29 cells are grown in suspension and CHO-K is an adherent cell line. GAG composition of cultured cell lines also vary based on species, cell type, cell line, and environmental and cell growth conditions and are the subject of ongoing studies in our laboratory [50].
Figure 3.

Electrophoregrams of AMAC-labeled ΔUA-disaccharides from endogenous GAGs present in (A) CHO-S cells and (B) D29 cells recovered in 16% NaCl wash.
Figure 4.

Electrophoregrams of AMAC-labeled ΔUA-disaccharides from endogenous GAGs present in CHO-S cells recovered in 16% NaCl wash. Disaccharide analysis, based on EIC, of endogenous GAGs present in CHO-S and D29 cells. (A) 17 standard disaccharides from HS/HP, CS and HA: 1. Tri SHS, 2. NS6SHS, 3. NS2SHS, 4. Tri SCS, 5. NSHS, 6. SBCS, 7. 2S6SHS, 8. SDCS, 9. 6SHS, 10. SECS, 11. 2SHS, 12. 2SCS, 13. 4SCS, 14. 0SHS, 15. 6SCS, 16. 0SHA, 17. 0SCS; (B) Endogenous GAGs in CHO-S cells recovered in 16%NaCl wash; (c) Endogenous GAGs in D29 cells recovered in 16% NaCl wash.
Conclusions
In conclusion, the CE-LIF protocol described herein provides a fast, simple and reproducible method for analysis of HS/HP and CS/DS disaccharide samples. A complete separation of all seventeen AMAC-labeled ΔUA-disaccharides was obtained in 70 min. This is the first time to apply CE separation to resolve HS/HP, CS/DS and HA disaccharides in one run from a single sample, so the steps for enzymatic degradation of GAGs can be simplified. An internal standard ΔUA2S-GlcNCOEt6S was also introduced to improve quantitative ability of the method. The derivatization procedure was rapid, simple and quantitative, no cleanup step was required to remove excess labeling reagent. This method can be applied for the analysis of GAGs in biological sample because of its high sensitivity and ease of quantification.
Acknowledgements
The authors thank the National Institutes of Health for supporting this research with grants GM38060, HL101721, GM090127 and the Empire State Stem Cell Fund for funding in the form of contract #C024334.
Footnotes
Publisher's Disclaimer: This is a PDF file of an unedited manuscript that has been accepted for publication. As a service to our customers we are providing this early version of the manuscript. The manuscript will undergo copyediting, typesetting, and review of the resulting proof before it is published in its final citable form. Please note that during the production process errors may be discovered which could affect the content, and all legal disclaimers that apply to the journal pertain.
Abbreviations used: AMAC, 2-aminoacridone; ANTS, 8-aminonaphthalene-1,3,6-trisulfonic acid; 2-AP, 2-aminopyridine; APTS, 8-aminopyrene-1,3,6-trisulfonate; CE, capillary electrophoresis; CHO, Chinese hamster ovary; CS/DS, chondroitin sulfate/dermatan sulfate; GAG, glycosaminoglycan; GalN, D-galactosamine; GlcA, Dglucuronic acid; GlcN, D-glucosamine; S, sulfo; Et, ethyl; GPC, gel permeation chromatography; HA, hyaluronic acid; HCl, hydrochloric acid; HS/HP, heparan sulfate/heparin; HPLC, high-performance liquid chromatography; HT, hypoxanthine/thymidine mixture; IdoA, L-iduronic acid; IS, internal standard; LIF, laser-induced fluorescence; LOQ, limit of quantification; MS, mass spectrometry; NMR, nuclear magnetic resonance; PAGE, polyacrylamide gel electrophoresis; PGs, proteoglycans; RP, reversed-phase; RSD, relative standard deviation; ΔUA, 4-deoxy-α-L-threo-hex-4-enopyranosyluronic acid; UDP, uridine diphosphate; UPLC, ultra-performance liquid chromatography; UV, ultraviolet.
References
- 1.Iozzo RV. Basement membrane proteoglycans: from cellar to ceiling. Nat. Rev. Mol. Cell Biol. 2005;6:646–656. doi: 10.1038/nrm1702. [DOI] [PubMed] [Google Scholar]
- 2.Iozzo RV, Sanderson RD. Proteoglycans in cancer biology, tumour microenvironment and angiogenesis. J. Cell Mol. Med. 2011;15:1013–1031. doi: 10.1111/j.1582-4934.2010.01236.x. [DOI] [PMC free article] [PubMed] [Google Scholar]
- 3.Couchman JR. Transmembrane signaling proteoglycans. Annu. Rev. Cell Dev. Biol. 2010;26:89–114. doi: 10.1146/annurev-cellbio-100109-104126. [DOI] [PubMed] [Google Scholar]
- 4.Bulow HE, Hobert O. The molecular diversity of glycosaminoglycans shapes animal development. Annu. Rev. Cell Dev. Biol. 2006;22:375–407. doi: 10.1146/annurev.cellbio.22.010605.093433. [DOI] [PubMed] [Google Scholar]
- 5.Capila I, Linhardt RJ. Heparin-protein interactions. Angew Chem Int Ed Engl. 2002;41:391–412. doi: 10.1002/1521-3773(20020201)41:3<390::aid-anie390>3.0.co;2-b. [DOI] [PubMed] [Google Scholar]
- 6.Cattaruzza S, Perris R. Approaching the proteoglycome: molecular interactions of proteoglycans and their functional output. Macromol Biosci. 2006;6:667–680. doi: 10.1002/mabi.200600100. [DOI] [PubMed] [Google Scholar]
- 7.Prydz K, Dalen KT. Synthesis and sorting of proteoglycans - Commentary. Journal of Cell Science. 2000;113:193–205. doi: 10.1242/jcs.113.2.193. [DOI] [PubMed] [Google Scholar]
- 8.Sugahara K, Mikami T, Uyama T, Mizuguchi S, Nomura K, Kitagawa H. Recent advances in the structural biology of chondroitin sulfate and dermatan sulfate. Curr Opin Struct Biol. 2003;13:612–620. doi: 10.1016/j.sbi.2003.09.011. [DOI] [PubMed] [Google Scholar]
- 9.Sasisekharan R, Raman R, Prabhakar V. Glycomics approach to structure-function relationships of glycosaminoglycans. Annu Rev Biomed Eng. 2006;8:181–231. doi: 10.1146/annurev.bioeng.8.061505.095745. [DOI] [PubMed] [Google Scholar]
- 10.Hileman RE, Fromm JR, Weiler JM, Linhardt RJ. Glycosaminoglycan-protein interactions: definition of consensus sites in glycosaminoglycan binding proteins. Bioessays. 1998;20:156–167. doi: 10.1002/(SICI)1521-1878(199802)20:2<156::AID-BIES8>3.0.CO;2-R. [DOI] [PubMed] [Google Scholar]
- 11.Capila I, Linhardt RJ. Heparin-protein interactions. Angew. Chem. Int. Ed. 2002;41:391–412. doi: 10.1002/1521-3773(20020201)41:3<390::aid-anie390>3.0.co;2-b. [DOI] [PubMed] [Google Scholar]
- 12.Esko JD, Selleck SB. Order out of chaos: assembly of ligand binding sites in heparan sulfate. Annu Rev Biochem. 2002;71:435–471. doi: 10.1146/annurev.biochem.71.110601.135458. [DOI] [PubMed] [Google Scholar]
- 13.Pinto DO, Ferreira PL, Andrade LR, Petrs-Silva H, Linden R, Abdelhay E, Araujo HM, Alonso CE, Pavao MS. Biosynthesis and metabolism of sulfated glycosaminoglycans during Drosophila melanogaster development. Glycobiology. 2004;14:529–536. doi: 10.1093/glycob/cwh070. [DOI] [PubMed] [Google Scholar]
- 14.Grag HG, Linhardt RJ, Hales CA, editors. Chemistry and Biology of Heparin and Heparan Sulfate. Elsevier B. V.; New York: 2005. [Google Scholar]
- 15.Linhardt RJ, Turnbull JE, Wang HM, Loganathan D, Gallagher JT. Examination of the Substrate-Specificity of Heparin and Heparan-Sulfate Lyases. Biochemistry. 1990;29:2611–2617. doi: 10.1021/bi00462a026. [DOI] [PubMed] [Google Scholar]
- 16.Wight TN, Mecham RP, editors. Biology of Proteoglycans. New York: Academic Press; 1987. [Google Scholar]
- 17.Volpi N, Linhardt RJ. High-performance liquid chromatography-mass spectrometry for mapping and sequencing glycosaminoglycan-derived oligosaccharides. Nat. Protoc. 2010;5:993–1004. doi: 10.1038/nprot.2010.48. [DOI] [PMC free article] [PubMed] [Google Scholar]
- 18.Jandik KA, Kruep D, Cartier M, Linhardt RJ. Accelerated stability studies of heparin. J. Pharm. Sci. 1996:45–51. doi: 10.1021/js9502736. [DOI] [PubMed] [Google Scholar]
- 19.Cohen DM, Linhardt RJ. Randomness in the heparin polymer: computer simulations of alternative action patterns of heparin lyase. Biopolymers. 1990;30:733–741. doi: 10.1002/bip.360300708. [DOI] [PubMed] [Google Scholar]
- 20.Kariya Y, Yoshida K, Morikawa K, Tawada A, Miyazono H, Kikuchi H, Tokuyasu K. Preparation of unsaturated disaccharides by eliminative cleavage of heparin and heparan sulfate with heparitinases. Comp Biochem Physiol B. 1992;103:473–479. doi: 10.1016/0305-0491(92)90323-j. [DOI] [PubMed] [Google Scholar]
- 21.Ambrosius M, Kleesiek K, Gotting C. Quantitative determination of the glycosaminoglycan Delta-disaccharide composition of serum, platelets and granulocytes by reversed-phase high-performance liquid chromatography. J. Chromatogr. A. 2008;1201:54–60. doi: 10.1016/j.chroma.2008.06.007. [DOI] [PubMed] [Google Scholar]
- 22.Rice KG, Kim YS, Grant AC, Merchant ZM, Linhardt RJ. High-performance liquid chromatographic separation of heparin-derived oligosaccharides. Anal. Biochem. 1985;150:325–331. doi: 10.1016/0003-2697(85)90518-4. [DOI] [PubMed] [Google Scholar]
- 23.Yamada S, Sakamoto K, Tsuda H, Yoshida K, Sugiura M, Sugahara K. Structural studies of octasaccharides derived from the low-sulfated repeating disaccharide region and octasaccharide serines derived from the protein linkage region of porcine intestinal heparin. Biochem. 1999;38:838–847. doi: 10.1021/bi981889n. [DOI] [PubMed] [Google Scholar]
- 24.Swartz ME. UPLC™: An Introduction and Review. J. Liq. Chromatogr. Related Technol. 2005;28:1253–1263. [Google Scholar]
- 25.MacNair JE, Lewis KC, Jorgenson JW. Ultrahigh-pressure reversed-phase liquid chromatography in packed capillary columns. Anal. Chem. 1997;69:983–989. doi: 10.1021/ac961094r. [DOI] [PubMed] [Google Scholar]
- 26.Hileman RE, Smith AE, Toida T, Linhardt RJ. Preparation and structure of heparin lyase-derived heparan sulfate oligosaccharides. Glycobiology. 1997;7:231–239. doi: 10.1093/glycob/7.2.231. [DOI] [PubMed] [Google Scholar]
- 27.Chuang WL, McAllister H, Rabenstein L. Chromatographic methods for product-profile analysis and isolation of oligosaccharides produced by heparinase-catalyzed depolymerization of heparin. J Chromatogr A. 2001;932:65–74. doi: 10.1016/s0021-9673(01)01241-9. [DOI] [PubMed] [Google Scholar]
- 28.Rice KG, Rottink MK, Linhardt RJ. Fractionation of heparin-derived oligosaccharides by gradient polyacrylamide-gel electrophoresis. Biochem J. 1987;244:515–522. doi: 10.1042/bj2440515. [DOI] [PMC free article] [PubMed] [Google Scholar]
- 29.Militsopoulou M, Lamari FN, Hjerpe A, Karamanos NK. Determination of twelve heparin- and heparan sulfate-derived disaccharides as 2-aminoacridone derivatives by capillary zone electrophoresis using ultraviolet and laser-induced fluorescence detection. Electrophoresis. 2002;23:1104–1109. doi: 10.1002/1522-2683(200204)23:7/8<1104::AID-ELPS1104>3.0.CO;2-1. [DOI] [PubMed] [Google Scholar]
- 30.Volpi N, Maccari F, Linhardt RJ. Quantitative capillary electrophoresis determination of oversulfated chondroitin sulfate as a contaminant in heparin preparations. Anal. Biochem. 2009;388:140–145. doi: 10.1016/j.ab.2009.02.012. [DOI] [PMC free article] [PubMed] [Google Scholar]
- 31.Eldridge SL, Higgins LA, Dickey BJ, Larive CK. Insights into the capillary electrophoresis separation of heparin disaccharides from nuclear magnetic resonance, pKa, and electrophoretic mobility measurements. Anal. Chem. 2009;81:7406–7415. doi: 10.1021/ac901218q. [DOI] [PubMed] [Google Scholar]
- 32.Hitchcock AM, Bowman MJ, Staples GO, Zaia J. Improved workup for glycosaminoglycan disaccharide analysis using CE with LIF detection. Electrophoresis. 2008;29:4538–4548. doi: 10.1002/elps.200800335. [DOI] [PMC free article] [PubMed] [Google Scholar]
- 33.Mao W, Thanawiroon C, Linhardt RJ. Capillary electrophoresis for the analysis of glycosaminoglycans and glycosaminoglycan-derived oligosaccharides. Biomed Chromatogr. 2002;16:77–94. doi: 10.1002/bmc.153. [DOI] [PubMed] [Google Scholar]
- 34.Ruiz-Calero V, Moyano E, Puignou L, Galceran MT. Pressure-assisted capillary electrophoresis-electrospray ion trap mass spectrometry for the analysis of heparin depolymerised disaccharides. J. Chromatogr. A. 2001;914:277–291. doi: 10.1016/s0021-9673(00)01181-x. [DOI] [PubMed] [Google Scholar]
- 35.Zamfir A, Seidler DG, Kresse H, Peter-Katalinic J. Structural characterization of chondroitin/dermatan sulfate oligosaccharides from bovine aorta by capillary electrophoresis and electrospray ionization quadrupole time-of-flight tandem mass spectrometry. Rapid Communications in Mass Spectrometry. 2002;16:2015–2024. doi: 10.1002/rcm.820. [DOI] [PubMed] [Google Scholar]
- 36.Behnke B, Schlotterbeck G, Tallarek U, Strohschein S, Tseng LH, Keller T, Albert K, Bayer E. Capillary HPLC-NMR Coupling: High-Resolution (1)H NMR Spectroscopy in the Nanoliter Scale. Anal Chem. 1996;68:1110–1115. doi: 10.1021/ac950925a. [DOI] [PubMed] [Google Scholar]
- 37.Patel RP, Narkowicz C, Hutchinson JP, Hilder EF, Jacobson GA. A simple capillary electrophoresis method for the rapid separation and determination of intact low molecular weight and unfractionated heparins. J. Pharm. Biomed. Anal. 2008;46:30–35. doi: 10.1016/j.jpba.2007.10.009. [DOI] [PubMed] [Google Scholar]
- 38.Desai UR, Wang H, Ampofo SA, Linhardt RJ. Oligosaccharide composition of heparin and low-molecular-weight heparins by capillary electrophoresis. Anal. Biochem. 1993;213:120–127. doi: 10.1006/abio.1993.1394. [DOI] [PubMed] [Google Scholar]
- 39.Volpi N, Maccari F, Linhardt RJ. Capillary electrophoresis of complex natural polysaccharides. Electrophoresis. 2008;29:3095–3106. doi: 10.1002/elps.200800109. [DOI] [PMC free article] [PubMed] [Google Scholar]
- 40.Galeotti F, Volpi N. Online reverse phase-high-performance liquid chromatography-fluorescence detection-electrospray ionization-mass spectrometry separation and characterization of heparan sulfate, heparin, and low-molecular weight-heparin disaccharides derivatized with 2-aminoacridone. Anal Chem. 2011;83:6770–6777. doi: 10.1021/ac201426e. [DOI] [PubMed] [Google Scholar]
- 41.Yang B, Chang Y, Weyers AM, Sterner E, Linhardt RJ. Disaccharide analysis of glycosaminoglycan mixtures by ultra-high-performance liquid chromatography-mass spectrometry. J Chromatogr A. 2012;1225:91–98. doi: 10.1016/j.chroma.2011.12.063. [DOI] [PMC free article] [PubMed] [Google Scholar]
- 42.Militsopoullou M, Lecomte C, Bayle C, Couderc F, Karamanos NK. Laser-induced fluorescence as a powerful detection tool for capillary electrophoretic analysis of heparin/heparan sulfate disaccharides. Biomedical Chromatography. 2003;17:39–41. doi: 10.1002/bmc.207. [DOI] [PubMed] [Google Scholar]
- 43.Gabius HJ, Kohnke-Godt B, Leichsenring M, Bardosi A. Heparin binding lectin of human placenta as a tool for histochemical ligand localization and isolation. J Histochem Cytochem. 1991;39:1249–1256. doi: 10.1177/39.9.1918943. [DOI] [PubMed] [Google Scholar]
- 44.Evangelista RA, Michael JM, Chen FT. Simultaneous multianalyte immunoassay of drugs of abuse by CE. Am Clin Lab. 1995;14:27–28. [PubMed] [Google Scholar]
- 45.Stefansson M, Novotny M. Separation of complex oligosaccharide mixtures by capillary electrophoresis in the open-tubular format. Anal Chem. 1994;66:1134–1140. doi: 10.1021/ac00079a031. [DOI] [PubMed] [Google Scholar]
- 46.Lukacs KD, Jorgenson JW. High Resolu. Chromatogr. Chromatogr. Commun. 1985;8:407. [Google Scholar]
- 47.FZhang F, L P, Mu E, Chi LL, Sakai S, Toida T, Zhang HF, Mousa S, Linhardt RJ. Microscale isolation and analysis of heparin from plasma using an anion-exchange spin column. Anal. Biochem. 2006;353:284–286. doi: 10.1016/j.ab.2006.01.040. [DOI] [PMC free article] [PubMed] [Google Scholar]
- 48.Kitagawa H, Kinoshita A, Sugahara K. Microanalysis of glycosaminoglycan-derived disaccharides labeled with the fluorophore 2-aminoacridone by capillary electrophoresis and high-performance liquid chromatography. Anal. Biochem. 1995;232:114–121. doi: 10.1006/abio.1995.9952. [DOI] [PubMed] [Google Scholar]
- 49.Camilleri P, editor. Capillary Electrophoresis. 2nd. ed. CRC Press; 1997. [Google Scholar]
- 50.Yang B, Weyers A, Baik JY, Sterner E, Sharfstein S, Mousa SA, Zhang F, Dordick JS, Linhardt RJ. Ultra-performance ion-pairing liquid chromatography with on-line electrospray ion trap mass spectrometry for heparin disaccharide analysis. Anal. Biochem. 2011;415:59–66. doi: 10.1016/j.ab.2011.04.003. [DOI] [PMC free article] [PubMed] [Google Scholar]