Summary
A transgenic mouse line named iUBC-KikGR was generated which expresses the photoconvertible fluorescent protein Kikume Green-Red (KikGR) under the control of the human Ubiquitin C promoter. KikGR is natively a green fluorophore which can be converted into a red fluorophore upon exposure to UV light. KikGR is expressed broadly throughout transgenic embryos from the 2-cell stage onward, and in the adult. Specificity of photoconversion can range from the entire embryo, to a region of an organ, to a few individual cells, depending on the needs of the experimenter. Cell movements, tissue reorganization, and migration can then be observed in real time by culturing the tissue of interest as an explant on the microscope stage. The iUBC-KikGR transgenic line represents a singular genetic reagent which can be used for fate mapping, lineage tracing, and live visualization of cell behaviors and tissue movements in multiple organs at multiple time points.
Keywords: fate mapping, lineage tracing, photoconvertible fluorescent protein, KikGR, explant culture
The complex body plan of multicellular organisms is shaped by myriad events in early development, including cell division and cell death, morphogenetic movements, cell migration, differentiation, and pattern formation. All of these processes involve multiple cell populations and dynamic interactions between them. Insight into these events is best procured by observation of interactions between cells and tissues in real time. To date, one of the most powerful tools for tracing cells over time is by expression of fluorescent proteins in living tissue. This allows for observation of cellular behaviors by wide field fluorescence or confocal imaging. With the assistance of ex vivo culture technology such as integrated environmental chambers to control temperature, CO2 levels, and humidity on the microscope stage, real time observation of cellular events during development is possible.
To gain specificity in labeling particular cell types or populations with fluorescent markers, current techniques include site-specific injection, electroporation, and dye placement, or genetic techniques such as transgenes which express fluorescent proteins in a spatially- or time-dependent manner. For lineage tracing, fate mapping, and simple observation of specific populations in the developing embryo, the most popular technique in mice has been a bigenic approach involving a transgene expressing Cre recombinase in a time-or tissue-specific manner, and a reporter allele which activates a visual marker, such as lacZ or YFP, in cells that express the Cre transgene (Soriano, 1999; Srinivas et al., 2001). This Cre-lox technique requires that the cell population of interest be defined by a genetic marker specific to that population, which can then be exploited by using cis-regulatory elements from that endogenous gene to drive Cre expression in the transgene. While this is a very powerful technique, it also has limitations. For many cell populations of interest, a useful genetic marker is not known, making it difficult or impossible to express Cre in such a way as to mark the population of interest. Even if good genetic markers are available, time and expense must be invested in creating new transgenic lines for every new cell population for which there is not a pre-existing Cre transgene. Finally, Cre transgenes usually mark entire populations of cells rather than individual cells or small subpopulations. Labeling specificity at this level requires different technology.
To circumvent these limitations, we have generated a new transgenic mouse which ubiquitously expresses the photoconvertible fluorescent protein Kikume Green-Red (KikGR) under control of the human ubiquitin C (UBC) promoter. KikGR is derived from a naturally occurring fluorescent protein which undergoes a conformational change induced by UV light. This conformational change alters the excitation and emission properties of the native protein such that it is converted from a green fluorophore (exmax=507 nm, emmax=517 nm) to a red fluorophore (exmax=583 nm, emmax=593 nm) (Tsutsui et al., 2005). We have introduced KikGR to the mouse genome as a transgene so that we can exploit this property to specifically label small groups or even individual cells and observe their behaviors in real time. Several photoconvertible fluorescent proteins have been tested in the mouse and KikGR has been determined to be most suitable for live imaging in the mouse embryo since it is bright, developmentally neutral, and undergoes rapid and complete conversion upon exposure to UV light (360–410 nm) while remaining stably unconverted in broad-spectrum white light necessary for embryo dissection and manipulation (Nowotschin and Hadjantonakis, 2009). KikGR has been used in lineage tracing, fate mapping, and live imaging of zebrafish, chick, and mouse development to date (Hatta et al., 2006; Kulesa et al., 2008; Kurotaki et al., 2007; Nowotschin and Hadjantonakis, 2009; Stark and Kulesa, 2007). CAGG promoter driven transgenes are sometimes subject to transgene silencing and/or non-ubiquitous expression, especially during development (unpublished work). Previously generated KikGR transgenes have used the CAGG promoter to drive expression in a variety of tissues, but we have used the human ubiquitin C (UBC) promoter, as well as genomic insulators, to generate this transgene in an attempt to alleviate position effects on transgene expression, thus resulting in robust and near-ubiquitous expression of KikGR throughout the embryo and adult tissue. Here we present a new transgenic mouse which broadly expresses KikGR throughout the embryo, making it suitable for individual cell or subpopulation labeling and live imaging from the zygote to the adult. Furthermore, we demonstrate its utility for tracing cells during live imaging of ex vivo embryo and organ cultures.
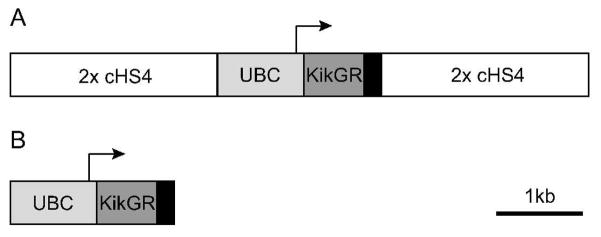
We generated two transgene constructs, UBC-KikGR, comprising the human Ubiquitin C promoter and first intron, followed by the KikGR cDNA and polyadenlyation sequence. A second construct, iUBC-KikGR, flanks the UBC-KikGR construct with two concatamerized genomic insulators derived from the chicken beta globin domain (cSH4x) (Figure 1). Three fluorescent founders from each construct were identified, first by PCR genotyping, then by screening fluorescence in tail snips. Two of the iUBC-KikGR founders and their F1 progeny showed consistently brighter fluorescence than the third iUBC-KikGR line and the three UBC-KikGR lines; these dim lines were then discarded. All data presented here were derived from the iUBC-KikGR1-7 line. Similar data were obtained from a second (iUBC-KikGR3-1) line.
Figure 1. iUBC-KikGR and UBC-KikGR transgene constructs.
A) iUBC-KikGR transgene construct, containing KikGR cDNA driven by the human Ubiquitin C promoter, flanked by 2 concatamerized cHS4 genomic insulator sequences. B) UBC-KikGR transgene construct without genomic insulators. Black box, poly-adenlyation sequence; arrows, transcriptional start site; 2x cHS4, 2 concatamerized cHS4 genomic insulator sequences; KikGR, Kikume green-red cDNA; UBC, human Ubiquitin C regulatory element.
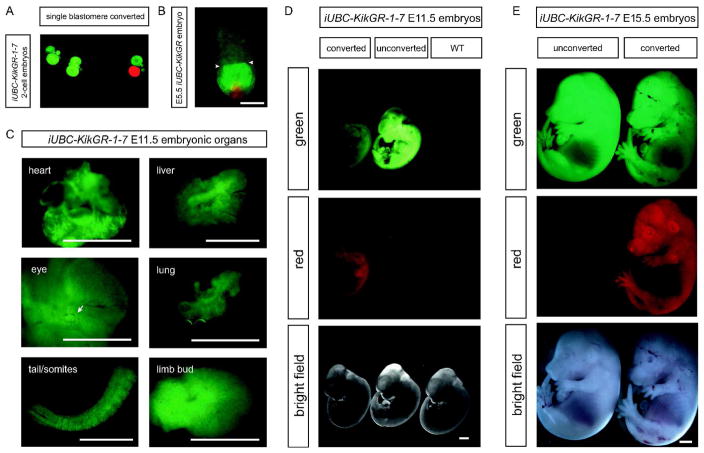
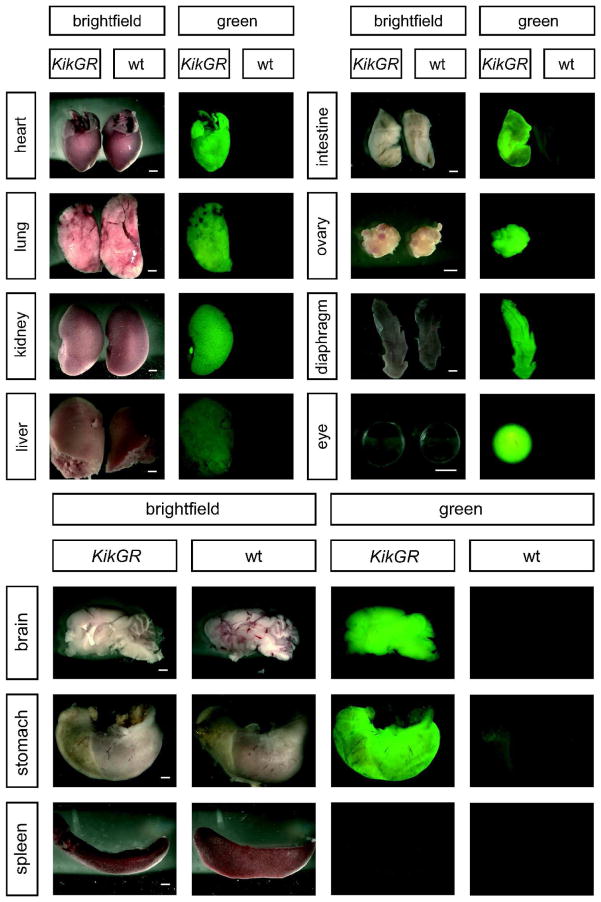
KikGR expression in transgenic embryos is observed from the 2-cell stage (in embryos derived from a transgenic dam), throughout fetal development (in embryos derived from a transgenic sire or dam), and in postnatal animals (adult tail snips). To assay functionality of photoconversion in transgenic mice, E11.5 and E15.5 embryos were exposed to UV light then imaged under both green fluorescent protein (GFP) and red fluorescent protein (RFP) filters to detect converted and unconverted protein. Furthermore, broad fluorescence of the native green KikGR at E11.5 suggested that these transgenic mice are suitable for labeling cells of interest in many embryonic organs. Several organs were dissected from E11.5 embryos, and fluorescence was observed in brain, eye, mesenchyme, limb buds, heart, lungs, somites, and gonads; grossly, all organs exhibit KikGR fluorescence at mid-gestation, though fluorescence in the liver is relatively dim. KikGR is also expressed in 2-cell embryos (when derived from transgenic dams) and in the embryonic ectoderm, with reduced expression in the visceral endoderm of E5.5 embryos (Figure 2). No expression was detected in the extraembryonic ectoderm in E5.5 embryos. Adult transgenic mice exhibit KikGR fluorescence in heart, lungs, kidney, liver (though fluorescence is dim), intestine, diaphragm, ovary, eye, brain, and stomach, but not the spleen (Figure 3). Complete photoconversion of small regions of interest via confocal microscopy in ex vivo organ cultures is achieved in less than 10 scans over 10–20 seconds depending on the tissue (Supplemental Video S1).
Figure 2. iUBC-KikGR transgenic embryos exhibit KikGR fluorescence and functional photoconversion throughout embryonic development.
A) 2-cell embryos showing single cell photoconversion. B) E5.5 embryo showing photoconversion of individual cells in the embryonic ectoderm and visceral endoderm. Arrowheads, boundary between embryonic and extra-embryonic ectoderm. Scale bar = 100 μm. C) Expression of KikGR photoconvertible fluorescent protein in multiple embryonic organs at E11.5. Arrow, eye. Scale bar = 1 mm. D) E11.5 whole embryos exhibit KikGR fluorescence throughout the embryo and photoconversion after exposure of the entire embryo to UV light. Wild type embryo is shown for comparison. Scale bar = 1 mm. E) E15.5 whole embryos exhibit KikGR fluorescence throughout the embryo and photoconversion after exposure to UV light. Scale bar = 1 mm.
Figure 3. iUBC-KikGR transgenic adult mice express KikGR in most organs.
KikGR fluorescence is observed in most organs, though it is dim in the liver. No fluorescence is observed in the spleen. Scale bar = 1 mm.
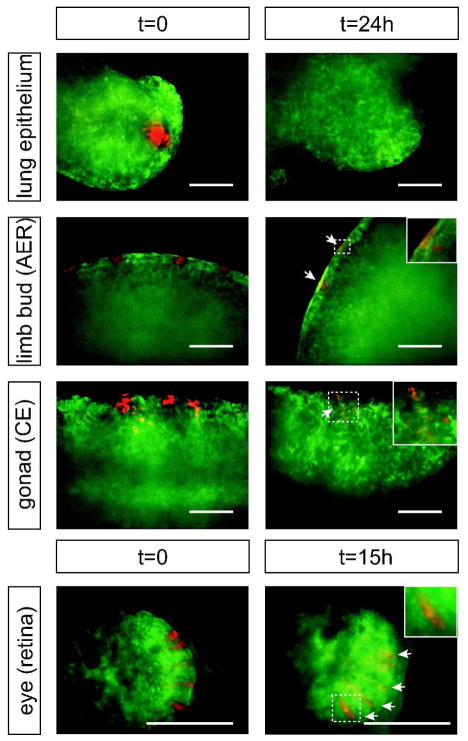
Selected organs were cultured ex vivo, cells of interest were photoconverted on the microscope stage, and explants were live imaged for up to 24h. Some variation over time in intensity of the photoconverted (red) signal was observed, likely owing to variation in rates of cell division and/or protein turnover in different cell types, both of which have potential to dilute the quantity of photoconverted protein in a given cell over time (Figure 4). In order to circumvent this potential problem, we have “reconverted” cells in which the intensity of red signal appears to be fading after 12h, and found that in this manner, cells can be continuously traced for as long as the explant culture thrives with no observable phototoxicity from multiple photoconversion events (data not shown).
Figure 4. Photoconversion and signal stability of KikGR in multiple embryonic organs.
E11.5 UBC-KikGR-1–7 embryonic organs showing photoconversion of small regions of lung eptithelium, limb bud, gonads, and retinal epithelium. After culturing the organs for 15–24 h the photoconverted cells can still be visualized in most organs. Loss of signal in the lung epithelium is most likely due to dilution of the photoconverted protein during rapid cell division. Time (t) expressed in hours after photoconversion. AER, apical ectodermal ridge; CE, coelomic epithelium; arrows, photoconverted cells still visible after 15–24h. Scale bar = 100 μm.
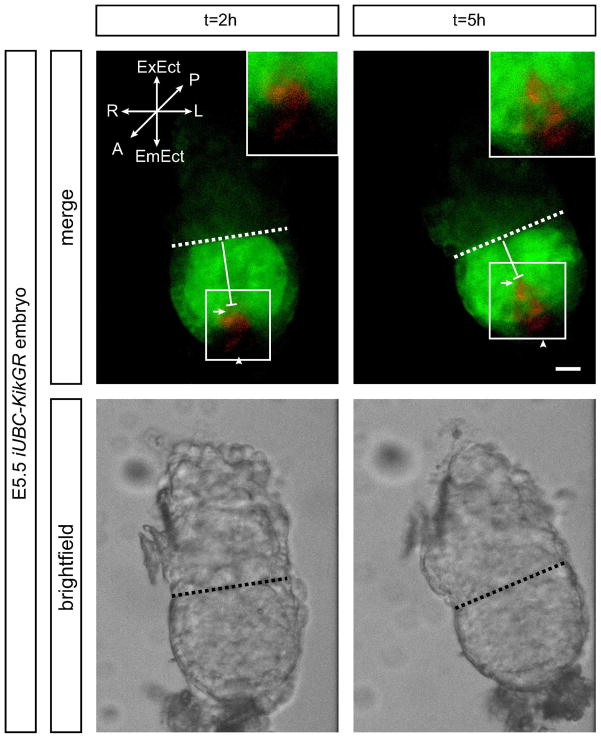
The iUBC-KikGR transgenic mouse is useful for observing morphometric events during gastrulation and early body plan patterning in real time. Photoconversion of cells in the presumptive anterior visceral endoderm (AVE), an organizing tissue which directs anterior-posterior patterning of the embryos, allows for live visualization of AVE cell movements. As expected from previous studies, a distally originating region of the visceral endoderm, which may represent the AVE in E5.5 embryos (labeled red by photoconversion) migrates proximally toward the extra-embryonic ectoderm after only 3–4 h (Rodriguez et al., 2005) (Figure 5, Supplemental Video S2).
Figure 5. Photoconversion of the distal visceral endoderm at E5.5 reveals anterior migration toward the extra-embryonic ectoderm.
E5.5 embryos were photoconverted in a region at the distal tip of the visceral endoderm, representing the presumptive anterior visceral endoderm (AVE) prior to migration. Representative frames at 2 h and 5 h post-photoconversion are shown. After 5 h in culture, labeled cells are observed migrating anteriorly toward the extra-embryonic ectoderm. The embryo is oriented such that the presumptive anterior region is center and facing the objective. Vertical bars indicate distance from distal tip of embryo to migratory front of photoconverted cells; dotted line represents the embryonic-extraembryonic junction. The photoconverted cells have migrated approximately 25 μm toward the embryonic-extraembryonic junction from t = 2 to t = 5 h. Arrowhead, labeled cells in visceral endoderm near the node; arrow, presumptive AVE cells; A, anterior; EmEct, embryonic ectoderm; ExEct, extra embryonic ectoderm; L, left; R, right; t, time (expressed in hours). Scale bar = 50 μm.
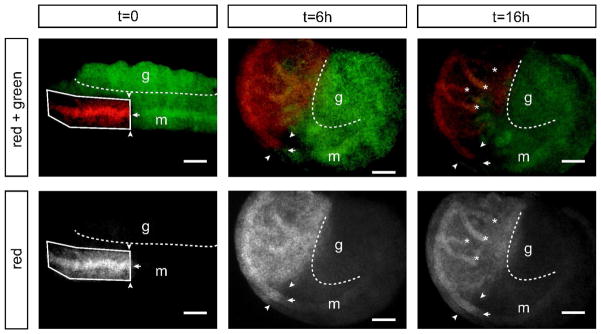
Later morphometric events in organogenesis can also be observed. Photoconversion of the rostral third of the mesonephros at E11.5, and subsequent live imaging of the gonad-mesonephros explant for 12h or more shows that the Wolffian duct, which runs through the mesonephros, continues to extend from the rostral region during this time (Joseph et al., 2009). In converting the entire rostral third of the mesonephros, both mesenchymal and Wolffian duct epithelial cells are labeled red after photoconversion. After 12h ex vivo culture, the red labeled Wolffian duct epithelium has extended caudally beyond the photoconversion boundary of the mesonephric mesenchyme. This result suggests that the Wolffian duct continues to elongate in the rostral region even after the duct has reached its most caudal target in the urogenital sinus. Although the Wolffian duct is fully formed as a complete epithelial tube extending to the urogenital sinus at this point in development, it continues to elongate in the rostral region, presumably to accommodate later coiling in this region which will give rise to the highly convoluted epididymis (Joseph et al., 2009). Mechanisms for elongation in the rostral Wolffian duct may include convergent extension, intercalation of mesenchymal cells into the ductal epithelium, or cell division within the rostral Wolffian duct (Figure 6, Supplemental Video S3).
Figure 6. Photoconversion of the mesonephros at E11.5 reveals Wolffian duct extension in anterior region.
Rostral third of mesonephros including mesonephric mesenchyme and Wolffian duct epithelium were converted at E11.5 (t = 0), then cultured ex vivo. Over time, the photoconversion boundary of the Wolffian duct epithelium (arrow) extends caudally beyond the photoconversion boundary of the surrounding tissue (arrowheads). In addition, branches from the rostral Wolffian duct are observed (asterisks). Box, ROI for photoconversion; dotted line, gonad-mesonephros boundary; g, gonad; m, mesonephros; t, time (expressed in hours). Scale bar = 200 μm.
While the UBC-KikGR transgenic mouse provides an excellent platform for many lineage tracing and fate-mapping applications in development, the nearly ubiquitous expression of KikGR in this line may also be a disadvantage when considering its use in some experiments. For instance, ubiquitous expression in many organs can limit the researchers’ ability to identify and track behaviors of individual cells within a population, as they become difficult to distinguish against the background of their many fluorescent neighbors. Visualizing the behaviors of individual cells in the UBC-KikGR transgenic mouse generally requires that red photoconverted cells migrate away from their original location in a low enough density to provide good separation between one red cell and the next, which may not be possible in all organ systems. Furthermore, researchers interested in development of the spleen or extraembryonic ectoderm will find that KikGR is expressed poorly or not at all in these organs.
Here we have characterized and described a new tool for real time analysis of mammalian development: the iUBC-KikGR transgenic mouse, and demonstrated its suitability for live organ explant imaging to examine events in organogenesis. The photoconvertible fluorescent protein KikGR is expressed ubiquitously in all examined organs throughout fetal development, such that a single transgenic line is suitable for fate mapping, lineage tracing, and morphogenetic movement studies in multiple organogenesis programs at multiple time points. Furthermore, the ability to label single cells or small genetically undefined groups of cells allows for a specificity and flexibility in experimental design that is unavailable with conventional Cre-lox bigenic systems. Transgenic embryos are easily phenotyped by fluorescence as embryos or adults, making for easy and efficient colony maintenance and screening of embryos for experiments. In addition to cell lineage and fate mapping studies, this mouse should also prove useful for observation and analysis of cellular behaviors, such as migration, in real time.
Methods
Mice
All experiments were approved by the Institutional Animal Care and Use Committee (IACUC). For embryonic stages, noon on the day that vaginal plug was observed is considered embryonic day (E) 0.5. All experiments were performed in triplicate or greater replications.
Generation and characterization of the iUBC-KikGR photoconvertible transgenic mice
Transgene Design
The UBC-KikGR and iUBC-KikGR transgene constructs were generated by PCR cloning of the KikGR cDNA from pKikGR1-S1 plasmid (MBL Medical & Biological Laboratories Co., Ltd. Naka-ku Nagoya, Japan) with primers 5′-TATTTctcgagCCATGGTGAGTGTGATTACAT-3′ and 5′-ATATTTgggcccAGTTACTTGGCCAGCCTTGGC-3′, adding restriction sites XhoI and ApaI to the 5′ and 3′ ends of the cDNA, respectively (lowercase letters indicate engineered restriction enzyme recognition sites). PCR products were digested with restriction sites XhoI and ApaI and subcloned into the cHS2x-UBC-SH-RG-cHS2x vector (Stewart et al., 2009) using the same sites, resulting in the cHS2x-UBC-KikGR-cHS2x vector. Clones were sequenced and transgene fragments were released from the vector. The 7.1kb iUBC-KikGR transgene fragment containing cHS2x (2 concatamerized genomic sequences derived from chicken hypersensitive site 4 transcriptional insulators) (Potts et al., 2000) flanking the human Ubiquitin C promoter (Schorpp et al., 1996) and KikGR cDNA was released from the vector using SalI and AseI. The 2.1kb UBC-KikGR transgene fragment without cSH4x genomic insulators was released from the vector using MluI and SphI. Transgene fragments were purified and injected into zygotes from B6/SJLF1 crosses by standard techniques (Nagy et al., 2003).
Genotypic and phenotypic screening of iUBC-KikGR transgenic mice
Transgene injection generated a total of five iUBC-KikGR founders identified by PCR genotyping using 5′-TGAAGATCGAGCTGCGTATG-3′ and 5′-CTCCATTTGATGATCCACGA-3′ yielding a PCR product of 585 bp. Of these founders, one male and two females showed strong expression of the KikGR photoconvertible protein in tail snips as observed via imaging on a Leica MZ10 F stereofluorescent microscope (Leica Microsystems Ltd., Bannockburn, IL). Eleven UBC-KikGR transgenic founders were identified by PCR genotyping using the same primers, and of these one male and two female founders showed expression of the KikGR fluorescent protein in tail snips. Founders exhibiting strong fluorescence in tail snips were crossed to outbred Swiss Webster mice (Taconic, NY) to generate F1 embryos for expression analysis and F1 animals for line expansion. One UBC-KikGR founder (UBC-KikGR-4-7) was determined to silence transgene expression when passed on to the F1 generation. Normal Mendelian ratios of transgenic F1 animals were identified by PCR genotyping, but these transgenic F1 mice exhibited no detectable fluorescence (data not shown). This line was discarded, leaving three iUBC-KikGR lines and two UBC-KikGR lines. Two iUBC-KikGR lines showed consistently brighter fluorescence than the third iUBC-KikGR line and the three UBC-KikGR lines; these two lines were maintained while the dimmer lines were discarded. Transgenic mice from these remaining lines are easily phenotyped, and therefore genotyped, by fluorescence.
Remaining iUBC-KikGR transgenic lines were assayed for fluorescent expression in midgestation embryos. Embryonic organs were dissected at the indicated timepoint and imaged by stereofluorescence as above.
Functional screen for photoconversion
Photoconversion of the KikGR protein for screening founders was achieved by placing tail snips or whole embryos on a FOTO/UV® 26 light box (Fotodyne, Inc., Hartland, WI) for 3 minutes, then imaging with both EGFP and HCRed filters to identify photoconverted and unconverted protein.
E11.5 embryos from male founder iUBC-KikGR-1–7, which expressed strongly in tail snips, were visually screened for KikGR fluorescence with 488nm excitation by stereofluorescence. Initial analysis of KikGR function was performed by exposing some transgenic embryos to UV wavelengths. Embryos were placed in culture dishes in PBS and these dishes were placed on a FOTO/UV® 26 light box (Fotodyne, Inc., Hartland, WI). Embryos were exposed for 3 minutes, then imaged alongside unconverted transgenic and wildtype embryos with both 488nm and 546nm excitation.
Photoconversion of KikGR fluorescent protein in embryonic organs
Photoconversion of individual cells for cell tracking was achieved via 10–15 “bleach cycles” with 405nm photonkinesis laser at duration of 100ms over the course of 10–20 seconds, using the photobleach “Track-It” function of PerkinElmer ERS UltraVIEW. A 20x extra long working distance (ELWD) lens (NA 0.45, ∞/0–2 WD 7.4) was used with a “point” region of interest (ROI) setting in an attempt to convert single cells or small groups of neighboring cells. Empirically, this configuration converted 3.75 (SEM±0.43) cells per photoconversion event (defined here as 10–15 “bleach cycles” at 15% laser power, lasting 100μs each cycle). Full conversion of all available KikGR protein within a cell was scored by loss of signal in that cell in the green (488nm excitation) channel. At this point, photoconverted cells became visible in the red (568nm excitation) channel.
Photoconversion of large regions of the mesonephros was achieved in a similar manner using a custom region of interest (ROI) and 15–20 bleach cycles with the 405nm laser controlled by the photokinesis accessory of the acquisition software. Photoconversion was achieved with a 10x lens (NA 0.45, ∞/0.17 WD 4.0) with 15–20 bleach cycles at 15% laser power. Three-dimensional live images in both the green and red channels were acquired by capturing a Z-stack of approximately 40μm every 45 minutes for 8–24 hours using PerkinElmer ERS UltraVIEW acquisition software. Post-acquisition analysis of cell movement was conducted with Imaris software (Bitplane, Zurich, Switzerland).
Collection and photoconversion of pre-implantation embryos
Female iUBC-KikGR-1–7 transgenic mice were crossed to wild-type Swiss Webster outbred males. Zygotes were collected by standard techniques (Nagy et al., 2003) and cultured overnight. Two-cell embryos were observed on the following day and one blastomere per embryo was photoconverted using a point-ROI as described above.
Live imaging of Wolffian duct extension
Live organ culture
Gonads with adjacent mesonephroi were dissected and placed in a Millipore culture insert (Millipore Corporation, Billerica, MA) in a 35-mm poly-d-lysine-coated glass bottom culture dish (MatTek Corporation, Ashland, MA), containing 1mL explant growth media ((Dulbecco’s Modified Eagle Medium with 4.5 g/L D-glucose, without L-glutamine, sodium pyruvate and phenol red), containing 25% fetal bovine serum, 2 mM glutamate, 1 mM sodium pyruvate, 100 IU penicillin, and 0.1 mg/ml streptomycin). All reagents for making the media were purchased from Gibco (Invitrogen Corporation, Grand Island, NY). Live and still images were collected with a Perkin Elmer Spinning Disc Confocal microscope in an environmental chamber heated to 37°C and under 5% humidified CO2.
Photoconversion of cells in ex vivo organ cultures
Photoconversion of the rostral 1/3 of the mesonephros was achieved in explant cultures as described above (405nm laser at 15% laser power). A large region of interest (ROI) comprising all of the rostral mesonephros was defined for each explant. Photoconversion was achieved with a 10x lens (NA 0.45, ∞/0.17 WD 4.0) with 15–20 scans of the ROI at 15% laser power. A Z-stack of 4–6nm optical slices was taken through the entire explant immediately following photoconversion to confirm that photoconversion events were restricted to the defined ROI. If photoconverted cells were found outside the ROI at this point, these explants were discarded or kept as controls for culture conditions. Several unconverted explants were also cultured concurrently as controls for culture conditions and to be sure that red signal in converted explants represented photoconverted cells and not experimental artifacts. Z-stacks of converted and unconverted explants were taken immediately after photoconversion (t=0), at every 45 minute interval during the explant culture, and at the experimental endpoint (t=18h).
Supplementary Material
E11.5 iUBC-KikGR gonad and mesonephros exhibiting green fluorescence ubiquitously. A large region of interest (ROI) encompassing the rostral area of the mesonephros is defined, and this region is exposed to 405 nm light for approximately 1s between frames. During this exposure, the laser moves over the ROI, such that any one point is not exposed for the entire duration. Total time the total ROI is exposed to photoconversion wavelength is approximately 10 s. Total time elapsed is approximately 20 s.
Same as Movie S1A, but showing split red and green channels alongside the merged video. E11.5 iUBC-KikGR gonad and mesonephros exhibiting green fluorescence ubiquitously. A large region of interest (ROI, magenta outline) encompassing the rostral area of the mesonephros is defined, and this region is exposed to 405 nm light for approximately 1s between frames. During this exposure, the laser moves over the ROI, such that any one point is not exposed for the entire duration. Total time the total ROI is exposed to photoconversion wavelength is approximately 10 s. Total time elapsed is approximately 20 s.
2-cell iUBC-KikGR embryos. A single “point” region of interest (ROI) is defined in a small region of the cytoplasm of one cell, and this region is exposed to 405 nm light for 100 ms pulse between each frame. Total time the ROI is exposed is to photoconversion wavelength approximately 2 s. Total time elapsed is approximately 15 s. A somewhat longer exposure per unit area is required for photoconverting single cells in 2-cell embryos as compared to single cells in midgestation embryonic organs, presumably due to the larger cytoplasmic volume, and thus greater amount of KikGR protein in the 2-cell blastomeres.
E11.5 iUBC-KikGR gonad, with coelomic epithelium oriented to the top of the frame. A small “point” region of interest (ROI) is defined on a single cell in the coelomic epithelium. This ROI is exposed to 405 nm light for 100 ms between each frame. Total time the ROI is exposed is to photoconversion wavelength approximately 1s. Total time elapsed is approximately 10s. Although the ROI for exposure is focused on a single cell, 2 or 3 cells are photoconverted at once due to overlap of these cells in the Z direction within the ROI.
E5.5 UBC-KikGR embryo in which the distal visceral endoderm has been photoconverted. This region is the presumptive anterior visceral endoderm, which migrates toward the extra-embryonic ectoderm where it will define the anterior region of the embryo. This embryo is oriented with a “head-on” view, as in Figure 5. This video was compiled from two consecutive videos which were interrupted to re-orient the sample.
E11.5 iUBC-KikGR gonad and mesonephros, with the rostral third of the mesonephros labeled by photoconversion, including mesenchyme and ductal epithelia. Over time, the photoconverted Wolffian duct is observed extending caudally beyond the photoconverted boundary of the mesenchyme. This explant is oriented with the rostral on the left and caudal on the right. This video was compiled from two consecutive videos which were interrupted to re-orient the sample.
Acknowledgments
The authors would like to thank M. Dickinson and H. Adams for imaging assistance. This work was funded by a scholarship from Baylor Research Advocates for Student Scientists (BRASS) to SLG, NIH 5T32 CA09299-28 (SLG) and HD30284 and the Ben F. Love Endowment to RRB.
Literature Cited
- Hatta K, Tsujii H, Omura T. Cell tracking using a photoconvertible fluorescent protein. Nat Protoc. 2006;1:960–967. doi: 10.1038/nprot.2006.96. [DOI] [PubMed] [Google Scholar]
- Joseph A, Yao H, Hinton BT. Development and morphogenesis of the Wolffian/epididymal duct, more twists and turns. Dev Biol. 2009;325:6–14. doi: 10.1016/j.ydbio.2008.10.012. [DOI] [PMC free article] [PubMed] [Google Scholar]
- Kulesa PM, Teddy JM, Stark DA, Smith SE, McLennan R. Neural crest invasion is a spatially-ordered progression into the head with higher cell proliferation at the migratory front as revealed by the photoactivatable protein, KikGR. Dev Biol. 2008;316:275–287. doi: 10.1016/j.ydbio.2008.01.029. [DOI] [PMC free article] [PubMed] [Google Scholar]
- Kurotaki Y, Hatta K, Nakao K, Nabeshima Y, Fujimori T. Blastocyst axis is specified independently of early cell lineage but aligns with the ZP shape. Science. 2007;316:719–723. doi: 10.1126/science.1138591. [DOI] [PubMed] [Google Scholar]
- Nagy A, Gertsenstein M, Vintersten K, Behringer RR. Manipulating the Mouse Embryo: A Laboratory Manual. Cold Spring Harbor: Cold Spring Harbor Laboratory Press; 2003. [Google Scholar]
- Nowotschin S, Hadjantonakis AK. Use of KikGR a photoconvertible green-to-red fluorescent protein for cell labeling and lineage analysis in ES cells and mouse embryos. BMC Dev Biol. 2009;9:49. doi: 10.1186/1471-213X-9-49. [DOI] [PMC free article] [PubMed] [Google Scholar]
- Potts W, Tucker D, Wood H, Martin C. Chicken beta-globin 5′HS4 insulators function to reduce variability in transgenic founder mice. Biochem Biophys Res Commun. 2000;273:1015–1018. doi: 10.1006/bbrc.2000.3013. [DOI] [PubMed] [Google Scholar]
- Rodriguez TA, Srinivas S, Clements MP, Smith JC, Beddington RS. Induction and migration of the anterior visceral endoderm is regulated by the extra-embryonic ectoderm. Development. 2005;132:2513–2520. doi: 10.1242/dev.01847. [DOI] [PubMed] [Google Scholar]
- Schorpp M, Jager R, Schellander K, Schenkel J, Wagner EF, Weiher H, Angel P. The human ubiquitin C promoter directs high ubiquitous expression of transgenes in mice. Nucleic Acids Res. 1996;24:1787–1788. doi: 10.1093/nar/24.9.1787. [DOI] [PMC free article] [PubMed] [Google Scholar]
- Soriano P. Generalized lacZ expression with the ROSA26 Cre reporter strain. Nat Genet. 1999;21:70–71. doi: 10.1038/5007. [DOI] [PubMed] [Google Scholar]
- Srinivas S, Watanabe T, Lin CS, William CM, Tanabe Y, Jessell TM, Costantini F. Cre reporter strains produced by targeted insertion of EYFP and ECFP into the ROSA26 locus. BMC Dev Biol. 2001;1:4. doi: 10.1186/1471-213X-1-4. [DOI] [PMC free article] [PubMed] [Google Scholar]
- Stark DA, Kulesa PM. An in vivo comparison of photoactivatable fluorescent proteins in an avian embryo model. Dev Dyn. 2007;236:1583–1594. doi: 10.1002/dvdy.21174. [DOI] [PubMed] [Google Scholar]
- Stewart MD, Jang CW, Hong NW, Austin AP, Behringer RR. Dual fluorescent protein reporters for studying cell behaviors in vivo. Genesis. 2009;47:708–717. doi: 10.1002/dvg.20565. [DOI] [PMC free article] [PubMed] [Google Scholar]
- Tsutsui H, Karasawa S, Shimizu H, Nukina N, Miyawaki A. Semi-rational engineering of a coral fluorescent protein into an efficient highlighter. EMBO Rep. 2005;6:233–238. doi: 10.1038/sj.embor.7400361. [DOI] [PMC free article] [PubMed] [Google Scholar]
Associated Data
This section collects any data citations, data availability statements, or supplementary materials included in this article.
Supplementary Materials
E11.5 iUBC-KikGR gonad and mesonephros exhibiting green fluorescence ubiquitously. A large region of interest (ROI) encompassing the rostral area of the mesonephros is defined, and this region is exposed to 405 nm light for approximately 1s between frames. During this exposure, the laser moves over the ROI, such that any one point is not exposed for the entire duration. Total time the total ROI is exposed to photoconversion wavelength is approximately 10 s. Total time elapsed is approximately 20 s.
Same as Movie S1A, but showing split red and green channels alongside the merged video. E11.5 iUBC-KikGR gonad and mesonephros exhibiting green fluorescence ubiquitously. A large region of interest (ROI, magenta outline) encompassing the rostral area of the mesonephros is defined, and this region is exposed to 405 nm light for approximately 1s between frames. During this exposure, the laser moves over the ROI, such that any one point is not exposed for the entire duration. Total time the total ROI is exposed to photoconversion wavelength is approximately 10 s. Total time elapsed is approximately 20 s.
2-cell iUBC-KikGR embryos. A single “point” region of interest (ROI) is defined in a small region of the cytoplasm of one cell, and this region is exposed to 405 nm light for 100 ms pulse between each frame. Total time the ROI is exposed is to photoconversion wavelength approximately 2 s. Total time elapsed is approximately 15 s. A somewhat longer exposure per unit area is required for photoconverting single cells in 2-cell embryos as compared to single cells in midgestation embryonic organs, presumably due to the larger cytoplasmic volume, and thus greater amount of KikGR protein in the 2-cell blastomeres.
E11.5 iUBC-KikGR gonad, with coelomic epithelium oriented to the top of the frame. A small “point” region of interest (ROI) is defined on a single cell in the coelomic epithelium. This ROI is exposed to 405 nm light for 100 ms between each frame. Total time the ROI is exposed is to photoconversion wavelength approximately 1s. Total time elapsed is approximately 10s. Although the ROI for exposure is focused on a single cell, 2 or 3 cells are photoconverted at once due to overlap of these cells in the Z direction within the ROI.
E5.5 UBC-KikGR embryo in which the distal visceral endoderm has been photoconverted. This region is the presumptive anterior visceral endoderm, which migrates toward the extra-embryonic ectoderm where it will define the anterior region of the embryo. This embryo is oriented with a “head-on” view, as in Figure 5. This video was compiled from two consecutive videos which were interrupted to re-orient the sample.
E11.5 iUBC-KikGR gonad and mesonephros, with the rostral third of the mesonephros labeled by photoconversion, including mesenchyme and ductal epithelia. Over time, the photoconverted Wolffian duct is observed extending caudally beyond the photoconverted boundary of the mesenchyme. This explant is oriented with the rostral on the left and caudal on the right. This video was compiled from two consecutive videos which were interrupted to re-orient the sample.


