

Abstract
It is known that plasma phospholipid transfer protein (PLTP) activity influences lipoprotein metabolism. The liver is one of the major sites of lipoprotein production and degradation, as well as of PLTP expression. To address the impact of liver-expressed PLTP on lipoprotein metabolism, we created a mouse model that expresses PLTP in the liver acutely and specifically, with a PLTP-null background. This approach in mouse model preparation can also be used universally for evaluating the function of many other genes in the liver. We found that liver PLTP expression dramatically increases plasma levels of non-HDL-cholesterol (2.7-fold, P<0.0001), non-HDL-phospholipid (2.5-fold, P<0.001), and triglyceride (51%, P<0.01), but has no significant influence on plasma HDL-lipids, as compared with controls. Plasma apoB levels were also significantly increased in the PLTP-expressed mice (2.2-fold, P<0.001), but those of apoA-I were not. To explore the mechanism involved, we examined the lipidation and secretion of nascent VLDL, finding that liver PLTP expression significantly increases VLDL lipidation in hepatocyte microsomal lumen, and also VLDL secretion into the plasma. In conclusion, it is possible to prepare a mouse model that expresses the gene of interest only in the liver, but not in other tissues. Our results suggest, for the first time, that the major function of liver PLTP is to drive VLDL production and makes a small contribution to plasma PLTP activity, thus has marginal effect on plasma HDL levels.
Phospholipid transfer protein (PLTP) belongs to a family of lipid transfer/lipopolysaccharide-binding proteins, including lipopolysaccharide-binding protein (LBP), bactericidal/permeability-increasing protein (BPI), and CETP (1). In terms of lipid transfer activity, PLTP has its own characteristics. It has no neutral lipid transfer activity. PLTP circulates bound to HDL, and mediates the net transfer of phospholipids between unilaminar vesicles into HDL, and also the exchange of phospholipids between lipoproteins. The net transfer of phospholipids into HDL results in the formation of a larger, less dense species. Plasma PLTP is also a nonspecific lipid transfer protein. Several studies have indicated that PLTP is capable of transferring all common phospholipids. Besides them, it also efficiently transfers diacylglycerol, α-tocopherol, cerebroside, and lipopolysaccharides (2). Although CETP can also transfer phospholipids, there is no redundancy in the functions of PLTP and CETP in the mouse model (3). It has been shown that PLTP can act like the putative fusion factor to enlarge HDL particles (4). Huuskonen et al. reported that phospholipid transfer activity is a prerequisite for efficient PLTP-mediated HDL enlargement (5). Rye et al. reported that enrichment of triglyceride in the HDL core could promote such fusion (6).
PLTP transgenic mice showed a 2.5- to 4.5-fold increase in PLTP activity in plasma, as compared with controls. This resulted in a 30-40% reduction of plasma HDL cholesterol levels. PLTP gene knockout (KO) mice demonstrated a complete loss of phospholipid transfer activity (7). These animals showed a marked decrease in HDL cholesterol and apoA-I levels, demonstrating the important role of PLTP-mediated transfer of surface components of triglyceride-rich lipoprotein in the maintenance of HDL levels (7-9). Overall, PLTP overexpression or deficiency causes a significant reduction of HDL levels in the circulation, and we still cannot explain that adequately.
Apolipoprotein B (apoB) is the major protein component of VLDL and chylomicron (CM), which transport triglyceride from the liver and intestine, respectively, into the bloodstream (10). ApoB exists in two forms, apoB48 and apoB100 (11, 12). Increased hepatic apoB-containing lipoprotein (BLp) synthesis is the principal defect in subjects with familial combined hyperlipidemia (13, 14), and is also an important component of the dyslipidemia of diabetes and obesity (15, 16). Accumulating evidence suggests that the formation of apoB100-BLp (17) and apoB48-BLp (18, 19) is accomplished sequentially. The “two-step” model postulates that the initial product is a primordial particle, formed during apoB translation in the endoplasmic reticulum (ER). It is clear that microsomal triglyceride transfer protein (MTP) is involved in the early stage (1st step) of apoB lipidation. However, the mechanism involved in the later stage (2nd step) is still not well understood.
We have unexpectedly found that PLTP deficiency causes a significant impairment in hepatic secretion of VLDL (20). Likewise, it has been reported that animals over-expressing PLTP exhibit hepatic VLDL over-production (21). Associations of plasma PLTP activity with elevated apoB levels (22) have been found in humans, as well. In a recent study, Masson et al. found that human PLTP transgenic rabbits showed a significant increase of BLp, but not of HDL cholesterol, in the circulation. These animals demonstrated increased atherosclerotic lesions after a high-fat diet feeding, as compared with controls (23). Nevertheless, the surprising discovery that PLTP affects BLp secretion from the liver must be explored fully.
The liver is one of the major sites of lipoprotein production and degradation, as well as PLTP expression. To investigate the role of PLTP in lipoproteins homeostasis, we initially planned to prepare a liver-specific KO mouse model using the Cre-Loxp system under the control of an albumin promoter. Finally, we created a unique mouse model that expresses PLTP acutely and specifically in the liver, with a PLTP-null background. We studied lipoprotein metabolism, VLDL secretion, and VLDL lipidation in these animals, concluding that liver PLTP-mediated VLDL production is one of the driving forces for plasma lipoprotein metabolism.
Materials and Methods
PLTP-Flox mouse preparation
To prepare PLTP-Flox mice, a 9.16kb region used to construct the targeting vector was first subcloned from a positively identified C57BL/6 (RPCI23) BAC clone. The region was designed so that the short homology arm extended about 1.68kb 3′ to exon 3, and the long homology arm extended about 6.85kb long 5′ to exon 2. The loxP and FRT double-flanked Neo cassette was inserted on the 3′ side of exon 3, and the single loxP site was inserted at the 5′ side of exon 2. (Fig. 1A). All mice used in this study were aged 12-16 weeks, with a C57BL/6J genetic background. They were fed a rodent chow diet (Purina Laboratory Rodent Chow 5001). All animal procedures were approved by the SUNY Downstate Medical Center Animal Care and Use Committee.
Fig. 1. PLTP-Flox mouse preparation.

Panel A, Strategy for PLTP-Flox mouse breedin. One LoxP site is located in intron 1, and a Neo cassette double flanked with FRT/LoxP sites is placed in intron 3. Flp recombinase recognizes FRT sequences. AdV-FLP mediated Neo cassette deletion renders PLTP-LoxP-ΔNeo construct specifically in the liver. Panel B, PCR genotyping of tail-tip DNA. Two primers probe the region outside the Neo cassette. Another primer probes a region inside the Neo close to its 5′ end. −/−, Wild type, +/−, Heterozygous PLTP-Flox, +/+, Homozygous PLTP-Flox, AdV, Adenovirus.
Liver-specific PLTP-expressed mouse preparation
To prepare a liver-specific PLTP-expressed model, we took advantage of the FRT/Flp recombinase system. As shown in Figure 1A, the Neo cassette is double flanked with LoxP and FRT sequences. We eliminated the Neo cassette specifically in the liver, by using adenovirus (AdV)-mediated expression of Flp recombinase, which recognizes the FRT sequences (24).
Lipid and lipoprotein assays
The total cholesterol, total phospholipids, and triglycerides (TG) in plasma were assayed by enzymatic methods. Lipoprotein profiles were obtained by fast protein liquid chromatography (FPLC), using a Sepharose 6B column (7, 25).
Apolipoprotein measurement
Plasma apoE, apoB, and apoA-I levels were determined, as previously described (26). Briefly, 0.2 μl plasma were separated by 4-15% SDS gel electrophoresis, and immunoblotted with polyclonal antibodies against apoE (Abcam), apoB (US Biological), and apoA-I (Biodesign).
VLDL production measurement (in vivo)
Mice were injected with [35S]methionine (200μCi) to label apoB, [14C]-oleic acid (100 μCi) to label triglyceride, and with Poloxamer 407 to block the clearance of VLDL from the circulation. Plasma (150μ l) was collected 120 minutes after injection, and VLDL was isolated from the plasma by ultracentrifugation. The same volume of isolated VLDL (250μl) was loaded on 4-15% gradient gel, and apoB was separated by SDS-PAGE. Incorporation of 35S into ApoB48 and ApoB100 was assessed with a Fuji Bio-Imaging Analyzer (27). Lipids in isolated VLDL were extracted by the Folch method (28), and separated by thin-layer chromatograph (TLC). The amount of radioactivity in the TG fraction was measured by a liquid scintillation counter.
Measurement of VLDL lipidation in the lumen of liver microsomes
Fasting mice (5 hours) were injected intraperitoneally with [14C]-Oleic acid (100 μCi). Two hours after injection, the animals were sacrificed; livers were isolated and microsomes were prepared. Briefly, 350 mg of liver was placed in homogenization buffer (250mM sucrose, 300 mM Imidazole, pH 7.4), and homogenized for one minute. The homogenates were spun at 500 g for 10 minutes at 4°C. The postnuclear supernatant was spun at 100,000 g for 1 hour at 4°C to pellet the microsomes. Microsomal pellets were collected, and luminal contents were released using 0.1 M sodium carbonate pH 11 for 25 minutes at 21°C. After incubation, 5 mg/ml bovine serum albumin (BSA) was added to each sample. All the samples were then centrifuged at 100,000 g for 90 minutes at 21°C to separate the soluble contents (luminal) from the membranes. The contents were then neutralized by 10 mM Tris-HCL (pH 7.4), and lipids were extracted by the Folch method (28). The solvent was evaporated using nitrogen flow. Lipids were dissolved in chloroform and then subjected to TLC using Silica Gel 60 A (Whatman International Ltd, England) with a solvent system composed of hexane: diethyl ether: acetic acid (80:20:1). Separated lipids were visualized by iodine vapor and isolated, and radioactivity in the TG and PC regions was measured by liquid scintillation counter. The TG- and PC-related dpm of each sample was normalized based on total dpm in whole luminal contents. The results are expressed as the percentage of [14C]-TG or [14C]-PC dpm to total microsomal luminal dpm.
Statistical Analysis
Data were expressed as mean ± SD. Differences between groups were tested by Student’s t-test. A P value of less than 0.05 was considered significant.
RESULTS
PLTP-Flox mice have no PLTP activity
We have prepared homozygous PLTP-Flox mice (Fig. 1B), of a C57BL/6 genetic background. Of 55 progeny analyzed from heterozygous crosses by PCR of tail-tip DNA, 12 (22%) of the progeny were wild-type (WT), 28 (51%) heterozygous, and 15 (27%) homozygous for the PLTP-Flox allele (Fig. 1B). Homozygous crosses yielded viable progeny.
Unexpectedly, we found that homozygous PLTP-Flox mice have no PLTP activity in the circulation (Fig. 2A). In addition, plasma cholesterol and phospholipid levels of PLTP-Flox mice are similar to those of systemic PLTP KO ones (Figs. 2B and C). Fast-phase liquid chromatography (FPLC) showed that PLTP-Flox and PLTP KO mice have similar plasma cholesterol distribution patterns, which are different from those of WT animals (Fig. 2D).
Fig. 2. PLTP-Flox mice have no PLTP expression.

Panel A, Plasma PLTP activity. Panels B and C, plasma cholesterol and phospholipid levels, respectively. Panel D, plasma cholesterol distribution measured by FPLC. Pooled plasma (250 μl from five mice) was used. Values are mean ± SD, n=5, *P<0.01.
Liver-specific PLTP expression with a PLTP-null background
Neo cassette insertion in intron 3 could influence PLTP splicing (Fig. 1A). If we delete the cassette, we may rescue the PLTP expression. Since the Neo cassette is double-flanked by both LoxP and FRT sequences (Fig. 1A), we should be able to eliminate it specifically in the liver by using adenovirus (AdV)-mediated expression of Flp recombinase, which recognizes the FRT sequences (24). In this way we could create a mouse model in which only the liver, but not the other tissues, expresses PLTP. Indeed, AdV-Flp-mediated PLTP expression is exclusively in the liver (Fig. 3A). As shown in Figure 3B, control liver from AdV-GFP-treated PLTP-Flox mice has no PLTP activity, while AdV-Flp-injected PLTP-Flox mouse liver has PLTP activity comparable to that of WT animals. Moreover, AdV-Flp-injected PLTP-Flox mice have only about 25% of the plasma PLTP activity of WT ones (Fig. 3C), indicating that liver-expressed PLTP makes a small contribution to the PLTP activity in the blood.
Fig. 3. Liver-specific PLTP expression with a PLTP-null background.

AdV-Flp and AdV-GFP were injected into PLTP-Flox mice. Ten days after injection, liver, small intestine, lung, and adipose tissues were isolated, as well as plasma. Panel A, tissue PLTP mRNA assessment by real-time PCR. Panel B, liver PLTP activity measurement. Panel C, plasma PLTP activity measurement. Values are mean ± SD., n=5, *P<0.01.
Liver-expressed PLTP makes a major contribution to non-HDL-lipid but not HDL-lipid levels in the blood
As indicated in Table 1, the plasma levels of non-HDL-cholesterol, non-HDL-phospholipid, HDL-cholesterol, and HDL-phospholipid in AdV-GFP-treated PLTP-Flox male mice (controls) are comparable to those of systemic PLTP KO male mice (26±6 vs 25±3 mg/dl, 55±5 vs 39±3 mg/dl, 27±4 vs 22±5mg/dl, 67±12 vs 81±6 mg/dl, respectively) (7). More important, AdV-Flp-treated PLTP-Flox male animals demonstrate dramatically increased plasma non-HDL-cholesterol (2.7-fold, P<0.0001) and non-HDL-phospholipid (2.5-fold, P<0.0001). Furthermore, PLTP liver-specific expression significantly increases plasma triglyceride levels, as compared with controls (51%, P<0.01), a phenomenon not observed in systemic PLTP KO male mice, as compared with WT animals (Table 1). On the other hand, there are no significant changes in HDL-cholesterol and HDL-phospholipid levels.
Table 1.
Plasma lipid measurement.
| Non-HDL-C | Non-HDL-PL | HDL-C | HDL-PL | TG | |
|---|---|---|---|---|---|
| mg/dl | |||||
| AdV-GFP | 26±6 | 55±5 | 27±4 | 67±12 | 53±9 |
| AdV-Flp | 71±11* | 136±5* | 34±12 | 76±9 | 80±20* |
| WT | 30±9 | 51±13 | 81±8* | 160±10* | 51±5 |
| PLTP KO | 25±3 | 39±3 | 22±5 | 81±6 | 55±7 |
All mice are male. Value, Mean ± SD, n=6.Columns labeled with different lower-case letters are statistically different (P<0.01).
Plasma lipid distributions were also measured by FPLC, using pooled plasma. This showed that plasma cholesterol levels are dramatically increased in non-HDL fractions from liver-specific PLTP-expressed male mice, as compared with controls (Fig. 4A). There was a slight increase of HDL, but this effect is not comparable to the induction of non-HDL (Fig. 4A). This is also true for total phospholipid distribution (Fig. 4B), as well as that of triglyceride (Fig. 4C). The same phenomena were also observed in AdV-Flp-treated PLTP-Flox female mice, as compared with female controls (Supplementary Table S1 and Fig. S1 A-C).
Fig. 4. Lipid distribution measurement.

Plasma lipid distributions were analyzed by fast protein liquid chromatography (FPLC), using a Superose 6B column. A 250-μl aliquot of pooled plasma (from five male animals) was loaded onto the columns and eluted with Tris buffer (50 mM, pH 7.4) at a constant flow rate of 0.35 ml/min. An aliquot of 100 μl from each fraction was used for lipid determinations. Panel A, cholesterol distribution. Panel B, phospholipid distribution. Panel C, triglyceride distribution. Plasma apolipoproteins were measured by Western blot. Plasma (0.2 μl) was separated by 4-15% SDS-PAGE and immunoblotted with polyclonal antibodies against apoB (Abcam), and apoA-I (Abcam). The results were quantified with ImageJ software. Panel D, total apoB. Panel E, apoA-I. Values are mean ± SD., n=5, *P<0.001.
We next assessed plasma apolipoprotein levels by reducing SDS-PAGE, finding that liver-specific PLTP-expressed male mice have a marked increase of total apoB (2.3 fold, P<0.001) (Fig. 4D), but no increase of apoA-I (Fig. 4E), as compared with controls. This suggests that PLTP acute expression in the liver promotes apoB-containing lipoprotein production, but not that of apoA-I-containing lipoprotein.
Why liver-specific PLTP expression increases non-HDL lipid levels?
To investigate the mechanisms responsible for the induced triglyceride and apoB levels in liver-specific PLTP-expressed mouse plasma, we examined in vivo VLDL production rates. Both AdV-Flp- and AdV-GFP mice were simultaneously injected with [35S]-methionine to label apoB, [14C]-oleic acid to label triglyceride, and poloxamer 407 to block the clearance of VLDL from the circulation. We collected plasma 120 minutes after injection and isolated plasma VLDL by ultracentrifugation. We found that both [35S]-apoB and [14C]-triglyceride levels were significantly increased in the VLDL from liver-specific PLTP-expressed mice, as compared with that from the control group (Figs. 5A and B). This suggests that liver PLTP expression promotes VLDL secretion.
Fig. 5. Triglyceride-rich lipoprotein production and lipidation measurement.
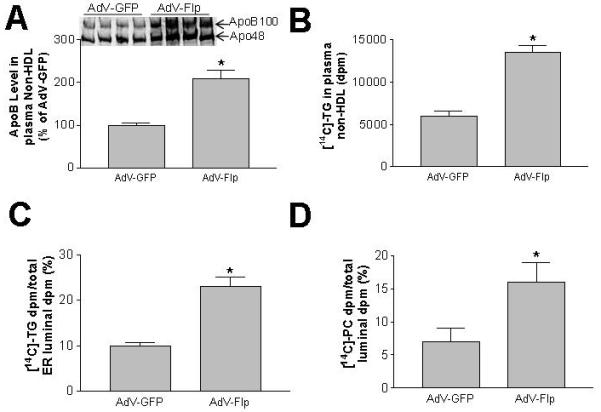
Triglyceride-rich lipoprotein production in vivo was measured as described in “Materials and Methods.” Panel A, [14C]-triglyceride levels in plasma. Panel B: total [35S]-apoB in plasma. Lipidation of TG-rich lipoprotein in the lumen of microsomes was measured as described in “Materials and Methods.” Panel C, TG-rich lipoprotein lipidation. Values are mean ± SD, n=5, *P<0.01. Panel D, PC content of microsomal luminal lipoproteins.
For further investigation of the mechanism(s), fasted AdV-Flp- and AdV-GFP mice were injected with [14C]-oleic acid. Two hours later, we sacrificed the mice and isolated the livers. Microsomal pellets were collected and luminal contents were released. We extracted lipids from the luminal contents. [14C]-triglycerides and [14C]-phosphatidylcholines were separated by TLC and quantified. We found that liver-specific PLTP-expressed mice demonstrate significantly higher levels of luminal [14C]-triglycerides (Fig. 5C) and [14C]-phosphatidylcholines (Fig. 5D) than controls, suggesting that PLTP acute expression in the PLTP-null liver increases VLDL lipidation.
Discussion
One of the key accomplishments of this study is the preparation of a mouse model having liver-specific PLTP expression with a PLTP-null background. Researchers have routinely utilized liver-specific gene knockout to evaluate the functions of certain genes in the liver. Albumin-Cre/Loxp (29), AdV-Cre/Loxp (26), and adenovirus-associated virus (AAV)-Cre/Loxp (30) are three approaches to preparing liver-specific KO mice. Although these methods are powerful, they have two obvious shortcomings: 1) the liver-specific gene KO cannot be achieved with 100% completeness; and 2) other tissues still normally express the studied gene, and may compensate for liver deficiency.
In this context, our mouse model, having liver-specific expression with a null background, is a novel tool for liver function studies. The phenotypes obtained from these mice are purely liver-specific. Two aspects are important in this approach. First, the insertion of a Neo cassette must inactivate gene expression. Second, the Neo cassette must flank with loxP or FRT sites (Fig. 1A) in order to delete the Neo cassette later. As shown in Figure 1A, the best approach is that the loxP and FRT doubled-flanked Neo cassette is inserted in one intron, and the single loxP site is inserted in another intron or promoter region. Liver-specific expressed animals could be prepared by using AdV-Flp or albumin-Flp transgene to delete the Neo cassette in the liver.
Another key finding of this study is that liver-specific PLTP expression can cause: 1) a significant increase of plasma non-HDL-lipid and apoB levels, but not those of HDL-lipid or apoA-I; 2) a significant increase of BLp production in vivo; and 3) a significant increase of BLp lipidation in the lumen of microsomes. Apparently, the acute expression of liver-specific PLTP has a remarkably different phenotype compared with that of WT mice, which express PLTP in various tissues. As a secretory protein, PLTP has long been known as a plasma transfer protein that mediates lipid exchange among lipoproteins in the circulation (2, 31-33). Accumulating data show that the function of PLTP in tissues is considerably distinguished from its role in plasma (33), but less effort has been expended so far to delineate its intracellular functions.
We could clearly dissect out the contribution of the liver to the total PLTP activity in the circulation, since liver-specific PLTP expression is observed with a PLTP-null background. There is no significant difference between AdV-Flp-PLTP-Flox and WT mice, in terms of liver PLTP activity (Fig. 3B), but the liver-PLTP expressed animals have only about 25% of the plasma PLTP activity of WT mice (Fig. 3C). This indicates that tissues other than the liver make a major contribution to the PLTP in the blood. Adipose tissues and lungs (34), as well as the small intestine (Jiang et al. unpublished observation), express sufficient amounts of PLTP mRNA. The contribution of these tissues to blood PLTP activity deserves further investigation.
We already knew that PLTP-deficient hepatocytes secrete less VLDL, as compared with WT controls (35), and it might thus be argued that there is no novelty in the present study, using liver-specific PLTP-expressed mice (corresponding to WT animals) and comparing them with control mice (corresponding to systemic PLTP KO animals). However, there are great differences between liver-specific PLTP-expressed and WT mice: 1) liver PLTP is expressed with a PLTP-null background; 2) PLTP expression in liver-specific mice is achieved by AdV-Flp injection within days, so that the effect is an acute one; 3) PLTP-expressed animals have lipid profiles similar to those of LDL mammals, such as humans, monkeys, rabbits, etc, while wild type mice are typical HDL mammals (36); and 4) triglyceride accumulation is observed in PLTP-expressed mice, but there is no difference in triglyceride levels between systemic PLTP KO and WT mice (7) (Table 1). Moreover, in previous studies we have never directly measured BLp lipidation in PLTP-deficient or WT hepatocyte microsomes (20, 35).
PLTP-mediated VLDL production per se is one of the driving forces for plasma lipoprotein metabolism. We have unexpectedly found that PLTP deficiency causes a significant impairment in hepatic secretion of VLDL (20). Likewise, it has been reported that animals over-expressing PLTP exhibit hepatic VLDL over-production (21). Associations of plasma PLTP activity with elevated apoB levels (22) have been found in human studies, as well. Our new results indicate that liver PLTP expression in PLTP-null-background mice dramatically increases VLDL levels, but has only a marginal effect on HDL levels. In a recent study, Masson et al. (23) found that human PLTP transgenic rabbits show a significant increase of non-HDL but not of HDL cholesterol in the circulation. This might reflect the real situation in humans, since rabbits are also LDL mammals.
Based on what we have observed in this study, as well as on a PLTP transgenic rabbit study (23), we are proposing a new model for PLTP function (Fig. 6). We believe that the major function of liver PLTP is driving VLDL production. As it is strongly evident in this study, liver-specific PLTP expression changes the plasma lipoprotein profile of the mouse from a dominant HDL pattern (Fig .2D) toward a dominant non-HDL one (Fig. 4). Liver-generated PLTP makes a small contribution to plasma PLTP activity which influences HDL levels by transferring phospholipid and free cholesterol from BLp to HDL.
Fig. 6. Working model of liver PLTP-mediated lipoprotein metabolism.

The 2nd step of BLp lipidation is involved in the fusion of primordial BLp and apoB-free/TG-rich lipid droplets, a process similar to HDL enlargement (5) (6). We speculate that cellular PLTP activity could be involved in this process (Panal A). According to present study, the major function of liver PLTP is driving VLDL production. Liver-generated PLTP makes a small contribution to plasma PLTP activity, thus having a small influence on HDL levels (Panal B).
It has been suggested that the formation of BLp (17-19) is accomplished by a “two-step” model. MTP is involved in the 1st step of apoB lipidation. However, we still do not understand the factors involved in the 2nd step of the lipidation (or maturation), in which apoB-containing primordial particles fuse with apoB-free/triglyceride-rich lipid droplets (37). Abundant triglyceride availability is essential, but that alone is not sufficient to drive BLp assembly. This is exemplified by studies using hepatic cells treated with n-3 fatty acids (38, 39) or insulin (40), in which active triglyceride synthesis does not result in VLDL production. In certain hepatoma cell lines (e.g., HepG2 cells), triglyceride synthesis can be effectively stimulated by oleate, but formation of VLDL is not achieved (41).
It has been shown that PLTP can act like the putative fusion factor to enlarge HDL particles (4). Huuskonen et al. reported that phospholipid transfer activity is a prerequisite for efficient PLTP-mediated HDL enlargement (5). Rye et al. reported that enrichment of triglyceride in the HDL core could promote such fusion (6). We believe that PLTP activity is involved in promoting BLp lipidation, since PLTP activity and triglyceride enrichment are two factors for PLTP-mediated HDL enlargement (5, 6), a process similar to the 2nd step of BLp lipidation (37). Indeed, in this study, we have provided evidence that liver PLTP expression can promote BLp lipidation in the lumen of microsomes (Figs. 5C and D).
It is known that there are three pathways for hepatic BLp secretory control: endoplasmic reticulum/proteasome-associated degradation (ERAD) (42), post-ER pre-secretory proteolysis (PERPP) (43), and receptor-mediated degradation, also known as reuptake (44). We have shown previously that PLTP deficiency decreases liver vitamin E content, increases hepatic oxidant tone, and substantially enhances ROS-dependent destruction of newly-synthesized apoB via PERPP (35), while PLTP overexpression has the opposite effect (45). It is possible that PERPP may also play a role in the liver-specific PLTP expressed mouse model used in this study, i.e. PLTP expression suppresses PERPP, thus promoting BLp secretion.
Although presently known risk factors have some predictive value for CAD, a major part of the variability in this process remains unexplained (46). Our finding that liver PLTP is responsible for VLDL production seems to increase considerably the likelihood that PLTP liver-specific inhibitor could be a novel therapeutic approach in the effort to moderate plasma VLDL/LDL levels. However, more studies are still needed to elucidate all aspects of liver-specific PLTP function, related to lipoprotein metabolism.
Supplementary Material
Footnotes
This work was supported by grants National Institute of Health HL69817.
PLTP, phospholipid transfer protein; BLp, apoB-containing lipoproteins; VLDL, very low density lipoprotein; HDL, high density lipoprotein; KO, knockout; WT, wild type.
References
- 1.Bruce C, Beamer LJ, Tall AR. The implications of the structure of the bactericidal/permeability-increasing protein on the lipid-transfer function of the cholesteryl ester transfer protein. Curr Opin Struct Biol. 1998;8:426–434. doi: 10.1016/s0959-440x(98)80118-8. [DOI] [PubMed] [Google Scholar]
- 2.Massey JB, Hickson D, She HS, Sparrow JT, Via DP, Gotto AM, Jr., Pownall HJ. Measurement and prediction of the rates of spontaneous transfer of phospholipids between plasma lipoproteins. Biochim Biophys Acta. 1984;794:274–280. doi: 10.1016/0005-2760(84)90156-5. [DOI] [PubMed] [Google Scholar]
- 3.Kawano K, Qin SC, Lin M, Tall AR, Jiang XC. Cholesteryl ester transfer protein and phospholipid transfer protein have nonoverlapping functions in vivo. J Biol Chem. 2000;275:29477–29481. doi: 10.1074/jbc.M003523200. [DOI] [PubMed] [Google Scholar]
- 4.Jauhiainen M, Metso J, Pahlman R, Blomqvist S, van Tol A, Ehnholm C. Human plasma phospholipid transfer protein causes high density lipoprotein conversion. J Biol Chem. 1993;268:4032–4036. [PubMed] [Google Scholar]
- 5.Huuskonen J, Olkkonen VM, Ehnholm C, Metso J, Julkunen I, Jauhiainen M. Phospholipid transfer is a prerequisite for PLTP-mediated HDL conversion. Biochemistry. 2000;39:16092–16098. doi: 10.1021/bi0019287. [DOI] [PubMed] [Google Scholar]
- 6.Rye KA, Jauhiainen M, Barter PJ, Ehnholm C. Triglyceride-enrichment of high density lipoproteins enhances their remodelling by phospholipid transfer protein. J Lipid Res. 1998;39:613–622. [PubMed] [Google Scholar]
- 7.Jiang XC, Bruce C, Mar J, Lin M, Ji Y, Francone OL, Tall AR. Targeted mutation of plasma phospholipid transfer protein gene markedly reduces high-density lipoprotein levels. J Clin Invest. 1999;103:907–914. doi: 10.1172/JCI5578. [DOI] [PMC free article] [PubMed] [Google Scholar]
- 8.Qin S, Kawano K, Bruce C, Lin M, Bisgaier C, Tall AR, Jiang X. Phospholipid transfer protein gene knock-out mice have low high density lipoprotein levels, due to hypercatabolism, and accumulate apoA-IV-rich lamellar lipoproteins. J Lipid Res. 2000;41:269–276. [PubMed] [Google Scholar]
- 9.Yan D, Navab M, Bruce C, Fogelman AM, Jiang XC. PLTP deficiency improves the anti-inflammatory properties of HDL and reduces the ability of LDL to induce monocyte chemotactic activity. J Lipid Res. 2004;45:1852–1858. doi: 10.1194/jlr.M400053-JLR200. [DOI] [PubMed] [Google Scholar]
- 10.Young SG. Recent progress in understanding apolipoprotein B. Circulation. 1990;82:1574–1594. doi: 10.1161/01.cir.82.5.1574. [DOI] [PubMed] [Google Scholar]
- 11.Chen SH, Habib G, Yang CY, Gu ZW, Lee BR, Weng SA, Silberman SR, et al. Apolipoprotein B-48 is the product of a messenger RNA with an organ-specific in-frame stop codon. Science. 1987;238:363–366. doi: 10.1126/science.3659919. [DOI] [PubMed] [Google Scholar]
- 12.Powell LM, Wallis SC, Pease RJ, Edwards YH, Knott TJ, Scott J. A novel form of tissue-specific RNA processing produces apolipoprotein-B48 in intestine. Cell. 1987;50:831–840. doi: 10.1016/0092-8674(87)90510-1. [DOI] [PubMed] [Google Scholar]
- 13.Goldstein JL, Schrott HG, Hazzard WR, Bierman EL, Motulsky AG. Hyperlipidemia in coronary heart disease. II. Genetic analysis of lipid levels in 176 families and delineation of a new inherited disorder, combined hyperlipidemia. J Clin Invest. 1973;52:1544–1568. doi: 10.1172/JCI107332. [DOI] [PMC free article] [PubMed] [Google Scholar]
- 14.Brunzell JD, Albers JJ, Chait A, Grundy SM, Groszek E, McDonald GB. Plasma lipoproteins in familial combined hyperlipidemia and monogenic familial hypertriglyceridemia. J Lipid Res. 1983;24:147–155. [PubMed] [Google Scholar]
- 15.Duvillard L, Pont F, Florentin E, Galland-Jos C, Gambert P, Verges B. Metabolic abnormalities of apolipoprotein B-containing lipoproteins in non-insulin-dependent diabetes: a stable isotope kinetic study. Eur J Clin Invest. 2000;30:685–694. [PubMed] [Google Scholar]
- 16.Riches FM, Watts GF, Naoumova RP, Kelly JM, Croft KD, Thompson GR. Hepatic secretion of very-low-density lipoprotein apolipoprotein B-100 studied with a stable isotope technique in men with visceral obesity. Int J Obes Relat Metab Disord. 1998;22:414–423. doi: 10.1038/sj.ijo.0800602. [DOI] [PubMed] [Google Scholar]
- 17.Rustaeus S, Stillemark P, Lindberg K, Gordon D, Olofsson SO. The microsomal triglyceride transfer protein catalyzes the post-translational assembly of apolipoprotein B-100 very low density lipoprotein in McA-RH7777 cells. J Biol Chem. 1998;273:5196–5203. doi: 10.1074/jbc.273.9.5196. [DOI] [PubMed] [Google Scholar]
- 18.Boren J, Rustaeus S, Olofsson SO. Studies on the assembly of apolipoprotein B-100- and B-48-containing very low density lipoproteins in McA-RH7777 cells. J Biol Chem. 1994;269:25879–25888. [PubMed] [Google Scholar]
- 19.Wang Y, McLeod RS, Yao Z. Normal activity of microsomal triglyceride transfer protein is required for the oleate-induced secretion of very low density lipoproteins containing apolipoprotein B from McA-RH7777 cells. J Biol Chem. 1997;272:12272–12278. doi: 10.1074/jbc.272.19.12272. [DOI] [PubMed] [Google Scholar]
- 20.Jiang XC, Qin S, Qiao C, Kawano K, Lin M, Skold A, Xiao X, et al. Apolipoprotein B secretion and atherosclerosis are decreased in mice with phospholipid-transfer protein deficiency. Nat Med. 2001;7:847–852. doi: 10.1038/89977. [DOI] [PubMed] [Google Scholar]
- 21.Lie J, de Crom R, van Gent T, van Haperen R, Scheek L, Lankhuizen I, van Tol A. Elevation of plasma phospholipid transfer protein in transgenic mice increases VLDL secretion. J Lipid Res. 2002;43:1875–1880. doi: 10.1194/jlr.m200166-jlr200. [DOI] [PubMed] [Google Scholar]
- 22.Colhoun HM, Taskinen MR, Otvos JD, Van Den Berg P, O’Connor J, Van Tol A. Relationship of phospholipid transfer protein activity to HDL and apolipoprotein B-containing lipoproteins in subjects with and without type 1 diabetes. Diabetes. 2002;51:3300–3305. doi: 10.2337/diabetes.51.11.3300. [DOI] [PubMed] [Google Scholar]
- 23.Masson D, Deckert V, Gautier T, Klein A, Desrumaux C, Viglietta C, Pais de Barros JP, et al. Worsening of Diet-Induced Atherosclerosis in a New Model of Transgenic Rabbit Expressing the Human Plasma Phospholipid Transfer Protein. Arterioscler Thromb Vasc Biol. 2011 doi: 10.1161/ATVBAHA.110.215756. [DOI] [PubMed] [Google Scholar]
- 24.Jones JR, Shelton KD, Magnuson MA. Strategies for the use of site-specific recombinases in genome engineering. Methods Mol Med. 2005;103:245–257. doi: 10.1385/1-59259-780-7:245. [DOI] [PubMed] [Google Scholar]
- 25.Fan Y, Shi F, Liu J, Dong J, Bui HH, Peake DA, Kuo MS, et al. Selective reduction in the sphingomyelin content of atherogenic lipoproteins inhibits their retention in murine aortas and the subsequent development of atherosclerosis. Arterioscler Thromb Vasc Biol. 2010;30:2114–2120. doi: 10.1161/ATVBAHA.110.213363. [DOI] [PMC free article] [PubMed] [Google Scholar]
- 26.Rohlmann A, Gotthardt M, Hammer RE, Herz J. Inducible inactivation of hepatic LRP gene by cre-mediated recombination confirms role of LRP in clearance of chylomicron remnants. J Clin Invest. 1998;101:689–695. doi: 10.1172/JCI1240. [DOI] [PMC free article] [PubMed] [Google Scholar]
- 27.Aalto-Setala K, Fisher EA, Chen X, Chajek-Shaul T, Hayek T, Zechner R, Walsh A, et al. Mechanism of hypertriglyceridemia in human apolipoprotein (apo) CIII transgenic mice. Diminished very low density lipoprotein fractional catabolic rate associated with increased apo CIII and reduced apo E on the particles. J Clin Invest. 1992;90:1889–1900. doi: 10.1172/JCI116066. [DOI] [PMC free article] [PubMed] [Google Scholar]
- 28.Folch J, Lees M, Sloane Stanley GH. A simple method for the isolation and purification of total lipides from animal tissues. J Biol Chem. 1957;226:497–509. [PubMed] [Google Scholar]
- 29.Timmins JM, Lee JY, Boudyguina E, Kluckman KD, Brunham LR, Mulya A, Gebre AK, et al. Targeted inactivation of hepatic Abca1 causes profound hypoalphalipoproteinemia and kidney hypercatabolism of apoA-I. J Clin Invest. 2005;115:1333–1342. doi: 10.1172/JCI23915. [DOI] [PMC free article] [PubMed] [Google Scholar]
- 30.Kitajima K, Marchadier DH, Miller GC, Gao GP, Wilson JM, Rader DJ. Complete prevention of atherosclerosis in apoE-deficient mice by hepatic human apoE gene transfer with adeno-associated virus serotypes 7 and 8. Arterioscler Thromb Vasc Biol. 2006;26:1852–1857. doi: 10.1161/01.ATV.0000231520.26490.54. [DOI] [PubMed] [Google Scholar]
- 31.Tall AR, Abreu E, Shuman J. Separation of a plasma phospholipid transfer protein from cholesterol ester/phospholipid exchange protein. J Biol Chem. 1983;258:2174–2180. [PubMed] [Google Scholar]
- 32.Day JR, Albers JJ, Lofton-Day CE, Gilbert TL, Ching AF, Grant FJ, O’Hara PJ, et al. Complete cDNA encoding human phospholipid transfer protein from human endothelial cells. J Biol Chem. 1994;269:9388–9391. [PubMed] [Google Scholar]
- 33.Albers JJ, Vuletic S, Cheung MC. Role of plasma phospholipid transfer protein in lipid and lipoprotein metabolism. Biochim Biophys Acta. 2011 doi: 10.1016/j.bbalip.2011.06.013. [DOI] [PMC free article] [PubMed] [Google Scholar]
- 34.Jiang XC, Bruce C. Regulation of murine plasma phospholipid transfer protein activity and mRNA levels by lipopolysaccharide and high cholesterol diet. J Biol Chem. 1995;270:17133–17138. doi: 10.1074/jbc.270.29.17133. [DOI] [PubMed] [Google Scholar]
- 35.Jiang XC, Li Z, Liu R, Yang XP, Pan M, Lagrost L, Fisher EA, et al. Phospholipid transfer protein deficiency impairs apolipoprotein-B secretion from hepatocytes by stimulating a proteolytic pathway through a relative deficiency of vitamin E and an increase in intracellular oxidants. J Biol Chem. 2005;280:18336–18340. doi: 10.1074/jbc.M500007200. [DOI] [PubMed] [Google Scholar]
- 36.Maldonado EN, Casanave EB, Aveldano MI. Major plasma lipids and fatty acids in four HDL mammals. Comp Biochem Physiol A Mol Integr Physiol. 2002;132:297–303. doi: 10.1016/s1095-6433(02)00031-4. [DOI] [PubMed] [Google Scholar]
- 37.Hamilton RL, Wong JS, Cham CM, Nielsen LB, Young SG. Chylomicron-sized lipid particles are formed in the setting of apolipoprotein B deficiency. J Lipid Res. 1998;39:1543–1557. [PubMed] [Google Scholar]
- 38.Lang CA, Davis RA. Fish oil fatty acids impair VLDL assembly and/or secretion by cultured rat hepatocytes. J Lipid Res. 1990;31:2079–2086. [PubMed] [Google Scholar]
- 39.Wang H, Chen X, Fisher EA. N-3 fatty acids stimulate intracellular degradation of apoprotein B in rat hepatocytes. J Clin Invest. 1993;91:1380–1389. doi: 10.1172/JCI116340. [DOI] [PMC free article] [PubMed] [Google Scholar]
- 40.Sparks JD, Sparks CE. Insulin modulation of hepatic synthesis and secretion of apolipoprotein B by rat hepatocytes. J Biol Chem. 1990;265:8854–8862. [PubMed] [Google Scholar]
- 41.Gibbons GF, Khurana R, Odwell A, Seelaender MC. Lipid balance in HepG2 cells: active synthesis and impaired mobilization. J Lipid Res. 1994;35:1801–1808. [PubMed] [Google Scholar]
- 42.Fisher EA, Ginsberg HN. Complexity in the secretory pathway: the assembly and secretion of apolipoprotein B-containing lipoproteins. J Biol Chem. 2002;277:17377–17380. doi: 10.1074/jbc.R100068200. [DOI] [PubMed] [Google Scholar]
- 43.Pan M, Cederbaum AI, Zhang YL, Ginsberg HN, Williams KJ, Fisher EA. Lipid peroxidation and oxidant stress regulate hepatic apolipoprotein B degradation and VLDL production. J Clin Invest. 2004;113:1277–1287. doi: 10.1172/JCI19197. [DOI] [PMC free article] [PubMed] [Google Scholar]
- 44.Williams KJ, Brocia RW, Fisher EA. The unstirred water layer as a site of control of apolipoprotein B secretion. J Biol Chem. 1990;265:16741–16744. [PubMed] [Google Scholar]
- 45.Yang XP, Yan D, Qiao C, Liu RJ, Chen JG, Li J, Schneider M, et al. Increased atherosclerotic lesions in apoE mice with plasma phospholipid transfer protein overexpression. Arterioscler Thromb Vasc Biol. 2003;23:1601–1607. doi: 10.1161/01.ATV.0000085841.55248.13. [DOI] [PubMed] [Google Scholar]
- 46.Maher V, Sinfuego J, Chao P, Parekh J. Primary prevention of coronary heart disease. What has WOSCOPS told us and what questions remain? West Of Scotland Coronary Prevention Study. Drugs. 1997;54:1–8. doi: 10.2165/00003495-199754010-00001. [DOI] [PubMed] [Google Scholar]
Associated Data
This section collects any data citations, data availability statements, or supplementary materials included in this article.