Abstract
Phenotype-driven approaches to gene discovery using inbred mice have been instrumental in identifying genetic determinants of inherited blood dyscrasias. The recessive mutant scat (severe combined anemia and thrombocytopenia) alternates between crisis and remission episodes, indicating an aberrant regulatory feedback mechanism common to erythrocyte and platelet formation. Here, we identify a missense mutation (G125V) in the scat Rasa3 gene, encoding a Ras GTPase activating protein (RasGAP), and elucidate the mechanism producing crisis episodes. The mutation causes mislocalization of RASA3 to the cytosol in scat red cells where it is inactive, leading to increased GTP-bound Ras. Erythropoiesis is severely blocked in scat crisis mice, and ∼94% succumb during the second crisis (∼30 d of age) from catastrophic hematopoietic failure in the spleen and bone marrow. Megakaryopoiesis is also defective during crisis. Notably, the scat phenotype is recapitulated in zebrafish when rasa3 is silenced. These results highlight a critical, conserved, and nonredundant role for RASA3 in vertebrate hematopoiesis.
Keywords: mouse model, red blood cells, development, inherited anemia
Genetically defined inbred mouse models have been instrumental in identifying genes required for normal erythropoiesis and the pathological basis of inherited anemia (1–4). However, despite the vast array of knowledge gained regarding the signaling pathways, transcriptional control, and structural program of erythroid development, significant gaps in our understanding of erythropoiesis remain, as evidenced by the existence of both human patients and animal models with anemia of unknown molecular origins.
Scat (severe combined anemia and thrombocytopenia) is a spontaneous, autosomal recessive mutant that arose on the BALB/cBy inbred mouse strain (5). Homozygotes show a cyclic phenotype with alternating episodes of crisis and remission. Crisis episodes, as the name implies, are primarily characterized by severe anemia and thrombocytopenia. A significant leukopenia is observed as well. The first crisis episode begins in utero, lasts until postnatal day (P) 9 on average, and is associated with 10–15% mortality. Remarkably, homozygotes that survive the first crisis enter a remission phase wherein the disease phenotype reverts to normal. This remission is transient, however, and is followed by a second crisis episode during which 94% of scat/scat mice die by P30. We previously showed that the scat phenotype is transferable via the hematopoietic stem cells (5).
In the present study, we positionally cloned scat revealing a mutation in the Rasa3 gene. RASA3, also called GAPIII or IP4BP (inositol 1,3,4,5-tetrakisphosphate, IP4, binding protein), is a member of the GAP1 family of Ras GTPase-activating proteins (GAPs) (6). Membrane localization is critical for GAP activity for all family members, which are highly conserved and share a common domain structure (7, 8). C2A and C2B domains are involved in membrane binding and calcium-dependent activation of some GAPs. However, RASA3 fulfills its function in a calcium-independent manner. RASA3 is constitutively bound to the membrane via interactions of its pleckstrin homology (PH) domain with PIP2 and PIP3. Upon stimulation, the Bruton’s tyrosine kinase (Btk) domain binds IP4, and RASA3 is activated. The catalytic activity of RASA3 is located within the RasGAP domain.
The small GTPase Ras oscillates between an active GTP-bound form and an inactive GDP-bound form. GAPs negatively regulate Ras by accelerating GTP hydrolysis and converting Ras to the inactive GDP-bound form. Ras is a critical mediator of cytokine-dependent signaling in erythropoiesis (erythropoietin, Epo; stem cell factor, SCF) (9, 10) and thrombopoiesis (thrombopoietin, TPO) (11, 12), playing a central role in transmitting signals to multiple effector pathways that regulate cell proliferation, differentiation, and survival. Ras is also important in B- and T lymphocyte lineage development (13). Oncogenic forms of Ras are involved in ∼30% of all human cancers and are particularly common in myeloid malignancies (14).
Despite the fact that multiple RasGAPs are known (15), we show here that RASA3 plays a critical, nonredundant role in erythropoiesis and megakaryopoiesis. Specifically, we show that scat carries a missense mutation (G125V) between the two C2 domains of RASA3. RASA3 is membrane bound in red cells of scat wild-type (WT) littermates, as expected, but is mislocalized to the cytosol in scat homozygotes, resulting in loss of GAP activity and significantly increased levels of active, GTP-bound Ras. Erythropoiesis is severely blocked with evidence of a maturational delay in megakaryopoiesis apparent as well, and ∼94% of scat/scat mice succumb during the second crisis (∼30 d of age) from catastrophic hematopoietic failure in both the spleen and bone marrow. Morpholino knockdowns of rasa3 in zebrafish result in profound anemia and thrombocytopenia, recapitulating the scat phenotype and emphasizing a critical conserved and nonredundant role for Rasa3 in vertebrate erythropoiesis and megakaryopoiesis.
Results
Scat Phenotype Reflects a Missense Mutation in Rasa3.
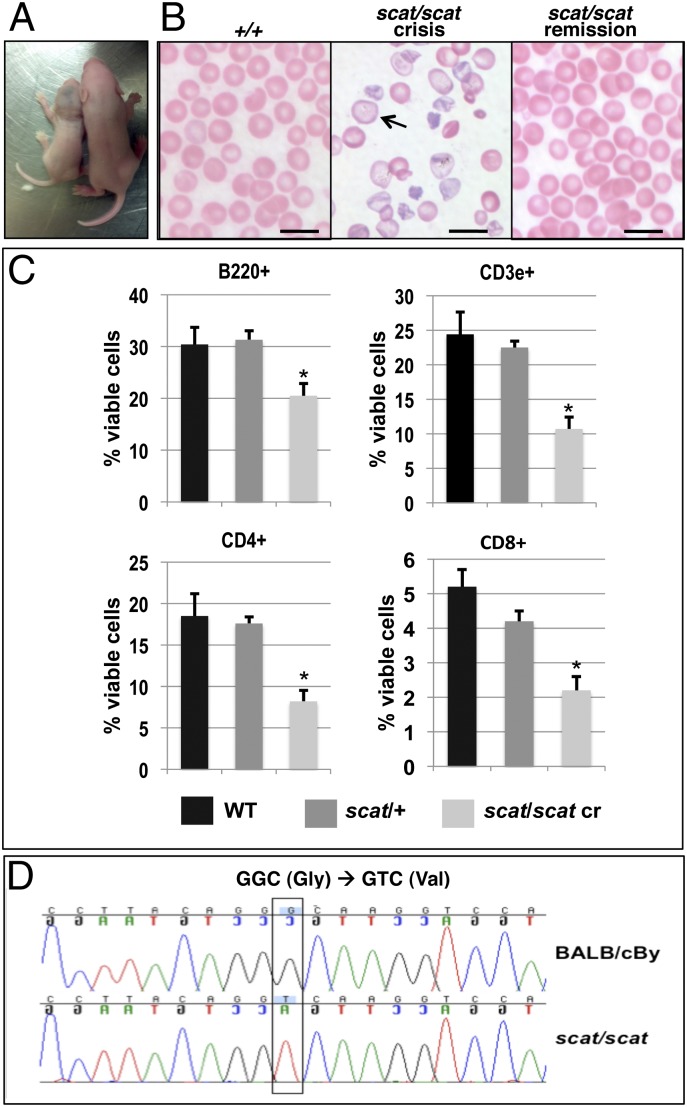
In agreement with the original description (5), we observed that homozygous scat mice are severely affected at birth and are easily identifiable by their reduced size, pallor, and bruises compared with their normal littermates (Fig. 1A). Only ∼15% of newborns are homozygotes, indicating significant loss in utero, as described previously. Complete blood counts (Table 1) obtained on animals during the second crisis confirm severe anemia. The spleen size is dramatically increased, and reticulocytes are markedly increased, indicative of compensatory acceleration of erythropoiesis. Peripheral blood smears (Fig. 1B) demonstrate severe poikilocytosis, anisocytosis, and polychromatophilia with frequent hypochromic cells during crisis. Accordingly, the cell hemoglobin concentration mean (CHCM) (analogous to the mean cell hemoglobin concentration, MCHC) and mean of the reticulocyte cell hemoglobin distribution (CHr) values (Table 1) are markedly decreased in scat crisis. Because scat crisis blood is frequently lipemic, the hemoglobin is falsely elevated and thus the calculated indices, mean cell hemoglobin and MCHC, are invalid. The red cell morphology suggests hemolysis contributes to the scat anemia; total bilirubin levels support this conclusion [0.53 ± 0.04 (X ± SEM, n = 8) in scat crisis vs. 0.31 ± 0.05 mg/dL in WT (n = 4)]. In addition, platelets are dramatically decreased in number, as are leukocytes. The low white blood cell count during crisis is attributable to lymphopenia. Flow cytometry analyses reveal markedly decreased B220+ B cells, CD3e+ T cells, and CD4+ and CD8+ T-cell subsets in peripheral blood (Fig. 1C). Despite the severe lymphopenia in scat crisis mice, the disease is not lymphocyte mediated. The scat phenotype, including cyclic disease progression, is completely recapitulated in mice doubly homozygous for scat and either of the immunodeficient mutations, scid or Rag1tm1Mom −/−, in which B and T lymphocytes are absent (16). Clearly, the severe anemia and thrombocytopenia phenotype neither follows from nor is dependent upon loss of lymphocytes. A striking aspect of the scat phenotype is its cyclical nature. All hematologic parameters and red cell morphology normalize during remission (Table 1 and Fig. 1B).
Fig. 1.
The scat phenotype is due to a mutation in Rasa3. (A) Scat homozygous mice in crisis (Left) are small, pale, and show extensive bruising compared with their normal littermates (Right). (B) Wright-Giemsa stained peripheral blood smears demonstrate severe poikilocytosis, anisocytosis, and polychromatophilia with frequent hypochromic cells (arrow) during crisis compared with WT (+/+); red cell morphology reverts to normal during remission. (Scale bar, 10 μM.) (C) Leukopenia in scat homozygotes during crisis primarily reflects a striking loss of lymphocytes. X ± SEM *P < 0.05, Tukey HSD test. (D) Fine mapping and sequencing reveals a G-to-T transversion in the Rasa3 gene in scat that creates a missense mutation (G125V) in a highly conserved residue.
Table 1.
Hematologic values
| Genotype | WBC, ×103/μL | RBC, ×106/μL | Hgb, g/dL | Hct, % | MCV, fL | CHCM, g/dL | CHr, pg | PLT, ×103/μL | Retic, % | Spleen weight |
| +/+ | 6.1 ± 1.6 | 8.6 ± 0.6 | 12.9 ± 1.3 | 42.1 ± 3.3 | 48.8 ± 1.4 | 30.0 ± 0.7 | 16.8 ± 0.4 | 1070 ± 177 | 12.1 ± 4.2 | 0.77 ± 0.06 |
| scat/+ | 4.4 ± 0.9* | 8.5 ± 0.5 | 12.4 ± 0.7 | 40.8 ± 2.6 | 47.9 ± 1.5 | 29.8 ± 0.9 | 16.5 ± 0.7 | 977 ± 174 | 13.9 ± 3.9 | 0.76 ± 0.05 |
| scat/scat cr | 2.3 ± 1.3** | 2.9 ± 1.4** | 4.6 ± 2.1** | 14.8 ± 8.1** | 54.2 ± 5.4** | 22.1 ± 2.0** | 12.5 ± 4.3** | 172 ± 137** | 54.7 ± 7.0** | 2.96 ± 0.20** |
| scat/scat rem | 4.7 ± 0.2 | 9.6 ± 0.6 | 15.1 ± 1.2* | 46.4 ± 4.3 | 48.5 ± 1.6 | 28.8 ± 2.4 | 17.1 ± 1.1 | 927 ± 124 | 8.5 ± 2.6 | 1.07 ± 0.06 |
All mice 3–4 wk of age. All values X ± SD; cr, crisis; rem, remission. WBC, white blood cell count; RBC, red blood cell count; Hgb, hemoglobin; Hct, hematocrit; MCV, mean cell volume; CHCM, cell hemoglobin concentration mean (mean of the red cell hemoglobin distribution, directly measured on a cell-by-cell basis with the Advia analyzer); CHr, mean of the reticulocyte cell hemoglobin distribution; PLT, platelet count, Retic, reticulocyte; spleen weight is % body weight. *P ≤ 0.001 vs. +/+; **P ≤ 0.001 vs. +/+ and scat/+.
To better understand the scat phenotype, we positionally cloned scat to identify the underlying gene defect. Previously, scat was localized to a broad interval on mouse chromosome (Chr) 8 (16). Using an F2 intercross, we narrowed the interval containing scat to 1.25 Mb between rs29938012 (13.47 Mb) and D8Mit124 on proximal Chr 8 (14.72 Mb). The interval contained 18 known or predicted genes (Mouse Genome Informatics, MGI; http://informatics.jax.org). We sequenced all exons and intron–exon boundaries within the interval. The only sequence change found was a G-to-T transversion in exon 5 of Rasa3, creating a missense mutation (G125V) (Fig. 1D).
Rasa3 Appears Early in Development and Is Widely Expressed.
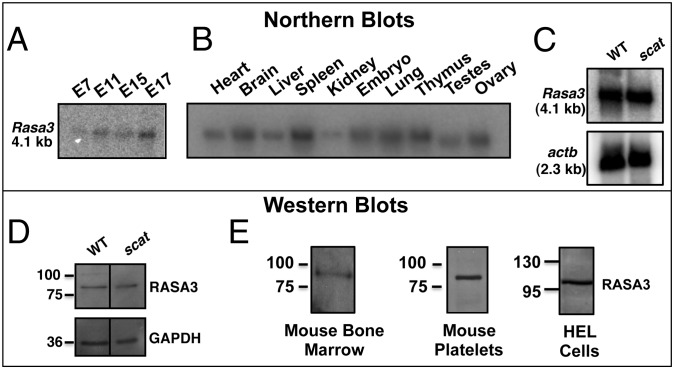
Rasa3 mRNA is expressed early in embryonic development in wild-type (WT) mice and its expression increases as development proceeds (Fig. 2A). In WT adults, Rasa3 is widely expressed (Fig. 2B) with high expression in the spleen, an erythropoietic organ in mice. Normal amounts of Rasa3 mRNA are detected in scat spleen (Fig. 2C), as is expected for a missense mutation. Also as expected in the case of a missense mutation, protein levels of RASA3 are normal in scat fetal liver cells as assessed by Western blot (Fig. 2D), and this result is highly reproducible. RASA3 is present in the crude membranes of WT bone marrow cells (Fig. 2E, Left). Finally, we confirmed its presence in WT platelets (Fig. 2E, Center), as previously described (17). However, we were unable to ascertain RASA3 protein status in scat platelets during crisis due to their very low number (Table 1). Significantly, RASA3 is also present in human erythroleukemia cells (HEL cells) (Fig. 2E, Right) (18) and transcripts are detected in human erythroid compartments by microarray analysis (19).
Fig. 2.
Rasa3 appears early in development and is widely expressed in adult tissues. (A) Northern blot analysis of WT embryos shows that Rasa3 is expressed early in development, from at least embryonic day 7. (B) Northern blot analysis of adult WT tissues demonstrates widespread expression of Rasa3. (C) Normal levels of Rasa3 mRNA are found in scat spleen. (D) Western blot analyses demonstrate normal levels of RASA3 protein in scat fetal liver cells. (E) Abundant levels of RASA3 are present in WT bone marrow cell membranes and platelets and in human erythroleukemia (HEL) cells.
Defective Erythropoiesis and Megakaryopoiesis in scat.
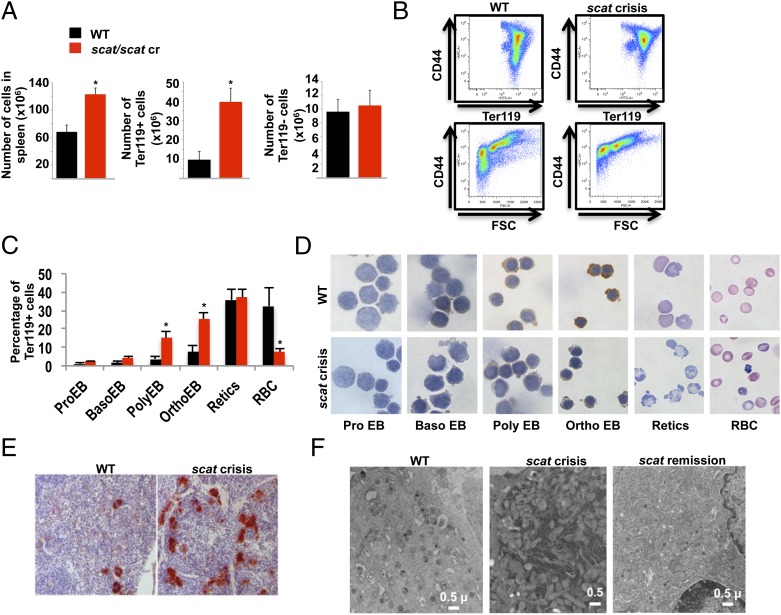
Spleen erythropoiesis increases significantly under stress conditions (20). An increased number of total cells in the spleen was observed in scat animals in crisis due to the expansion of the red pulp, as shown by the significant increase of the Ter119+ but not the Ter119− cell population compared with control littermates (Fig. 3A). FACS analyses using CD44 and Ter119 or CD44 and forward scatter (FSC) as markers of terminal erythroid differentiation (21) reveal a significant delay in erythropoiesis (Fig. 3B). Erythropoiesis is clearly not blocked, as mature erythrocytes are produced in scat crisis (Fig. 1B). Quantitation of the six distinguishable erythroid populations demonstrates an accumulation of polychromatophilic and orthochromatic erythroblasts (Fig. 3C and Fig. S1). On the basis of this gating, we sorted erythroid cells and stained them with o-dianizidine to assess their hemoglobin content. Interestingly, in scat, the delay in differentiation is associated with a significant decrease in hemoglobinization (Fig. 3D). These data are consistent with the overt appearance of the spleen during crisis episodes. Unlike most mouse models of anemia, where the spleen remains grossly enlarged and deep red to purple in color throughout life, scat spleens shrink in size as the crisis deepens in severity and become a pale shade of pink. Loss of the normal nodular splenic architecture is apparent at this time, reflecting expansion of the red pulp (Fig. S2B). Despite this expansion, however, benzidene staining is dramatically reduced in severe crisis, confirming that hemoglobinization is severely compromised (Fig. S2A).
Fig. 3.
Delayed erythropoiesis and megakaryopoiesis in scat spleen. (A) An increase in total spleen cell number (Left) attributable to a dramatic increase in Ter119+ erythroid cells (Center) is seen in the scat crisis spleen. All values X ± SEM; *P < 0.05, t test. (B) By flow cytometry using CD44 and Ter119 or CD44 and forward scatter (FSC) as markers of differentiation, a significant block in erythropoiesis is observed in scat during crisis. (C and D) Quantitation of the different spleen populations demonstrates an accumulation of polychromatophilic and orthochromatic erythroblasts (C) associated with a decrease in hemoglobinization within these cells (D). X ± SEM; *P < 0.05, t test. (E) An increased number of megakaryocytes is seen during crisis as evidenced by acetylcholinesterase staining. (F) By transmission electron microscopy, scat crisis megakaryocytes display features characteristic of a significant developmental delay. See text for details. During remission, megakaryocyte characteristics normalize.
We performed the same FACS analyses on bone marrow; a dramatic decrease in the number of both Ter119+ and Ter119− cells and the same delay in erythropoiesis are evident (Fig. S3 A and B). However, contrary to what we observed in the spleen, quantitative effects on individual erythroid populations were not significant statistically (Fig. S3C), although defective hemoglobinization was again apparent in sorted cells (Fig. S3D). Histopathological analysis confirms bone marrow failure as evidenced by increasing loss of marrow cellularity as crisis becomes more and more severe (Fig. S2C).
Increased numbers of megakaryocytes are present in the spleen and bone marrow of scat animals during crisis episodes as demonstrated by acetylcholinesterase staining (Fig. 3E). By transmission electron microscopy, these megakaryocytes are morphologically aberrant. In WT mice, features of normal megakaryocyte maturation are readily apparent (Fig. 3F). A well-developed demarcation membrane system (DMS) with well-defined platelet forming areas containing abundant granules is systematically observed. These features are lacking in scat megakaryocytes during crisis (Fig. 3F). Instead, the DMS is highly disorganized with no platelet-forming areas and few granules. In addition, megakaryocytes frequently exhibit hypersegmented nuclei and excess rough endoplasmic reticulum (Fig. 3F and Fig. S4). These morphological characteristics indicate an abundance of immature megakaryocytes. Severe thrombocytopenia, which stimulates megakaryopoiesis, likely also results from defective platelet release and/or survival in the peripheral blood. Thus, the situation seems analogous to erythropoiesis in that both differentiation and peripheral defects contribute to thrombocytopenia in scat crisis. Notably, megakaryocyte morphology normalizes during remission (Fig. 3F).
Knockdown of rasa3 in Zebrafish Leads to Anemia and Thrombocytopenia.
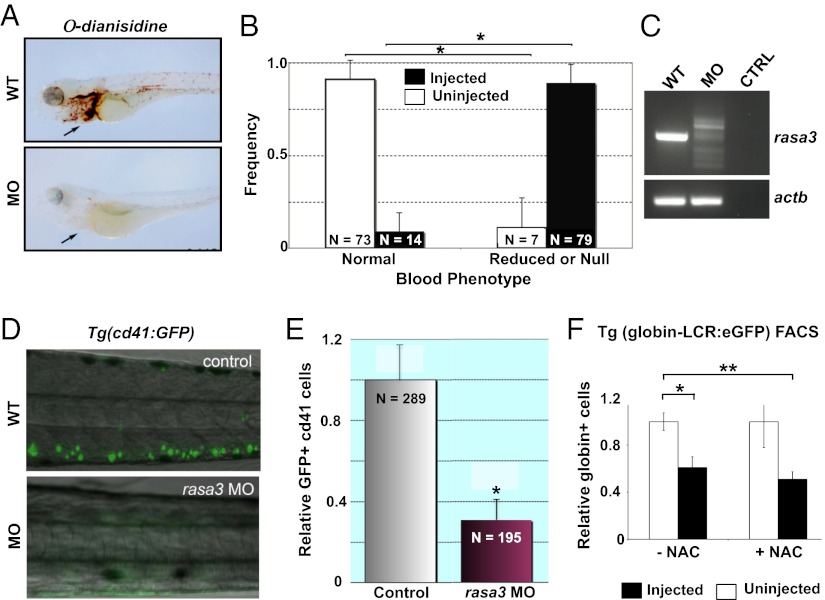
The dramatic phenotype in mice resulting from a conservative mutation in Rasa3 led us to investigate its function in another animal model. We used the zebrafish (Danio rerio), an excellent in vivo model system for studying hematological disorders (22). By whole mount in situ hybridization, rasa3 transcripts are observed predominantly in the central nervous system and at lower levels in a nontissue restricted distribution (Fig. S5A), analogous to the pattern observed in adult mouse tissues (Fig. 2B). In contrast, the erythroid-specific transcription factor, gata-1, shows restricted expression to the intermediate cell mass (ICM), the functional equivalent of mammalian yolk sac blood islands (Fig. S5A). To assess the role of rasa3 in erythropoiesis, we disrupted mRNA expression in zebrafish embryos using two splice-blocking morpholino oligomers (MO) in tandem (Table S1) (23). This knockdown resulted in profound anemia, visualized by the severe reduction in hemoglobinized cells following staining with o-dianisidine compared with uninjected embryos (Fig. 4A and Fig. S5B). With respect to degree of hemoglobinization, embryos were graded as either “normal” or “reduced/null.” On the basis of these criteria, 85% of MO-injected embryos were reduced or null, versus only 9% of uninjected embryos (Fig. 4B). RT-PCR analysis of morphant RNA showed alternate rasa3 mRNA species, eventually leading to nonsense-mediated mRNA decay, whereas no such alternate spliceoforms occurred in uninjected embryos, demonstrating accurate targeting of the morpholinos (Fig. 4C). Off-target effects were excluded by normal RT-PCR products for β-actin (actb) (Fig. 4C).
Fig. 4.
rasa3 knockdown in zebrafish recapitulates the scat anemia and thrombocytopenia phenotype. (A) In WT embryos, abundant ο-dianisidine positive hemoglobinized cells are seen in the heart and vessels (arrow) at 72 h postfertilization, whereas positive cells are absent in rasa3 morphants (MO). (B) Quantitation of the range of embryos containing normal and reduced or null number of hemoglobinized cells at 72 h postfertilization from control (uninjected) and rasa3 MO (injected). X ± SEM; *P < 0.05, t test. (C) By RT-PCR, abnormally processed rasa3 mRNA splice forms are found in MO compared with −RNA control (CTRL) and uninjected embryos (WT). actb serves as a control of off-target effects. (D) Silencing of rasa3 results in loss of GFP+ cd41-thrombocytes (green) in the transgenic Tg(cd41:GFP) line (MO) compared with control (WT). (E) Quantitation of GFP+ cd41-thrombocytes by flow cytometry in control and rasa3 morphant (MO) embryos. X ± SEM; *P < 0.05, t test. (F) Treatment of WT zebrafish (uninjected) and rasa3 MO (injected) from the Tg(globin LCR:eGFP) transgenic line with the potent antioxidant N-acetyl cysteine (+NAC) fails to improve anemia in the rasa3 MO embryos, indicating that generation of ROS per se is not a contributing factor in the anemia. −NAC, exposed to vehicle carrier only. X ± SEM; *P < 0.05; **P < 0.01, t test.
Although zebrafish lack megakaryocytes, zebrafish thrombocytes function as the hemostatic cellular equivalent of mammalian platelets (24). We used the transgenic Tg(cd41:GFP) line to evaluate the loss-of-function phenotype on thrombocytes using rasa3 morpholinos. GFP-tagged thrombocytes were markedly reduced in the rasa3 morphants compared with control embryos (Fig. 4D). This reduction in GFP+ thrombocytes, quantified using flow cytometry, was significant (Fig. 4E), in agreement with the thrombocytopenia observed in scat.
Contribution of Reactive Oxygen Species (ROS) to the rasa3-Mediated Anemia.
We exposed zebrafish control and rasa3 morphant embryos from the Tg(globin LCR:eGFP) transgenic line to N-acetyl cysteine (NAC), a potent antioxidant, reactive oxygen scavenger (25, 26). There was no increase in the number of GFP+ erythrocytes after NAC treatment compared with the −NAC treatment cohorts among rasa3 morphants (Fig. 4F), indicating that ROS per se is not a contributing factor for the rasa3-mediated anemia. The dose of rasa3 morpholino used is therapeutic, given the reduction in the number of GFP+ erythrocytes, phenocopying the rasa3 loss-of-function anemia.
RASA3 Is Down-Regulated During Reticulocyte Maturation.
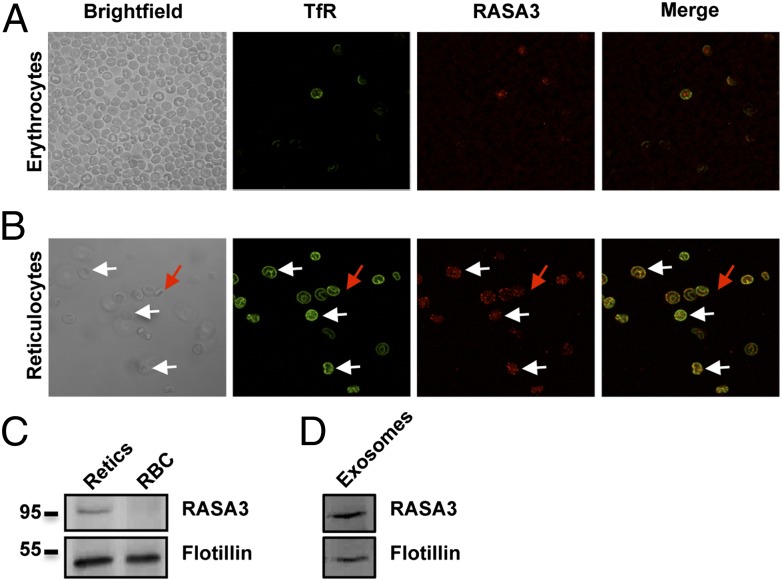
To gain further insights into RASA3 function in the mature red cell, we performed immunofluorescence experiments. Red cells were collected from the retroorbital vein of WT animals and stained for RASA3 (Fig. 5A). To our surprise, RASA3 was absent from most of the cells and found only in a small population that was also positive for the transferrin receptor (TfR). Previous studies have demonstrated that the TfR is completely lost during reticulocyte maturation (27), and we hypothesized that RASA3 was down-regulated concomitantly with the TfR. We induced reticulocytosis (>20%) by bleeding WT mice and after purification on a Percoll gradient, reticulocytes were colabeled with antibodies against RASA3 and TfR. These reticulocytes were positive for both TfR and RASA3. In terms of localization, RASA3 was found primarily on the plasma membrane, but also in internal compartments where it colocalized with the TfR (Fig. 5B, white arrow). Cells that were negative for the TfR were also negative for RASA3 (Fig. 5B, red arrow), emphasizing loss of both proteins during reticulocyte maturation. Western blots of reticulocytes and erythrocytes (Fig. 5C) and reticulocytes cultured in vitro for 24 or 48 h (Fig. S6) confirmed that RASA3 is lost during reticulocyte maturation both in vivo and in vitro (Fig. 5C and Fig. S6), whereas levels of flotillin-1 remain constant. A significant membrane remodeling occurs at the reticulocyte stage, and secretion of exosomes (∼50–100 nm particles) plays a key role in that process (28). We collected exosomes secreted from immature red cells cultured in vitro. RASA3 is associated with these vesicles (Fig. 5D). Together, these results demonstrate that, in WT mice, RASA3 is lost during reticulocyte maturation via the exosomal pathway.
Fig. 5.
RASA3 is lost during reticulocyte maturation through the exosomal pathway. (A) In WT red cells, RASA3 is found in very few cells that are also positive for the TfR by immunofluorescence. (B) After erythropoietic stress by phlebotomy and isolation of reticulocytes on a Percoll gradient, a strong staining for RASA3 is observed on the plasma membrane and in some internal compartments where it colocalizes with the TfR (white arrows). Mature red cells, assessed by negative staining of the TfR (red arrow) are also negative for RASA3. (C) Western blot analyses of reticulocytes and mature erythrocytes (RBC) show that RASA3 is lost during reticulocyte maturation, and (D) is associated with exosomes secreted during maturation.
RASA3 Is Mislocalized in scat Reticulocytes.
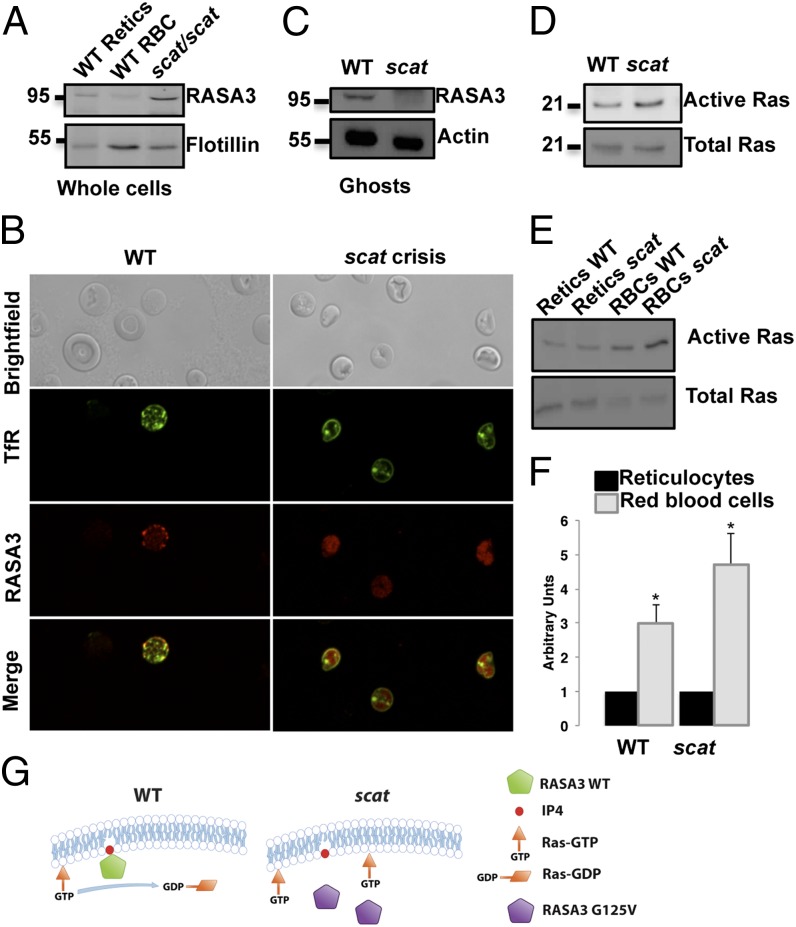
We next assessed RASA3 in purified WT reticulocytes and whole blood from scat mice (∼50–60% reticulocytes). By Western blot, using whole cells, we detected RASA3 in both (Fig. 6A). However, confocal microscopy experiments showed that, contrary to WT reticulocytes, RASA3 is found predominantly in the cytosol of scat reticulocytes (Fig. 6B). Therefore, we prepared membrane ghost fractions from both WT and scat reticulocytes. Coomassie blue staining of electrophoretically separated ghost proteins did not show any major differences in scat versus WT (Fig. S7). However, by Western blot, we observed that RASA3 was absent from the membrane fraction in scat (Fig. 6C), confirming the microscopy data.
Fig. 6.
RASA3 is mislocalized in scat leading to its loss of function. (A) Western blot analyses on scat peripheral blood show that RASA3 is present in whole red cells (predominantly reticulocytes). (B) By immunofluorescence, RASA3 is mislocalized to the cytosol in scat. (C) Western blot analysis of the red cell membrane ghost fractions confirms the presence of RASA3 on the membrane in WT mice and loss of membrane-bound RASA3 in scat. (D) As a consequence of mislocalization to the cytosol, active GTP-bound active Ras is increased in scat. (E) Consistent with the loss of RASA3 during maturation, active Ras levels are increased in mature red blood cells (RBCs), both in WT and scat as shown by Western blot. (F) Quantitation of the bands demonstrates a higher degree of increase in scat RBCs. X ± SEM; *P < 0.05, t test. (G) Proposed model in which the scat disease during crisis episodes results from RASA3 protein mislocalization leading to loss of its GAP activity.
G125V in Rasa3 Is a Loss-of-Function Mutation.
Previous reports have shown that RASA3 must be membrane associated to function as a RasGAP (7, 8). We hypothesized that lack of membrane association would have consequences on scat RASA3 GAP activity and thus Ras activity. Due to the simplicity of the cells in terms of organization with a cytosol free of organelles, erythrocytes represent a choice model to study signaling processes that would be difficult to assess in a more complex system. Furthermore, with RASA3 lost during reticulocyte maturation, mature red cells are in steady state in terms of Ras activity regulation, the endogenous GAP activity of Ras being very low (29). We affinity purified active Ras using the Ras-binding domain of Raf1, and detected GTP-bound Ras by Western blot analysis using an anti-Ras antibody. We consistently found increased GTP-bound Ras in scat red cells, whereas total levels of Ras were constant between WT and scat (Fig. 6D). Due to loss of RASA3 via the exosomal pathway during reticulocyte maturation, active Ras is increased in both WT and scat mature red cells compared with reticulocytes (Fig. 6E). However, quantitation of the bands by scanning densitometry demonstrates a significantly higher degree of increase in scat (Fig. 6F). These results indicate that the G125V mutation induces a RASA3 loss of function in scat due to mislocalization in the cytosol with concomitant loss of GAP activity, which in turn leads to higher levels of active, GTP-bound Ras (Fig. 6G). Notably, increased active Ras is associated with a significant delay in erythroid differentiation (10).
Discussion
Described over 20 y ago (5), the scat phenotype has remained largely unexplained. This study brings an explanation for the phenotype observed during crisis episodes and, most importantly, identifies Rasa3 as a unique critical actor in both erythropoiesis and megakaryopoiesis in vertebrates. A Rasa3 knockout mouse model exists, and mutant mice are embryonic lethal at E12.5–13.5 due in part to massive hemorrhage (30). This embryonic lethality confirms a critical role for Rasa3 during development and differentiation. In addition, bioinformatics data strengthen our findings that the G125V mutation in RASA3 is critical to its function. Analysis in JalView (Ensembl, http://www.ensembl.org) confirms that G125 is highly conserved across metazoans. Furthermore, Panther cSNP (http://www.pantherdb.org) and SIFT (sorting intolerant from tolerant, http://blocks.fhcrc.org/sift) both predict that the G125V change would alter function and not be tolerated. Although this mutation does not impact the expression levels of RASA3 during erythropoiesis, it leads to its mislocalization to the cytosol in scat cells. In this context, we propose a model in which cytosolic RASA3 in scat cannot fulfill its function of downregulating Ras (Fig. 6G). As a consequence, higher levels of RasGTP are found in scat, and contribute the dramatic phenotype encountered during crisis, which ultimately leads to hematopoietic failure in both the spleen and bone marrow.
It is well documented that both increased and decreased levels of active Ras result in defective erythropoiesis (9, 10, 31, 32). Thus, both overactive Ras, which significantly delays erythroid differentiation, and peripheral hemolysis contribute to the scat anemia. Other mechanisms are likely involved as well, such as defects at the megakaryocyte-erythroid progenitor (MEP) or even hematopoietic stem cell (HSC) level. Similarly, significant differentiation delays in megakaryopoiesis are indicated by the increased numbers of immature megakaryocytes, and although not yet formally proven, defects in platelet release and/or peripheral survival probably contribute as well. Studies in zebrafish indicate that generation of ROS is not a factor in the Rasa3-mediated anemia.
The mechanism of remission remains enigmatic. Up-regulation of a compensatory protein(s) is one possibility, although such a mechanism must be cyclic itself. In that light, RASA2, another member of the RasGAP family closely related to RASA3, is expressed in the spleen (BioGPS: http://biogps.org). Possibly, splenomegaly and the concomitant increased cellularity results in higher RASA2 (or some other protein) levels that transiently compensate for RASA3 deficiency, leading to remission. However, when the spleen cellularity returns to normal during remission, RASA2 decreases and no longer compensates, and another crisis ensues. Clearly, extensive studies will be required to test this and other potential mechanisms underlying the cyclic nature of scat.
We could not identify the specific Ras isoform(s) (K-, H- or N-Ras) affected in scat, possibly due to low expression levels in mature red cells. Accordingly, it is important to note that total levels of Ras are decreased by about 50% during reticulocyte maturation (Fig. 6E). Previous reports suggest roles for both K- and N-Ras during erythropoiesis (9, 33). Identification of the specific Ras isoform affected in scat during erythropoiesis and megakaryopoiesis will unravel new insights into receptor tyrosine kinase cell signaling pathways operating both up- and downstream of Ras upon engagement by erythropoietin and thrombopoietin.
No evidence of oncogenesis has ever been observed in scat mice. The very small numbers of homozygous scat mice that survive the second crisis period (6% of scat/scat newborns) preclude extensive analysis. However, no signs of cancer were seen in three mice necropsied to date, with the oldest being 6 mo of age. Future analyses of lineage-specific knockout mice that potentially will survive longer may shed light on whether the increased active Ras levels in scat are sufficient to be oncogenic.
Finally, although no human disease has yet been associated with RASA3 deficiency, it is present in the membrane of HEL cells (Fig. 2E) and detected in microarray studies (19). Mouse and human RASA3 share 95% amino acid identity and are thus likely to be functionally very similar. It is therefore tempting to suggest that some yet unexplained phenomena of human anemia and thrombocytopenia could be due to a mutation in Rasa3. Taken together, these results highlight a unique critical role for the RASA3/Ras axis during vertebrate erythropoiesis and megakaryopoiesis.
Methods
Animal protocols were reviewed and approved by the institutional animal care and use committees (IACUC) of The Jackson Laboratory and the New York Blood Center. Zebrafish husbandry: Standard AB and Tü strains, transgenic lines Tg(cd41:GFP) (34), Tg(globin LCR:GFP) (35), and cloche (clom39) (36), were maintained, bred, and staged according to standard methods. All zebrafish experiments were conducted in compliance with IACUC regulations of Children’s Hospital Boston.
Supplementary Material
Acknowledgments
We thank Dr. Joseph Italiano for access to the Orca IIER CCD camera and fluorescence imaging software, Dr. Karin Hoffmeister for use of the FACS machine, Dr. Leonard Zon for the Tg(globin LCR:GFP) line, Dr. Robert Handin for the Tg(cd41:GFP) line, and Dr. Michel Vidal for the HEL cells. This research was supported by grants from the American Heart Association (to K.A.S. and J.D.C.), the American Society of Hematology (to K.A.S.), the March of Dimes Foundation (to B.H.P.), and by the National Institutes of Health Grants R01 DK070838 and P01 HL032262 (to B.H.P.) and R01 HL088468 (to L.L.P.).
Footnotes
The authors declare no conflict of interest.
*This Direct Submission article had a prearranged editor.
This article contains supporting information online at www.pnas.org/lookup/suppl/doi:10.1073/pnas.1204948109/-/DCSupplemental.
References
- 1.Mikkola HK, Orkin SH. Gene targeting and transgenic strategies for the analysis of hematopoietic development in the mouse. Methods Mol Med. 2005;105:3–22. doi: 10.1385/1-59259-826-9:003. [DOI] [PubMed] [Google Scholar]
- 2.Orkin SH. Transcription factors and hematopoietic development. J Biol Chem. 1995;270:4955–4958. doi: 10.1074/jbc.270.10.4955. [DOI] [PubMed] [Google Scholar]
- 3.Orkin SH, Zon LI. Genetics of erythropoiesis: Induced mutations in mice and zebrafish. Annu Rev Genet. 1997;31:33–60. doi: 10.1146/annurev.genet.31.1.33. [DOI] [PubMed] [Google Scholar]
- 4.Kerenyi MA, Orkin SH. Networking erythropoiesis. J Exp Med. 2010;207:2537–2541. doi: 10.1084/jem.20102260. [DOI] [PMC free article] [PubMed] [Google Scholar]
- 5.Peters LL, McFarland-Starr EC, Wood BG, Barker JE. Heritable severe combined anemia and thrombocytopenia in the mouse: Description of the disease and successful therapy. Blood. 1990;76:745–754. [PubMed] [Google Scholar]
- 6.Yarwood S, Bouyoucef-Cherchalli D, Cullen PJ, Kupzig S. The GAP1 family of GTPase-activating proteins: Spatial and temporal regulators of small GTPase signalling. Biochem Soc Trans. 2006;34:846–850. doi: 10.1042/BST0340846. [DOI] [PubMed] [Google Scholar]
- 7.Fukuda M, Mikoshiba K. Structure-function relationships of the mouse Gap1m. Determination of the inositol 1,3,4,5-tetrakisphosphate-binding domain. J Biol Chem. 1996;271:18838–18842. doi: 10.1074/jbc.271.31.18838. [DOI] [PubMed] [Google Scholar]
- 8.Kupzig S, et al. GAP1 family members constitute bifunctional Ras and Rap GTPase-activating proteins. J Biol Chem. 2006;281:9891–9900. doi: 10.1074/jbc.M512802200. [DOI] [PMC free article] [PubMed] [Google Scholar]
- 9.Khalaf WF, et al. K-Ras is essential for normal fetal liver erythropoiesis. Blood. 2005;105:3538–3541. doi: 10.1182/blood-2004-05-2021. [DOI] [PubMed] [Google Scholar]
- 10.Zhang J, Lodish HF. Endogenous K-ras signaling in erythroid differentiation. Cell Cycle. 2007;6:1970–1973. doi: 10.4161/cc.6.16.4577. [DOI] [PubMed] [Google Scholar]
- 11.Fishley B, Alexander WS. Thrombopoietin signalling in physiology and disease. Growth Factors. 2004;22:151–155. doi: 10.1080/08977190410001720851. [DOI] [PubMed] [Google Scholar]
- 12.Matsumura I, Kanakura Y. Molecular control of megakaryopoiesis and thrombopoiesis. Int J Hematol. 2002;75:473–483. doi: 10.1007/BF02982109. [DOI] [PubMed] [Google Scholar]
- 13.Iritani BM, Forbush KA, Farrar MA, Perlmutter RM. Control of B cell development by Ras-mediated activation of Raf. EMBO J. 1997;16:7019–7031. doi: 10.1093/emboj/16.23.7019. [DOI] [PMC free article] [PubMed] [Google Scholar]
- 14.Schubbert S, Shannon K, Bollag G. Hyperactive Ras in developmental disorders and cancer. Nat Rev Cancer. 2007;7:295–308. doi: 10.1038/nrc2109. [DOI] [PubMed] [Google Scholar]
- 15.Bernards A, Settleman J. GAP control: Regulating the regulators of small GTPases. Trends Cell Biol. 2004;14:377–385. doi: 10.1016/j.tcb.2004.05.003. [DOI] [PubMed] [Google Scholar]
- 16.Peters LL, Barker JE. Novel inheritance of the murine severe combined anemia and thrombocytopenia (Scat) phenotype. Cell. 1993;74:135–142. doi: 10.1016/0092-8674(93)90301-6. [DOI] [PubMed] [Google Scholar]
- 17.McNulty TJ, Letcher AJ, Dawson AP, Irvine RF. Tissue distribution of GAP1(IP4BP) and GAP1(m): Two inositol 1,3,4,5-tetrakisphosphate-binding proteins. Cell Signal. 2001;13:877–886. doi: 10.1016/s0898-6568(01)00197-8. [DOI] [PubMed] [Google Scholar]
- 18.Lu X, Fein A, Feinstein MB, O’Rourke FA. Antisense knock out of the inositol 1,3,4,5-tetrakisphosphate receptor GAP1(IP4BP) in the human erythroleukemia cell line leads to the appearance of intermediate conductance K(Ca) channels that hyperpolarize the membrane and enhance calcium influx. J Gen Physiol. 1999;113:81–96. doi: 10.1085/jgp.113.1.81. [DOI] [PMC free article] [PubMed] [Google Scholar]
- 19.Merryweather-Clarke AT, et al. Global gene expression analysis of human erythroid progenitors. Blood. 2011;117:e96–e108. doi: 10.1182/blood-2010-07-290825. [DOI] [PubMed] [Google Scholar]
- 20.Paulson RF, Shi L, Wu DC. Stress erythropoiesis: New signals and new stress progenitor cells. Curr Opin Hematol. 2011;18:139–145. doi: 10.1097/MOH.0b013e32834521c8. [DOI] [PMC free article] [PubMed] [Google Scholar]
- 21.Chen K, et al. Resolving the distinct stages in erythroid differentiation based on dynamic changes in membrane protein expression during erythropoiesis. Proc Natl Acad Sci USA. 2009;106:17413–17418. doi: 10.1073/pnas.0909296106. [DOI] [PMC free article] [PubMed] [Google Scholar]
- 22.Shafizadeh E, Paw BH. Zebrafish as a model of human hematologic disorders. Curr Opin Hematol. 2004;11:255–261. doi: 10.1097/01.moh.0000138686.15806.71. [DOI] [PubMed] [Google Scholar]
- 23.Summerton J, Weller D. Morpholino antisense oligomers: Design, preparation, and properties. Antisense Nucleic Acid Drug Dev. 1997;7:187–195. doi: 10.1089/oli.1.1997.7.187. [DOI] [PubMed] [Google Scholar]
- 24.Jagadeeswaran P, Sheehan JP, Craig FE, Troyer D. Identification and characterization of zebrafish thrombocytes. Br J Haematol. 1999;107:731–738. doi: 10.1046/j.1365-2141.1999.01763.x. [DOI] [PubMed] [Google Scholar]
- 25.Yu D, et al. miR-451 protects against erythroid oxidant stress by repressing 14-3-3zeta. Genes Dev. 2010;24:1620–1633. doi: 10.1101/gad.1942110. [DOI] [PMC free article] [PubMed] [Google Scholar]
- 26.North TE, et al. PGE2-regulated wnt signaling and N-acetylcysteine are synergistically hepatoprotective in zebrafish acetaminophen injury. Proc Natl Acad Sci USA. 2010;107:17315–17320. doi: 10.1073/pnas.1008209107. [DOI] [PMC free article] [PubMed] [Google Scholar]
- 27.Pan BT, Johnstone RM. Fate of the transferrin receptor during maturation of sheep reticulocytes in vitro: Selective externalization of the receptor. Cell. 1983;33:967–978. doi: 10.1016/0092-8674(83)90040-5. [DOI] [PubMed] [Google Scholar]
- 28.Blanc L, Vidal M. Reticulocyte membrane remodeling: Contribution of the exosome pathway. Curr Opin Hematol. 2010;17:177–183. doi: 10.1097/MOH.0b013e328337b4e3. [DOI] [PubMed] [Google Scholar]
- 29.Bos JL, Rehmann H, Wittinghofer A. GEFs and GAPs: Critical elements in the control of small G proteins. Cell. 2007;129:865–877. doi: 10.1016/j.cell.2007.05.018. [DOI] [PubMed] [Google Scholar]
- 30.Iwashita S, et al. Versatile roles of R-Ras GAP in neurite formation of PC12 cells and embryonic vascular development. J Biol Chem. 2007;282:3413–3417. doi: 10.1074/jbc.C600293200. [DOI] [PubMed] [Google Scholar]
- 31.Liu L, Zhu S, Gong Z, Low BC. K-ras/PI3K-Akt signaling is essential for zebrafish hematopoiesis and angiogenesis. PLoS ONE. 2008;3:e2850. doi: 10.1371/journal.pone.0002850. [DOI] [PMC free article] [PubMed] [Google Scholar]
- 32.Zhang J, Lodish HF. Constitutive activation of the MEK/ERK pathway mediates all effects of oncogenic H-ras expression in primary erythroid progenitors. Blood. 2004;104:1679–1687. doi: 10.1182/blood-2004-04-1362. [DOI] [PubMed] [Google Scholar]
- 33.Johnson L, et al. K-ras is an essential gene in the mouse with partial functional overlap with N-ras. Genes Dev. 1997;11:2468–2481. doi: 10.1101/gad.11.19.2468. [DOI] [PMC free article] [PubMed] [Google Scholar]
- 34.Lin HF, et al. Analysis of thrombocyte development in CD41-GFP transgenic zebrafish. Blood. 2005;106:3803–3810. doi: 10.1182/blood-2005-01-0179. [DOI] [PMC free article] [PubMed] [Google Scholar]
- 35.Ganis JJ, et al. Zebrafish globin switching occurs in two developmental stages and is controlled by the LCR. Dev Biol. 2012;366:185–194. doi: 10.1016/j.ydbio.2012.03.021. [DOI] [PMC free article] [PubMed] [Google Scholar]
- 36.Stainier DY, Weinstein BM, Detrich HW, 3rd, Zon LI, Fishman MC. Cloche, an early acting zebrafish gene, is required by both the endothelial and hematopoietic lineages. Development. 1995;121:3141–3150. doi: 10.1242/dev.121.10.3141. [DOI] [PubMed] [Google Scholar]
Associated Data
This section collects any data citations, data availability statements, or supplementary materials included in this article.


