Abstract
Background
Thrombin, the final enzyme of blood coagulation, is a multifunctional serine protease also involved in the progression of cancer. Tumor cells may activate blood coagulation proteases through the expression of procoagulant activities. However, specific information about the thrombin generation potential of malignant tissues is lacking. In this study we applied a single global coagulation test, the calibrated automated thrombogram assay, to characterize the specific procoagulant phenotypes of different tumor cells.
Design and Methods
Malignant hematologic cells (i.e. NB4, HEL, and K562) or solid tumor cells (i.e. MCF-7 breast cancer and H69 small cell lung cells) were selected for the study. The calibrated automated thrombo-gram assay was performed in normal plasma and in plasma samples selectively deficient in factor VII, XII, IX or X, in the absence or presence of a specific anti-tissue factor antibody. Furthermore, cell tissue factor levels were characterized by measuring antigen, activity and mRNA expression.
Results
In normal plasma, NB4 induced the highest thrombin generation, followed by MCF-7, H69, HEL, and K562 cells. The anti-tissue factor antibody, as well as deficiencies of factors VII, IX and XII affected the thrombin generation potential of malignant cells to different degrees, allowing differentiation of the two different pathways of blood clotting activation – by tissue factor or contact activation. The thrombin generation capacity of NB4 and MCF-7 cells was tissue factor-dependent, as it was highly sensitive to inhibition by anti-tissue factor antibody and factor VII deficiency, while the thrombin generation capacity of H69, HEL and K562 was contact activation-dependent, as no thrombin was generated by these cells in factor XII-deficient plasma.
Conclusions
This study demonstrates that the calibrated automated thrombogram assay is capable of quantifying, characterizing, and comparing the thrombin generation capacity of different tumor cells. This provides a useful tool for understanding the key factors determining the global pro-coagulant profile of tumors, which is important for addressing specific targeted therapy for the prevention of thrombosis and for cancer.
Keywords: leukemic cells, thrombin generation, tissue factor, tumor, thrombosis
Introduction
Venous thromboembolism is one of the most frequent complications in cancer patients and significantly contributes to morbidity and mortality.1 Even without clinical manifestations, cancer patients commonly have hemostatic abnormalities, which worsen as the cancer progresses.2 In acute leukemia, the systemic activation of blood coagulation results in life-threatening consumption coagulopathy and a thrombo-hemorrhagic syndrome.3
The acquisition of a prothrombotic phenotype by tumor cells is an oncogenic-driven event, and is one of the main mechanisms responsible for blood clotting activation in cancer.4–6 The expression of procoagulant proteins, including tissue factor (TF) and cancer procoagulant, as well as the exposure of anionic phospholipids, contribute to different extents to the prothrombotic phenotype of tumor cells.7,8
Activation of blood coagulation leads to the generation of thrombin, the final effector enzyme of blood coagulation, and to fibrin formation. Thrombin is a multifunctional serine protease and, as well as its role in coagulation, is able to stimulate tumor cell proliferation and the pro-angiogenic cytokine release8,9 involved in cancer progression. Understanding how tumor cells can induce the generation of thrombin is, therefore, of pivotal importance and may provide potential targets for the prevention of thrombosis and for cancer therapy.
Several assays to measure the procoagulant capacity of tumor cells are available. Some, such as the quantitative measurement of cell-associated TF, can be very specific; others measure the capacity of cells to induce fibrin formation (clotting-based assays). However, specific information about the thrombin generation potential of malignant tissues is lacking. The calibrated automated thrombogram (CAT) is a standardized, global hemostatic assay used to determine the procoagulant and anticoagulant potentials of a plasma sample.10 This dynamic assay, by monitoring thrombin generation in real time, allows measurement of the total amount of thrombin produced and how it is generated and inhibited in a plasma sample incubated with standard preparations of TF and phospholipids. The result of this assay is the thrombin generation curve, which can be described by four parameters, i.e. lag-time, endogenous thrombin potential, peak height and time to peak (ttPeak). An additional parameter is the speed of thrombin generation (or slope), which can be calculated from some of the above mentioned parameters. The endogenous thrombin potential is the quantity of thrombin produced during a given time, and is reduced in bleeding disorders and increased in thrombophilic conditions.11
The purpose of this in vitro study was to determine the procoagulant profiles of different cultured tumor cells using the CAT assay. To evaluate the sensitivity to cell-associated procoagulants, the assay was performed in different experimental conditions, i.e. in normal pooled plasma, in plasma selectively deficient in factor VII (FVII), factor IX (FIX), factor X (FX) or factor XII (FXII) and in the presence of anti-TF antibody. TF expression was also characterized in each cell sample.
Design and Methods
Cell cultures
All the tumor cell lines, with the exception of NB4 (kindly provided by Dr M. Lanotte), were purchased from the American Type Culture Collection (ATCC) (Manassas, VA, USA). MCF-7 is an estrogen receptor-positive breast cancer cell line (ATCC HTB-22), characterized by a low metastatic potential in vivo.12 NB4 is a promyelocytic leukemia cell line, characterized by a t(15;17) chromosomal translocation, and expresses the PML/RARα fusion protein.13 K562 is a chronic myeloid leukemia cell line, while HEL is a human erythroleukemia cell line (ATCC TIB-180) with erythroblastic characteristics. Finally, H69 is a small cell lung carcinoma cell line (ATCC HTB-119).
All cell lines, except MCF-7, were grown in RPMI 1640 medium (Euroclone, Milan, Italy) supplemented with 10% fetal calf serum (Gibco, Gaithersburg, MD, USA), 100 μg/mL streptomycin, and 2 mM L-glutamine. MCF-7 was cultured in Dulbecco’s modified Eagle’s medium (Gibco, Gaithersburg, MD, USA) supplemented with 10% fetal calf serum, non-essential amino acids, 2 mM L-glutamine, and 20 ng/mL gentamycin.14
Cells were allowed to grow in a cell incubator at 37°C in a humidified atmosphere of 5% CO2 in air. Cell viability was estimated before and after any experiment by the trypan blue exclusion technique. Only samples with greater than 95% viability were used. For the experiments exponentially growing cells were collected, centrifuged at 1,500g for 5 min and diluted in the respective complete culture medium at a concentration of 3×10⁵ cells/mL in T75 culture flasks (Orange Scientific, Belgium). After 24 h of growth, cells were collected, washed three times by centrifugation in phosphate-buffered solution, counted and re-suspended in different buffers according to the assay conditions being used.
Tissue factor activity
Cells were re-suspended and lysed at a concentration of 3×10⁶ cells/mL in an assay buffer (10 mM HEPES, 137 mM NaCl, 4 mM KCl, 5 mg/mL bovine serum albumin, 2.5 mM CaCl2; pH 7.45). The TF activity of the samples was measured in duplicate using a chromogenic assay for FXa.15 Results are expressed as pmol FXa/106 cells.
Tissue factor antigen
TF antigen levels were measured in cell lysates (3×10⁶/mL phosphate-buffered saline, 1% Triton X-100) by an enzyme-linked immunosorbent assay using a commercial kit (Imubind Tissue Factor ELISA Kit; American Diagnostica).15 Results are expressed as pg/mL/106 cells.
Tissue factor mRNA
mRNA was purified using the RNEasy RNA extraction kit (Qiagen, Milan, Italy). The mRNA concentration was measured using a NanoDrop ND-1000 UV-Vis spectrophotometer (NanoDrop Technologies, Wilmington, DE, USA). Single-strand cDNA was prepared using a commercially available kit (Alert PCR RT-kit plus, Nanogen Advanced Diagnostics, Turin, Italy) on the Techne TC-412 thermocycler. Simultaneous amplification of the housekeeping gene glyceraldehyde-3-phosphate dehydrogenase (GAPDH) was performed to normalize the data. Polymerase chain reaction (PCR) amplification was performed in the presence of 2.25 mM MgCl2, 0.08 μM of each primer, 0.2 mM dNTP, 1.25 U of Taq polymerase (Roche Diagnostics, Mannheim, Germany) and 5 μL of each cDNA to a final volume of 50 μL. Thermocycling consisted of 5 min at 94°C, followed by 35 cycles of 1 min at 94°C, 1 min at 56°C and 1 min at 72°C. The following primers were used: TF-forward: AACCCGTCAATCAAGTCTAC; TF-reverse: GAAAGTGTTGTTCCTTCTGA; GAPDH-forward: TCACGC-CACAGTTTCCCGGAGG; GAPDH-reverse: GCTTT-TAACTCTGGTAAAGTGG, (Eurofins, MVG Operon, Ebersberg, Germany). PCR products were run on 1.5% agarose gel and TF mRNA expression evaluated by Image-J software. Results are expressed as a ratio between TF and GAPDH mRNA.
Thrombin generation assay
Tumor cells were lysed in phosphate-buffered saline at a concentration of 3×10⁶ cells/mL by three repeated freezing-thawing cycles. Cell samples were then tested for their capacity to induce thrombin generation using the CAT assay.10 Eighty microliters of platelet-free normal pooled plasma (obtained from 20 different normal control subjects, by double centrifugation), or plasma selectively deficient in FVII, FIX, FX and FXII (Siemens, Eschborn Germany) were incubated for 10 min with 20 μL of a cell sample or standard preparations of 1pM and 5pM TF, both containing 4 μM phospholipids (Thrombinoscope) in round-bottomed 96-well microtiter plates (Immulon 2HB, M-Medical). To highlight cell thrombin generation dependence on TF, the CAT assay was performed after pre-incubation of cell samples with an inhibitory anti-TF antibody (AD #4502, polyclonal rabbit anti-human TF, American Diagnostica Inc., Stamford, CT, USA).16 A non-specific antibody (Rabbit IgG fraction, Dako, Denmark) was used as the control in this assay. Thrombin generation was started by the addition of 20 μL of a CaCl2/fluorogenic substrate (Z-Gly-Gly-Arg-AMC; Bachem, Bubendorf, Switzerland) mixture; fluorescence was read using a Fluoroskan Ascent® reader (Thermo Labsystems, Helsinki, Finland) and thrombin generation curves were calculated using Thrombinoscope software (Thrombinoscope BV, Maastricht, The Netherlands). The thrombin generation curves generated by cell samples were considered cell lysate-specific when the signal was higher than that obtained with only phosphate-buffered saline (i.e. in the absence of cells).
Statistical analysis
The results are reported as mean ± standard deviation. Student’s paired and unpaired t-tests were used for the determination of levels of statistical significance. Differences were considered statistically significant for P values less than 0.05.
Results
Cell tissue factor expression
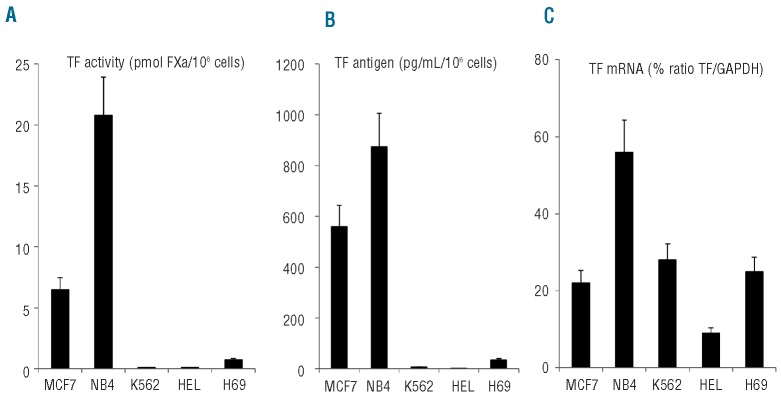
The expression of TF, measured by its activity, antigen or mRNA levels, showed significant variability among the different cell lines (Figure 1). The acute promyelocytic leukemia NB4 cell line was characterized by the highest expression of TF, followed by MCF-7 and H69. We did not detect significant expression of TF by either the K562 myelogenous leukemia or the HEL erythroblastic cell line.
Figure 1.
Expression of TF by the different tumor cell lines. Cells were collected after 24 h of seeding, washed and lysed in the appropriate buffer for the different TF assays, as described in the Design and Methods section. (A) TF activity measured by a chromogenic assay. (B) TF antigen measured by an ELISA, (C) TF mRNA levels expressed as a percentage of the ratio between GAPDH and TF cDNA measured in PCR experiments.
Cell-induced thrombin generation in platelet-free plasma
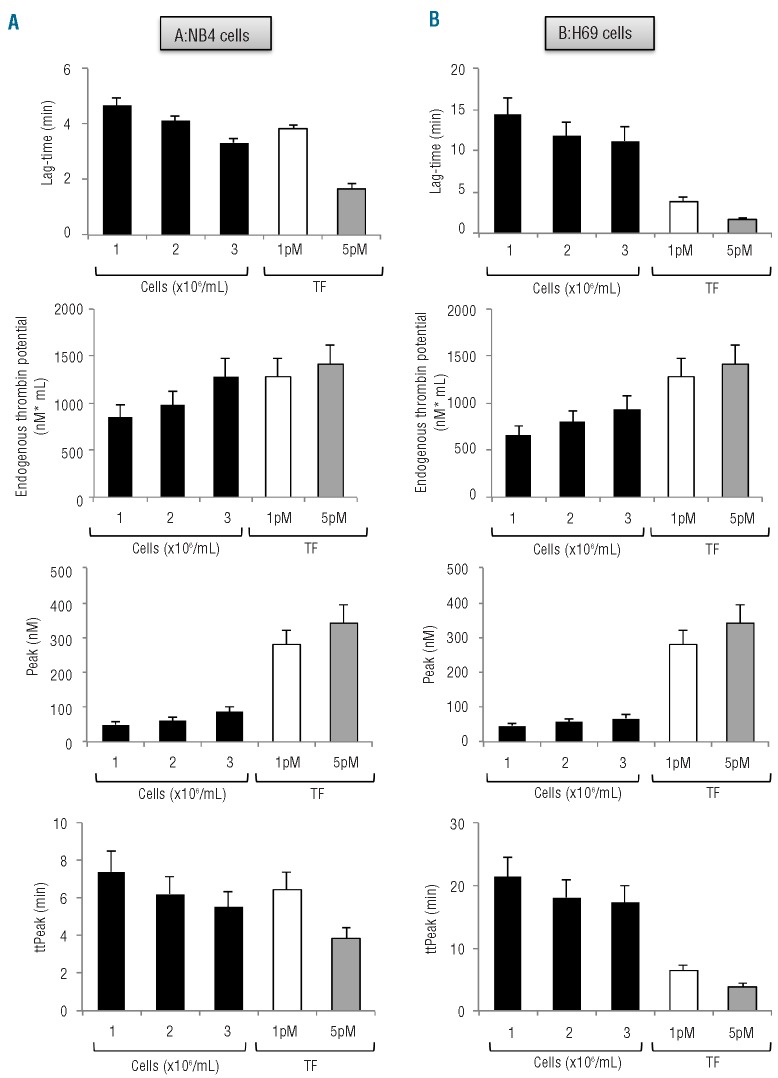
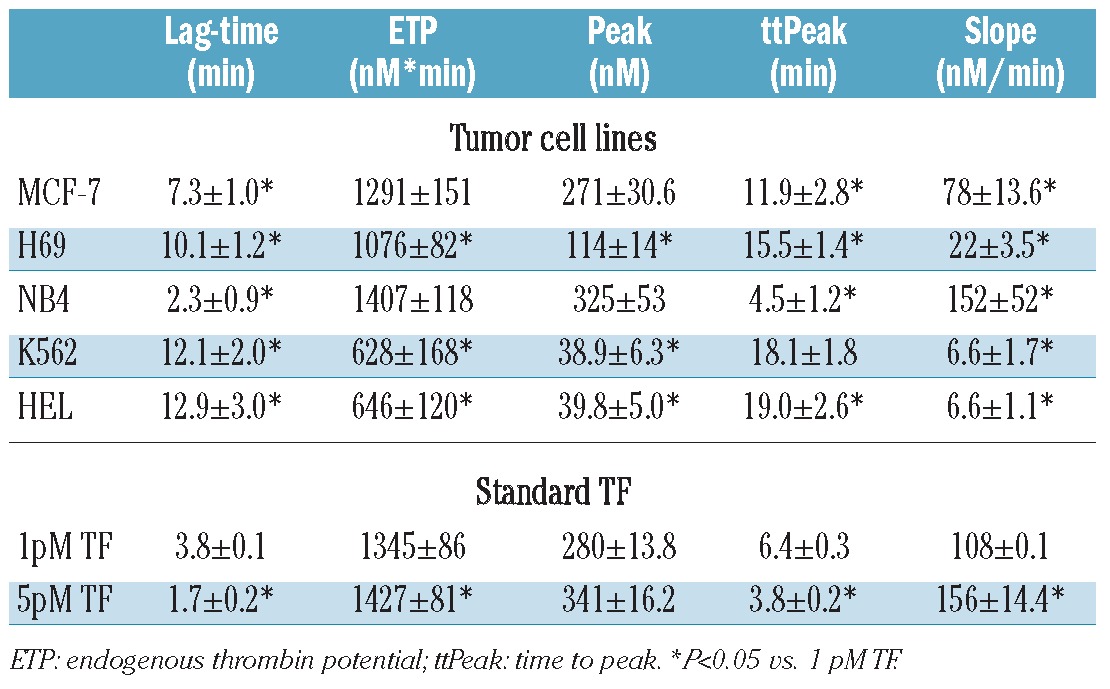
In the first series of experiments, the sensitivity of the CAT assay was tested at three different cell concentrations (1, 2, 3×10⁶ cells/mL) of the NB4 and H69 cell lines. As shown in Figure 2, thrombin generation was induced in a cell concentration-dependent manner. A linear decrease in lag-time and ttPeak, with a parallel increase in thrombin peak, occurred with increasing cell concentration. Compared to NB4, H69 cells were characterized, at each cell concentration tested, by a lower thrombin generation potential, i.e. longer lag-time and ttPeak and lower peak height and endogenous thrombin potential. To avoid the risk of missing the thrombin signal from cells with a low thrombin generation potential, like the H69, we chose the highest cell concentration (i.e. 3×10⁶ cells/mL) for testing for all the other cell lines. Figure 3 shows the comparison of the thrombin generation curves of all the different cell lines included in study, and Table 1 reports the values of each parameter. NB4 cells induced thrombin generation very quickly and produced the highest amount of thrombin, as demonstrated by the values of the endogenous thrombin potential, followed by the breast cancer MCF-7 and small cell lung cancer H69 cell lines. The leukemic HEL and K562 cell lines required about 13 min to start the generation of a significant amount of thrombin, and produced the lowest endogenous thrombin potential and peak height values. The slope (i.e. the speed of thrombin generation) with the highest value was that associated with the NB4 cell line, followed by the MCF-7 and H69 cell lines. The lowest slope values were obtained from the K562 and HEL cell lines.
Figure 2.
Influence of increasing cell numbers on thrombin generation parameters. Thrombin generation in platelet-free plasma was induced by lysates from NB4 (panel A) and H69 (panel B) cell lines. Three different concentrations (i.e. 1, 2, 3 ×10⁶ cells/mL) of cells were tested and compared to 1 and 5 pM TF standard preparations. Results are the mean±SD of three experiments performed in triplicate.
Figure 3.
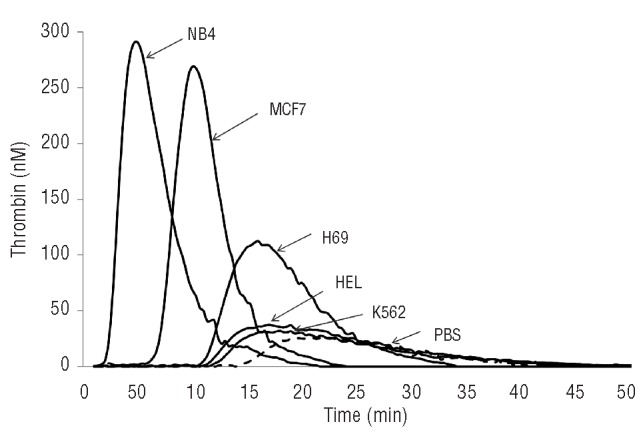
Thrombin generation curves. The graph shows the thrombin generation curves in platelet-free plasma induced by the different tumor cell lines or buffer (phosphate-buffered saline, dashed line).
Table 1.
Thrombin generation parameters of the different cell lines and of standard TF in platelet-free plasma (PFP). Cells were collected, washed and lysed in PBS at 3×10⁶ cells/mL. Standard preparations of lipidated TF at 1 and 5 pM (Thrombinoscope) were used in the same experiments. Results are the mean ± SD of at least three different experiments.
Cell tissue factor contribution to thrombin generation in platelet-free plasma
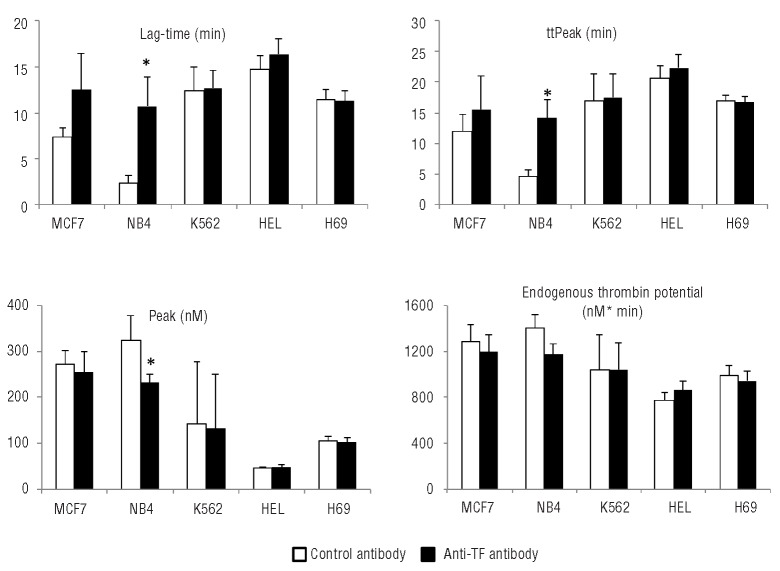
To understand the role of cell associated-TF in determining thrombin generation in platelet-free plasma, a CAT assay was performed after pre-incubation of cell lysates with anti-TF antibody for 1 h at 37°C (0.09 mg/mL, f.c.). The anti-TF antibody concentration was selected on the basis of dose-finding experiments performed in NB4 cells (data not shown). Figure 4 shows the effect of cell TF inhibition on the thrombin generation assay performed in platelet-free plasma. In the majority of cell types, anti-TF antibody significantly affected all the thrombin generation parameters, especially the kinetic ones. Anti-TF antibody significantly (P<0.05) prolonged the lag-time of thrombin generation by NB4 (2.29±0.92 versus 10.7±3.11 min), and, to a lesser extent, MCF-7 cells (7.27±1.01 versus 12.0±5.32 min). On the other hand, cellular TF inhibition did not significantly affect the lag-time of thrombin generation by K562 (12.4±2.68 versus 12.7±1.97 min), HEL (14.6±1.50 versus 16.4±1.65 min) or H69 (11.5±1.10 versus 11.3±1.11 min) cells.
Figure 4.
Effect of anti-TF antibody on thrombin generation in platelet-free plasma (PFP). Cell lysates were preincubated with 0.09 mg/mL anti-TF antibody or negative antibody and then tested for thrombin generation in PFP. Inhibition of TF determined a more pronounced reduction of thrombin generation in NB4 and MCF-7 cells than in HEL, K562 and H69 cells. Results represent the mean ± SD of three experiments performed in triplicate. *P<0.05 vs. cotrol antibody.
Cell-induced thrombin generation in factor VII-deficient plasma
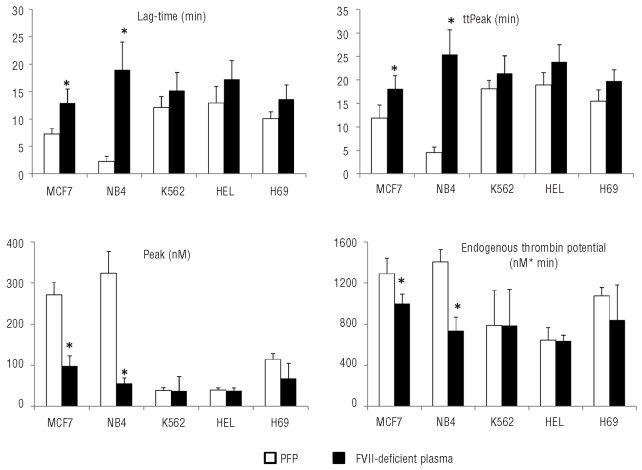
To further explore the contribution of TF to thrombin generation, the CAT assay was performed in FVII-deficient plasma. The results (Figure 5) showed that FVII depletion caused an increase in the thrombin generation kinetic parameters (i.e. lag-time and ttPeak) compared to platelet-free plasma. This effect was more evident for NB4 (lag-time: 727% increase; ttPeak: 460%) and MCF-7 (lag-time: 77%; ttPeak: 52%) cells than for K562 (lag-time: 25%; ttPeak: 18%), HEL (lag-time: 33%; ttPeak: 26%) and H69 (lag-time: 36%; ttPeak: 29%) cells. In NB4 and MCF-7 cells a significant decrease in both peak height and endogenous thrombin potential was also seen.
Figure 5.
Thrombin generation in platelet-free plasma and in FVII-deficient plasma. FVII depletion significantly reduced the thrombin generation capacity of MCF-7 and NB4 cell lines. H69, HEL and K562 cell lines were poorly affected by FVII depletion. Results represent the mean±SD of three experiments performed in triplicate. *P<0.05 vs. PFP.
Cell-induced thrombin generation in factor XII- and factor IX-deficient plasmas
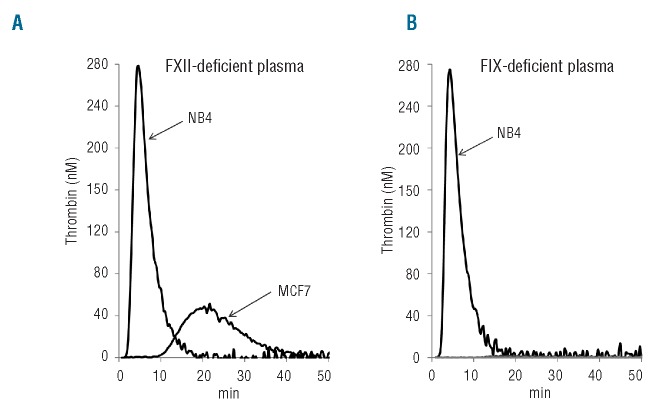
In FXII- and FIX-deficient plasmas, only NB4 and MCF-7 cells retained the capacity to induce thrombin generation (Figure 6A). While for NB4 cells, no significant differences were observed between the thrombin generation curves produced in FXII-deficient plasma compared to platelet-free plasma (i.e. lag-time: 2.29±0.92 versus 2.23±0.31 min), for MCF-7 cells the lag-time (7.30±1.0 versus 11±0.9 min) and ttPeak (11.9±2.8 versus 21±1.9 min) were significantly prolonged. Pre-incubation of cell samples with anti-TF antibody significantly reduced thrombin formation induced by NB4 (lag-time: 2.29±0.92 versus 24±8 min) and MCF-7 cell lines (lag-time 11.0±0.49 versus 22.3±2.32 min) in FXII-deficient plasma. Finally, in FIX-deficient plasma, thrombin generation could be induced by NB4 cell lysates only (Figure 6B).
Figure 6.
Thrombin generation in FXII- and FIX-deficient plasma. All the cell lines were tested in both FXII- and FIX-deficient plasma. Only MCF-7 and NB4 cells retained the capacity to induce thrombin generation in FXII-deficient plasma (A). In FIX-deficient plasma only the NB4 cell line could generate thrombin (B).
Thrombin generation in factor X-deficient plasma
None of the cell lines studied was capable of generating thrombin in FX-deficient plasma (data not shown).
Discussion
In this study we used the CAT assay, a global hemostatic test, to characterize the procoagulant profiles of different human tumor cell lines of breast cancer (MCF-7), leukemia (NB4, HEL, K562), and lung cancer (H69) origin. The CAT assay is typically utilized to evaluate the thrombin generation potential of different plasma samples triggered by standard concentrations of TF and phospholipids. In plasma studies, endogenous thrombin potential is considered one of the most important parameters of the thrombin generation curve,17 although some studies have also highlighted the importance of peak height.18 In cell studies, however, it has not been established which is the more important parameter and, therefore, the entire thrombin generation curve profile should be taken into consideration. For example, despite the fact that H69 and MCF-7 cells produce similar amounts of thrombin (endogenous thrombin potential), the kinetic profiles of the two curves are different. Indeed, compared to MCF-7, thrombin generation by the small cell lung cancer cell line H69 is characterized by a longer lag-time, time-to peak, and lower peak height, suggesting slower production of thrombin associated with a lower inhibition. In vivo this type of tumor might be responsible for a continuous generation and/or weaker inhibition of thrombin, thus giving a microenvironment favorable to tumor growth and progression.19 These differences are not detected by global assays based on a single end-point measurement, supporting the evidence that the CAT assay has an analytical advantage.
Analysis of cell-induced thrombin generation showed that NB4 cells rapidly generate large amounts of thrombin. Among the leukemic cell lines included in this study, the promyelocytic leukemia NB4 cells expressed the highest levels of TF mRNA, antigen, and activity. Increased expression of TF by tumor cells has been ascribed to oncogenic events,6 which directly link the hemostatic system activation, typical of cancer, to tumor transformation. In this subtype of leukemia, the fusion product of the t(15–17) translocation PML/RARα, can transactivate the TF promoter.20 Our finding of elevated thrombin generation capacity and TF expression in NB4 cells is in agreement with results of a previous study, showing that blast cells isolated from patients with acute promyelocytic leukemia express the highest amount of procoagulant activity compared to blasts from other types of myeloid leukemia.21 In addition, acute promyelocytic cell-associated procoagulants have been involved in the pathogenesis of life-threatening coagulopathy associated with this disease.22 The use of the CAT assay may have a significant impact on prophylactic approaches and early intervention in controlling this fatal complication. HEL and K562 cell lines are derived from myeloid leukemia subtypes characterized by a low thrombotic risk (i.e. erythroid leukemia and chronic myeloid leukemia, respectively).23 Accordingly, in our assay, these cells slowly generated small amounts of thrombin. It is known that the lag-time of the thrombin generation curve describes the initiation phase of coagulation, which is particularly dependent on TF. Indeed, in this phase cell-membrane TF binds to FVIIa to activate both FX and FIX; then FXa converts small amounts of prothrombin (FII) to thrombin, which activates FV, FVIII, FIX, and FXI in a positive feedback manner. At the end of the lag-phase, the burst of thrombin starts, with the maximum value represented by the peak height. During this step, known as the propagation phase,10 TF becomes less important, because the reaction is mainly driven by the FVIIa/FXa and FVa/FXa complexes.18,24
To further understand to what extent tumor cell TF contributes to thrombin generation, two different strategies were used: (i) inhibiting cell-associated TF with a specific anti-TF antibody, and (ii) performing the assay in FVII-deficient plasma. In both cases, the thrombin generation capacity of all cell lines was significantly reduced, and the decrease was proportional to cell TF content. This decrease was significant for the NB4 and MCF-7 cells lines, and negligible for the K562, HEL and H69 cell lines. The kinetic parameters were most sensitive to cell-TF inhibition, confirming the role of this procoagulant in the initiation phase of coagulation. The endogenous thrombin potential and the peak height were partially affected by anti-TF antibody, confirming that the propagation phase of thrombin generation is not totally dependent on TF activity, but also requires the presence of FVIIa.
The residual capacity of the cells to induce thrombin generation after TF inhibition or in FVII-deficient plasma suggests that a TF-FVII independent pathway of thrombin generation occurs with cancer cells. This may be via cancer procoagulant, a protease that can directly activate FX25 or by contact activation of coagulation via procoagulant phospholipids (such as phosphatidylserine) exposed on the cell surface of active cells or microparticles. Initiation of coagulation via charged surfaces (the intrinsic coagulation pathway) is widely thought to be surface activation of the blood zymogen FXII (Hageman factor) into an active-enzyme form, FXIIa.26,27
To investigate the role of cell-dependent contact activation, experiments were performed in FXII-deficient plasma. The absence of FXII specifically abolished the thrombin generation capacity of H69, HEL, and K562 cells, suggesting an important role for FXII in blood-clotting activation by these cells. This finding confirms the observations of Kunzelmann et al.,28 who demonstrated that HEL cells can trigger blood coagulation through phosphatidylserine exposure. This mechanism might also explain the occurrence of blood clotting activation in some leukemia subtypes, other than acute promyelocytic leukemia, even if they do not express TF.29 The absence of FXII did not significantly impair NB4 cell-induced thrombin generation; the high cell TF content could be responsible for this finding.30 Finally, FXII deficiency caused a significant reduction in MCF-7 cell-induced thrombin generation, indicating a contribution to the contact pathway for these cells, in addition to TF, in blood clotting activation. Accordingly, anti-TF antibody abolished MCF-7-induced thrombin generation in FXII-deficient plasma.
The CAT assay in FIX-deficient plasma was used to investigate the role of tumor cells in the propagation phase. In this system, the major route to generate thrombin is via the direct activation of FX by TF-FVIIa. Only NB4 cells, which express a very high TF content, retained the ability to generate thrombin in the absence of FIX. This extreme experimental condition is, therefore, suitable only for comparing thrombin generation profiles of cells with a high procoagulant phenotype.
We can exclude the possibility that tumor cells can directly convert prothrombin to thrombin as the depletion of FX completely abolished the thrombin generation capacity of all cell lines.
In conclusion, the CAT assay allows the identification of procoagulant phenotypes of different tumor cell lines, which can only be partially done with other assays. The overall analysis of all the thrombin generation parameters is important in defining the phenotype of tumor cell procoagulant potential. The assay seems to be very sensitive to cell-associated TF, but can also detect other cell-associated procoagulant mechanisms (i.e. contact activation), when performed in the appropriate experimental conditions. Furthermore, the CAT assay is a simple and standardized method that can be used as a new tool to investigate the in vivo role of tumor cells in triggering thrombin generation. This may provide the basis for evaluating new specifically targeted therapies for cancer and the prevention of thrombosis.31 Randomized clinical trials have suggested a beneficial effect of heparins on cancer survival. However, for cancers expressing high levels of TF, the inhibition of FXa or FIIa alone might be not enough to control the procoagulant phenotype of tumor cells. In these cases, TF silencing could represent an important goal for preventing thrombotic complications and decreasing tumor progression. For other tumor cells for which blood-clotting activation is not TF-driven, a possible anticoagulant strategy might be the inhibition of FXI with antisense technology.32,33
Footnotes
Funding: this work was in part supported by a grant from the ‘Associazione Italiana per la Ricerca sul Cancro, (AIRC) Milan, Italy’ to AF.
Authorship and Disclosures
The information provided by the authors about contributions from persons listed as authors and in acknowledgments is available with the full text of this paper at www.haematologica.org.
Financial and other disclosures provided by the authors using the ICMJE (www.icmje.org) Uniform Format for Disclosure of Competing Interests are also available at www.haematologica.org.
References
- 1.Wun T, White RH. Venous thromboembolism (VTE) in patients with cancer: epidemiology and risk factors. Cancer Invest. 2009;27(Suppl 1):63–74. doi: 10.1080/07357900802656681. [DOI] [PubMed] [Google Scholar]
- 2.Rickles FR, Falanga A. Activation of clotting factors in cancer. Cancer Treat Res. 2009;148:31–41. doi: 10.1007/978-0-387-79962-9_3. [DOI] [PubMed] [Google Scholar]
- 3.Falanga A, Rickles FR. Management of thrombohemorrhagic syndromes (THS) in hematologic malignancies. Hematology Am Soc Hematol Educ Program. 2007:165–71. doi: 10.1182/asheducation-2007.1.165. [DOI] [PubMed] [Google Scholar]
- 4.Falanga A, Panova-Noeva M, Russo L. Procoagulant mechanisms in tumour cells. Best Pract Res Clin Haematol. 2009;22(1):49–60. doi: 10.1016/j.beha.2008.12.009. [DOI] [PubMed] [Google Scholar]
- 5.Falanga A, Marchetti M, Vignoli A, Balducci D. Clotting mechanisms and cancer: implications in thrombus formation and tumor progression. Clin Adv Hematol Oncol. 2003;1(11):673–8. [PubMed] [Google Scholar]
- 6.Yu JL, Xing R, Milsom C, Rak J. Modulation of the oncogene-dependent tissue factor expression by kinase suppressor of ras 1. Thromb Res. 2010;126(1):e6–10. doi: 10.1016/j.thromres.2010.04.014. [DOI] [PubMed] [Google Scholar]
- 7.Castellana D, Toti F, Freyssinet JM. Membrane microvesicles: macromessengers in cancer disease and progression. Thromb Res. 2010;125(Suppl 2):S84–8. doi: 10.1016/S0049-3848(10)70021-9. [DOI] [PubMed] [Google Scholar]
- 8.Tsopanoglou NE, Maragoudakis ME. Thrombin’s central role in angiogenesis and pathophysiological processes. Eur Cytokine Netw. 2009;20(4):171–9. doi: 10.1684/ecn.2009.0166. [DOI] [PubMed] [Google Scholar]
- 9.Martorell L, Martinez-Gonzalez J, Rodriguez C, Gentile M, Calvayrac O, Badimon L. Thrombin and protease-activated receptors (PARs) in atherothrombosis. Thromb Haemost. 2008;99(2):305–15. doi: 10.1160/TH07-08-0481. [DOI] [PubMed] [Google Scholar]
- 10.Hemker HC, Al Dieri R, De Smedt E, Beguin S. Thrombin generation, a function test of the haemostatic-thrombotic system. Thromb Haemost. 2006;96(5):553–61. [PubMed] [Google Scholar]
- 11.Marchetti M, Castoldi E, Spronk HM, van Oerle R, Balducci D, Barbui T, et al. Thrombin generation and activated protein C resistance in patients with essential thrombocythemia and polycythemia vera. Blood. 2008;112(10):4061–8. doi: 10.1182/blood-2008-06-164087. [DOI] [PubMed] [Google Scholar]
- 12.Marchetti M, Vignoli A, Russo L, Balducci D, Pagnoncelli M, Barbui T, et al. Endothelial capillary tube formation and cell proliferation induced by tumor cells are affected by low molecular weight heparins and unfractionated heparin. Thromb Res. 2008;121(5):637–45. doi: 10.1016/j.thromres.2007.06.015. [DOI] [PubMed] [Google Scholar]
- 13.Lanotte M, Martin-Thouvenin V, Najman S, Balerini P, Valensi F, Berger R. NB4, a maturation inducible cell line with t(15;17) marker isolated from a human acute promyelocytic leukemia (M3) Blood. 1991;77(5):1080–6. [PubMed] [Google Scholar]
- 14.Falanga A, Consonni R, Marchetti M, Mielicki WP, Rambaldi A, Lanotte M, et al. Cancer procoagulant in the human promyelocytic cell line NB4 and its modulation by all-trans-retinoic acid. Leukemia. 1994;8(1):156–9. [PubMed] [Google Scholar]
- 15.Falanga A, Consonni R, Marchetti M, Locatelli G, Garattini E, Passerini CG, et al. Cancer procoagulant and tissue factor are differently modulated by all-trans-retinoic acid in acute promyelocytic leukemia cells. Blood. 1998;92(1):143–51. [PubMed] [Google Scholar]
- 16.Vignoli A, Marchetti M, Balducci D, Barbui T, Falanga A. Differential effect of the low-molecular-weight heparin, dalteparin, and unfractionated heparin on microvascular endothelial cell hemostatic properties. Haematologica. 2006;91(2):207–14. [PubMed] [Google Scholar]
- 17.Besser M, Baglin C, Luddington R, van Hylckama Vlieg A, Baglin T. High rate of unprovoked recurrent venous thrombosis is associated with high thrombin-generating potential in a prospective cohort study. J Thromb Haemost. 2008;6(10):1720–5. doi: 10.1111/j.1538-7836.2008.03117.x. [DOI] [PubMed] [Google Scholar]
- 18.Machlus KR, Colby EA, Wu JR, Koch GG, Key NS, Wolberg AS. Effects of tissue factor, thrombomodulin and elevated clotting factor levels on thrombin generation in the calibrated automated thrombogram. Thromb Haemost. 2009;102(5):936–44. doi: 10.1160/TH09-03-0180. [DOI] [PMC free article] [PubMed] [Google Scholar]
- 19.Chew HK, Davies AM, Wun T, Harvey D, Zhou H, White RH. The incidence of venous thromboembolism among patients with primary lung cancer. J Thromb Haemost. 2008;6(4):601–8. doi: 10.1111/j.1538-7836.2008.02908.x. [DOI] [PubMed] [Google Scholar]
- 20.Yan J, Wang K, Dong L, Liu H, Chen W, Xi W, et al. PML/RARalpha fusion protein transactivates the tissue factor promoter through a GAGC-containing element without direct DNA association. Proc Natl Acad Sci USA. 2010;107(8):3716–21. doi: 10.1073/pnas.0915006107. [DOI] [PMC free article] [PubMed] [Google Scholar]
- 21.Donati MB, Falanga A, Consonni R, Alessio MG, Bassan R, Buelli M, et al. Cancer pro-coagulant in acute non lymphoid leukemia: relationship of enzyme detection to disease activity. Thromb Haemost. 1990;64(1):11–6. [PubMed] [Google Scholar]
- 22.Falanga A, Barbui T, Rickles FR. Hypercoagulability and tissue factor gene upregulation in hematologic malignancies. Semin Thromb Hemost. 2008;34(2):204–10. doi: 10.1055/s-2008-1079262. [DOI] [PubMed] [Google Scholar]
- 23.Savage DG, Szydlo RM, Goldman JM. Clinical features at diagnosis in 430 patients with chronic myeloid leukaemia seen at a referral centre over a 16-year period. Br J Haematol. 1997;96(1):111–6. doi: 10.1046/j.1365-2141.1997.d01-1982.x. [DOI] [PubMed] [Google Scholar]
- 24.Ollivier V, Wang J, Manly D, Machlus KR, Wolberg AS, Jandrot-Perrus M, et al. Detection of endogenous tissue factor levels in plasma using the calibrated automated thrombogram assay. Thromb Res. 2010;125(1):90–6. doi: 10.1016/j.thromres.2009.03.003. [DOI] [PMC free article] [PubMed] [Google Scholar]
- 25.Falanga A, Gordon SG. Isolation and characterization of cancer procoagulant: a cysteine proteinase from malignant tissue. Biochemistry. 1985;24(20):5558–67. doi: 10.1021/bi00341a041. [DOI] [PubMed] [Google Scholar]
- 26.Kirszberg C, Lima LG, Da Silva de Oliveira A, Pickering W, Gray E, Barrowcliffe TW, et al. Simultaneous tissue factor expression and phosphatidylserine exposure account for the highly procoagulant pattern of melanoma cell lines. Melanoma Res. 2009;19(5):301–8. doi: 10.1097/CMR.0b013e32832e40fe. [DOI] [PubMed] [Google Scholar]
- 27.Zhou J, Shi J, Hou J, Cao F, Zhang Y, Rasmussen JT, et al. Phosphatidylserine exposure and procoagulant activity in acute promyelocytic leukemia. J Thromb Haemost. 2010;8(4):773–82. doi: 10.1111/j.1538-7836.2010.03763.x. [DOI] [PubMed] [Google Scholar]
- 28.Kunzelmann C, Freyssinet JM, Martinez MC. Rho A participates in the regulation of phosphatidylserine-dependent procoagulant activity at the surface of megakaryocytic cells. J Thromb Haemost. 2004;2(4):644–50. doi: 10.1111/j.1538-7836.2004.00688.x. [DOI] [PubMed] [Google Scholar]
- 29.Negaard HF, Iversen PO, Ostenstad B, Iversen N, Holme PA, Sandset PM. Hypercoagulability in patients with haematological neoplasia: no apparent initiation by tissue factor. Thromb Haemost. 2008;99(6):1040–8. doi: 10.1160/TH07-09-0541. [DOI] [PubMed] [Google Scholar]
- 30.Spronk HM, Dielis AW, Panova-Noeva M, van Oerle R, Govers-Riemslag JW, Hamulyak K, et al. Monitoring thrombin generation: is addition of corn trypsin inhibitor needed? Thromb Haemost. 2009;101(6):1156–62. [PubMed] [Google Scholar]
- 31.Falanga A, Vignoli A, Diani E, Marchetti M. Comparative assessment of low-molecular-weight heparins in cancer from the perspective of patient outcomes and survival. Patient Related Outcome Measures. 2011;2:175–88. doi: 10.2147/PROM.S10099. [DOI] [PMC free article] [PubMed] [Google Scholar]
- 32.Renne T. Safe(r) anticoagulation. Blood. 2010;116(22):4390–1. doi: 10.1182/blood-2010-09-306423. [DOI] [PubMed] [Google Scholar]
- 33.Revenko AS, Gao D, Crosby JR, Bhattacharjee G, Zhao C, May C, et al. Selective depletion of plasma prekallikrein or coagulation factor XII inhibits thrombosis in mice without increased risk of bleeding. Blood. 2011;118(19):5302–11. doi: 10.1182/blood-2011-05-355248. [DOI] [PMC free article] [PubMed] [Google Scholar]


