Abstract
At sufficiently high mass accuracy, it is possible to distinguish phosphorylated from unmodified peptides by mass measurement alone. We examine the feasibility of that idea, tested against a library of all possible in silico tryptic digest peptides from the human proteome database. The overlaps between in silico tryptic digest phosphopeptides generated from known phosphorylated proteins (1–12 sites) and all possible unmodified human peptides are considered for assumed mass error ranges of ±10, ±50, ±100, ±1,000, and ±10,000 ppb. We find that for mass error ±50 ppb, 95% of all phosphorylated human tryptic peptides can be distinguished from nonmodified peptides by accurate mass alone through the entire nominal mass range. We discuss the prospect of on-line LC MS/MS to identify phosphopeptide precursor ions in MS1 for selected dissociation in MS2 to identify the peptide and site(s) of phosphorylation.
Keywords: mass defect, human proteome, accurate masses, exact mass, mass error, FTMS, Fourier transform mass spectrometry, ion cyclotron resonance, ICR
1. Introduction
Phosphorylation is a reversible modification affecting both the folding and function of proteins and regulation of many cellular processes such as cell cycle, growth, apoptosis, and differentiation [1, 2]. Among the commonly occurring 20 amino acids, serine, threonine, tyrosine, histidine, arginine, lysine, cysteine, glutamic acid, and aspartic acid residues may be phosphorylated. However, phosphorylation of the hydroxyl group of serine, threonine or tyrosine residues by forming a phosphate ester bond is most frequently observed, with relative occurrence of 90% (pS), 10% (pT), and 0.05% (pY) [3]. Identification of the number and site(s) of phosphorylation is thus a major aspect of proteomics [4].
1.1. MS/MS for identifying the presence and sequence location of phosphorylation in peptides
Mass spectrometry is playing an increasingly important role in the characterization of posttranslational modifications, including protein phosphorylation [5, 6]. A simple way to identify the presence of a phosphopeptide by MS is from proteolytic peptide mass spectra before and after phosphatase treatment, revealing an 80 Da mass reduction (HPO3) for each phosphorylation [7, 8], but is limited to analysis of abundant peptides.
Most modern methods for phosphoproteome analysis rely on the use of MS/MS techniques: for example, from precursor ion and neutral loss scans by triple quadrupole mass spectrometry [9–13]. For parent ion scanning, the first quadrupole (Q1) scans through the entire m/z range, precursor ions are subjected to collision-induced dissociation in the second quadrupole (Q2), and the third quadrupole (Q3) monitors the specific fragment ion characteristic of the modification of interest, e.g., the loss of PO3- (79 Da) for a negative phosphopeptide ion. In the neutral loss scan, Q1 and Q3 are scanned simultaneously over two different m/z ranges with the (fixed) difference corresponding to the m/z value of the appropriate neutral (e.g., 98 Da for H3PO4) that is lost in Q2 [1]. These methods can identify the presence (but not the sequence location) of phosphorylation. Moreover, efficiency of the method decreases as sample complexity increases [14].
Electron capture dissociation (ECD) and electron transfer dissociation (ETD) techniques mainly generate c/z• ions by cleavage of the N-C backbone bond and are particularly useful for analysis of large multiply charged peptides and for identification and localization of posttranslational modifications. Both methods typically provide more extensive sequence coverage and retain labile posttranslational modifications relative to slow-heating dissociation methods (e.g., collision-induced dissociation (CID), infrared multiphoton dissociation), thereby enabling more complete sequencing of peptides and more precise assignment of phosphorylation sites simultaneously in a single MS/MS experiment [15–17]. For example, in a global phosphoproteome analysis, ETD identified 60% more phosphopeptides than CID, with an average of 40% more fragment ions to facilitate localization of phosphorylation sites. With combined ETD and CID, more than 80% of the known phosphorylation sites in more than 1,000 phosphorylated peptides were identified [18].
Another problem is that phosphorylation occurs at low stoichiometry and/or for a protein with low expression level versus nonphosphorylated proteins found in vivo. Moreover, for a complex mixture containing many other unmodified peptides, phosphopeptides can exhibit low ionization efficiency due to more efficient ionization of other species. Although that effect is less pronounced for negative ions, their low fragmentation efficiency (e.g., electron detachment dissociation, negative electron capture dissociation) can preclude phosphorylation identification.[1] Therefore, because current MS methods do not distinguish between phosphorylated and non-phosphorylated precursor ions before MS/MS, it is typically necessary to resort to other methods to pre-select phosphorylated peptides: e.g., protease-specific digestion, phospho-enchrichment steps, and/or LC separation.
1.2 Phosphopeptide enrichment strategies
Immobilized metal-ion affinity chromatography (IMAC) is the most frequently used technique for enrichment by electrostatic interaction between a negatively charged phosphate and positively charged metal ion (e.g. Fe3+, Ga3+, or Al3+) bound to the stationary phase via linkers [19], and is compatible with subsequent separation and detection in LC-ESI-MS/MS [20]. However, nonspecific binding of peptides containing acidic amino acids such as Glu and Asp limits selectivity. Moroever, minor alteration of pH, ionic strength, and/or organic solvent composition can significantly affect the selectivity of the IMAC stationary phase [1]. Although esterification of carboxylic acids to methyl esters by use of HCl-saturated, dried methanol can eliminate the nonspecific binding of acidic peptides in subsequent IMAC enrichment, but at the cost of additional analysis time, sample loss, and increased sample complexity due to incomplete esterification and side reactions, etc. [1, 21].
Alternatively, strong cation exchange chromatography can separate singly charged positive tryptic digest phosphopeptides from doubly positively charged nonphosphopeptides at acidic pH (~2.7). However, specificity is low [22]. Other enrichment methods include TiO2 column chromatography, ZrO2 microtips, chemical modification of the phosphate by an affinity tag, calcium phosphate precipitation, etc. [23–26]. In all of the above techniques, interference from abundant, nonspecific peptides complicates MS/MS, especially when coupled with on-line LC separation.
1.3. Phosphate identification based on mass defect
Mass defect is the difference between exact mass and the nearest-integer (nominal) mass. The atomic mass defects for 12C, 1H, 16O, 14N, 31P, and 32S are shown in Table 1. The limited elemental compositions (C, H, O, N and S) of 20 common amino acids localize the possible mass defects for unmodified peptides to only approximately one-third of each 1-Dalton mass range. Moreover, peptide masses are discrete, so that amino acid composition can be uniquely inferred from sufficiently resolved and accurate mass measurement. [27, 28]. The introduction of another element with a large mass defect into the elemental compositions can shift a modified peptide ion into an otherwise empty mass spectral segment, for unique identification by accurate mass measurement. Originally introduced to provide non-overlapping (typically fluorinated) mass calibrants [ref to pfk mixtures], mass defect labeling of peptides has been used to identify protein serine (pS) and tyrosine (pY) phosphorylation. [27, 29–32]. Here, we point out that, by virtue of its large mass defect (-0.0262 Da, see Table 1), the presence of 31P in a peptide ion can in principle be identified by sufficiently accurate mass measurement alone.
Table 1.
The accurate atomic masses and corresponding mass defects for five elements found in amino acids [34]. Note the large negative mass defect for 31P.
| Elements | Accurate Mass (Da) | Mass Defect (Da) |
|---|---|---|
| 1H | 1.007825032 | + 0.007825032 |
| 12C | 12.000000000 | + 0.000000000 |
| 14N | 14.003074005 | + 0.003074005 |
| 16O | 15.994914622 | − 0.005085378 |
| 31P | 30.973761487 | − 0.026238513 |
| 32S | 31.972070690 | − 0.027929310 |
2. Methods
Tryptic peptides were generated in silico from the ProSightPC human protein database [33]. Two types of N-terminal modifications (acetylation and methionine cleavage) were considered, and each digested peptide was allowed one missed tryptic cleavage site. To calculate the overlaps of unmodified and phosphorylated peptides at each nominal mass, a database consisting of the in silico trypsin-digested unmodified human proteome and a database containing in silico tryptic digest phosphopeptides generated from human proteins phosphorylated at known positions. Each database includes unique elemental composition and corresponding accurate monoisotopic neutral mass for each peptide. 1H, 12C, 14N, 16O, 31P, and 32S atomic mass values (see Table 1 [34]) were used to compute the monoisotopic neutral mass for each elemental composition.
3. Results and discussion
3.1. Phosphorylated vs. non-phosphorylated human peptides; elemental composition vs. amino acid composition
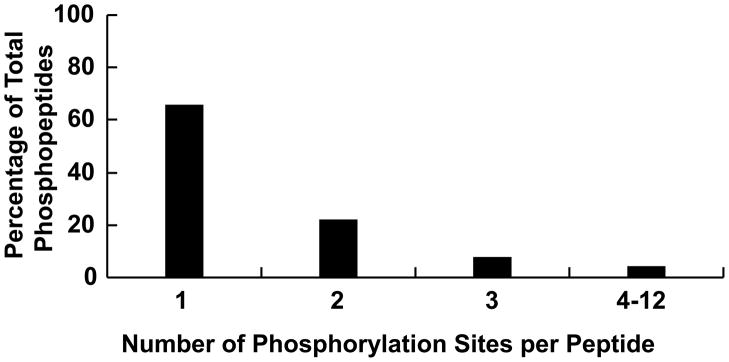
The total entries, non-redundant (i.e., not counting separately isomeric peptides with identical elemental composition but different sequence or amino acid composition—see below) entries, and neutral mass ranges for both phosphorylated and nonphosphorylated human tryptic digest peptide databases are given in Table 2. There are 73,407 phosphorylated and 956,594 nonphosphorylated (non-redundant) peptides with masses ranging from 580–10,088 Da and 500–10,040 Da. As many as 12 phosphorylation sites have been found on a single database peptide, whereas ~34% of observed phophorylated peptides are modified at two or more sites: ~65.7%, 22.0%, 7.8% and 4.5% containing, one, two, three, and greater than three phosphates. (see Figure 1).
Table 2.
Total entries, non-redundant entries, and neutral mass range for phosphorylated and nonphosphorylated human tryptic digest peptides.
| Phosphopeptide Database (N-terminal acetylation and methionine cleavage) | |||
|---|---|---|---|
| No. of phosphorylation modification sites | Total entries | Non-redundant entries | Neutral mass range (Da) |
| 1 | 80357 | 48265 | 580–10088 |
| 2 | 40415 | 16090 | 662–10127 |
| 3 | 23228 | 5709 | 772–10069 |
| 4 | 13712 | 2074 | 1040–10077 |
| 5 | 7873 | 799 | 1225–9742 |
| 6 | 4222 | 290 | 1554–9189 |
| 7 | 2043 | 111 | 2071–9269 |
| 8 | 860 | 46 | 2151–9248 |
| 9 | 299 | 17 | 2231–9328 |
| 10 | 78 | 3 | 3805–5799 |
| 11 | 13 | 2 | 3885–5879 |
| 12 | 1 | 1 | 3965 |
| Total | 173101 | 73407 | |
| Nonphosphopeptide Database (N-terminal acetylation and methionine cleavage) | |||
| Total entries | Non-redundant entries | Neutral mass range (Da) | |
| 2307173 | 956594 | 500–10040 | |
Figure 1.
Distribution of phosphates among all previously identified human phosphopeptides.
Apart from sequence isomers (e.g., AlaGlyHis vs. GlyHisAla), peptides of a given elemental composition may arise from multiple isomeric amino acid compositions (e.g., Met & Ala vs. Val & Cys) [35]. Although positional isomers have different heat of formation, an energy difference of (E2 − E1) = 1 eV corresponds to a mass difference of ~10−9 Da according to Einstein’s mass-energy relation, (E2 − E1) = (m2 − m1)c2, a mass difference not accessible by any existing mass analyzer [35, 36]. Both the number of amino acid compositions and unique elemental compositions at different nominal masses are shown in Figure 2 (human non-phosphopeptides) and Figure 3 (human phosphopeptides). The number of isomers at each nominal mass is readily obtained from difference between amino acid compositions and unique elemental compositions. Note that 2038 of the 2109 amino acid compositions of unmodified peptides of nominal mass 730 Da (i.e., 97%!) are isomers, requiring MS/MS for identification.
Figure 2.
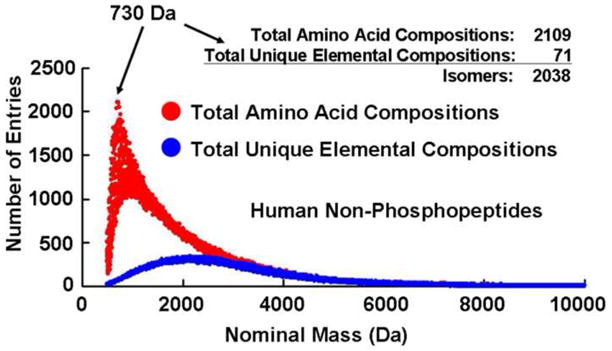
Amino acid compositions and unique elemental compositions at each nominal mass for the human non-phosphopeptide database.
Figure 3.
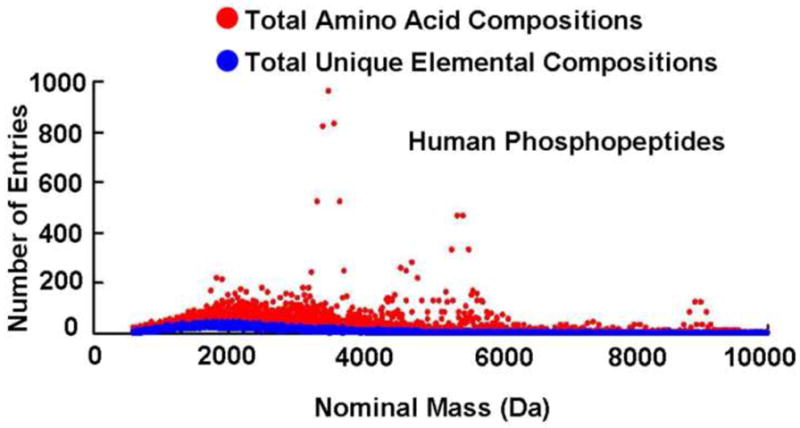
Amino acid compositions and unique elemental compositions at each nominal mass for the human phosphopeptide database (1–12 phosphorylations per peptide).
3.2. Mass accuracy required to identify phosphopeptides by mass alone
Figure 4 shows the possible mass distributions of phosphorylated and nonphosphorylated human (neutral) peptides across a 0.05 Da segment of the mass range at a mass accuracy (i.e., mass bin width) to within ±0.1 ppm. For that small mass segment, at that mass accuracy, it is clear that every phosphopeptide can be distinguished from every nonphosphopeptide. By comparison, Conrads et al. previously showed that at 0.1 ppm mass measurement accuracy, more than 80 % of yeast phosphopeptides of 2,000 Da nominal mass can be identified directly from their masses.[37] To establish the mass measurement accuracy required to distinguish phosphopeptides from nonphosphopeptides at various nominal masses, Spengler et al. recently assembled a database of theoretically possible peptides up to 2000 Da and calculated the fraction of mass-distinguishable mono- and di-phosphorylated peptides from unmodified peptides, for assumed mass error of 100 and 1000 ppb [38]. Here, we restrict our database to the human proteome (but do not limit the mass range), and then consider the overlap between experimentally confirmed peptides phosphorylated at 1–12 sites and all possible unmodified human peptides for assumed mass error values ranging from 1–10,000 ppb.
Figure 4.
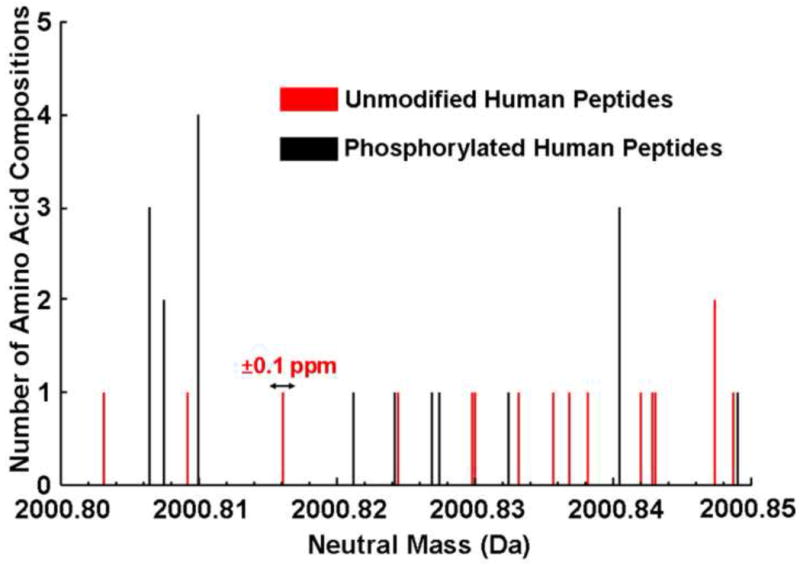
Histogram of phosphorylated and nonphosphorylated neutral human peptides (counting sequence isomers) across a 0.05 Da mass segment at nominal mass 2000 Da, at a mass resolution (mass bin width) of ±0.1 ppm.
We now consider the feasibility of distinguishing phosphorylated from unphosphorylated precursor peptide ions in the first stage of an MS/MS experiment, so as to be able to select only phosphopeptides for subsequent fragmentation in the second MS/MS stage. Figure 5 shows the percentage of overlaps between phospho- and non-phosphopeptides at every nominal mass up to 10,000 Da, for each of five mass measurement error ranges. Although the overlap percentage is less than 50% throughout the entire mass range even for a mass measurement error range of ±1,000 ppb, overlap drops to less than 5% of the nominal masses, for a mass measurement error range of ±50 ppb, with no overlaps below 1,148 Da. Stated another way, Figure 6 shows the lowest nominal mass at which overlap first appears, starting at 580 Da for mass error of ±10 ppm and increasing to 1,967 Da for ±0.01 ppm. Note that ~ 83%, 52%, 29%, 6%, and 0.3% of total phosphopeptides (173,101) overlap with at least one nonphosphopeptide at respective mass measurement error of ±10,000, ±1,000, ±100, ±50, and ±10 ppb. Consideration of possible interferants from other modified peptides such as sulfation, nitrosylation, and ubiquitination (each type is from in silico tryptic digest of corresponding known human modified proteins) doesn’t change the overlap results between phosphopeptides and nonphosphopeptides at each mass error, due to the relatively few occurrences for each modified peptide: e.g., 1702 total entries (469 nonredundant) for sulfated peptides at up to 7 sites, 48 total entries (42 nonredundant) for nitrosylated peptides at up to 3 sites, and 606 total entries (577 nonredundant) for ubiquitinated peptides (leaving only a GG tag on each peptide after tryptic digest) at up to 2 sites.
Figure 5.
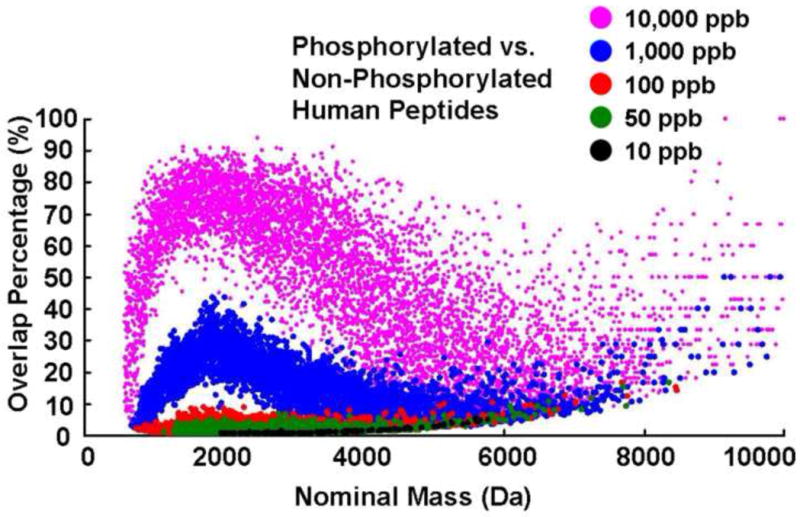
Human phosphopeptide vs. nonphosphopeptide mass overlap likelihood for each of five mass measurement errors (10–10,000 ppb) at nominal masses up to 10,000 Da.
Figure 6.
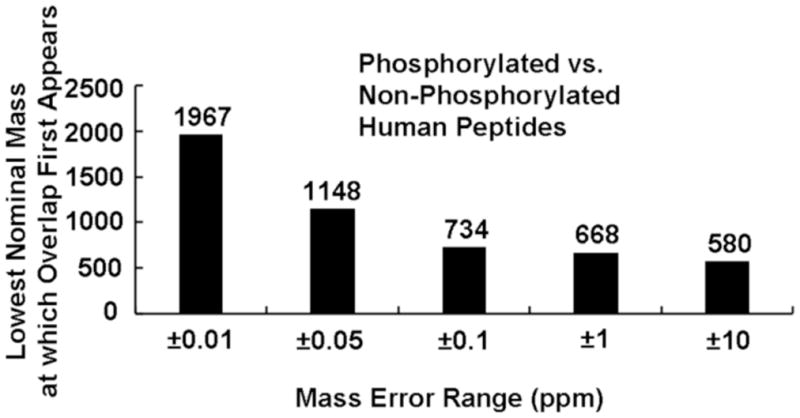
The lowest nominal mass at which overlap between human phospho- and non-phosphopeptides, for each of five mass measurement error ranges.
Finally, Figure 7 shows that even at 1 ppb mass accuracy, there are still two phosphopeptide/non-phosphopeptide pairs of unique elemental compositions at nominal masses 3,885 and 4,443 Da that cannot be distinguished, corresponding to the mass doublets, C45H62N19 vs. O33P11 (~1.3 μDa) and C20H17O1S1P1 vs. N24 (~3.5 μDa). The mass accuracy required to resolve each pair, 0.3 ppb and 0.8 ppb, is not currently attainable.
Figure 7.
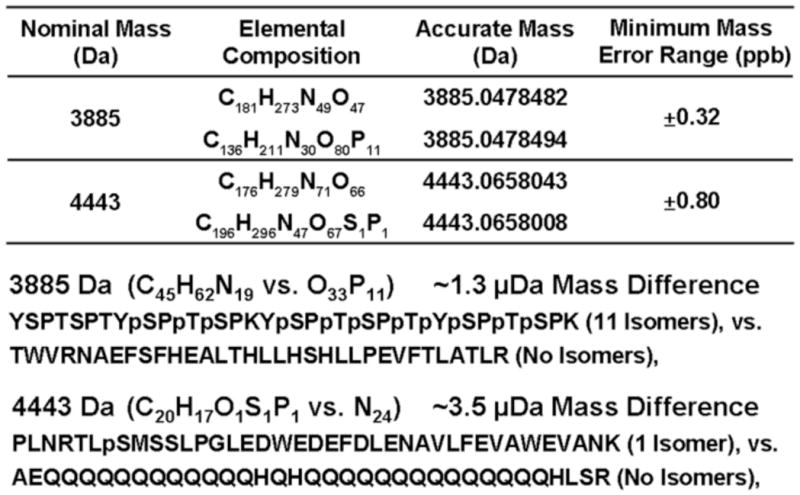
Elemental compositions, accurate masses, and amino acid sequences of the (only) two phosphopeptide/non-phosphopeptide pairs not resolved at ±1 ppb mass measurement error range.
3.3. Feasibility of identifying phosphopeptides by mass measurement alone
The best prospect for realizing the identification of phosphopeptides is with Fourier transform ion cyclotron resonance mass spectrometry, which provides ten-fold higher mass resolution and mass measurement accuracy than other mass analyzers [36]. For example, we have recently achieved mass measurement rms error of <50 ppb for a constantly infused petroleum crude oil sample with thousands of resolved peaks in a single mass spectrum [39]. For peptide mixtures analyzed by LC/MS, mass resolving power and mass accuracy are necessarily lower, due to the need to acquire each precursor mass spectrum in ~1 s. However, with recently introduced phase correction to yield absorption-mode display [40], improved ICR cell designs (Tolmachev, Nikolaev), and high magnetic field [41], it should be possible to achieve mass measurement accuracy to within ~50 ppb up to 1000 Da sufficient to identify phosphopeptides unambiguously up to ~1,200 Da It is worth noting that current instruments typically perform MS/MS only for the (say) five most abundant precursor ions, and therefore fail to access phosphopeptides present at lower abundance. Being able to identify the phosphopeptides before MS/MS should thus significantly improve their detection efficiency (and subsequent sequence location by MS/MS).
Research Highlights.
Peptide phosphorylation can be detected by mass alone
For mass error ±50 ppb, 95% of all phosphorylated human tryptic peptides can be distinguished from nonmodified peptides
Phosphopeptide precursor ions in MS1 can be selected for selected dissociation in MS2
Acknowledgments
We thank Dr. Forest White of the Massachusetts Institute of Technology for helpful discussion. This work was supported by NSF Division of Materials Research through DMR-0654118, the State of Florida, NIH GM 067193-08, NIH DA 026672, and NSF DMS-0800631.
Footnotes
Publisher's Disclaimer: This is a PDF file of an unedited manuscript that has been accepted for publication. As a service to our customers we are providing this early version of the manuscript. The manuscript will undergo copyediting, typesetting, and review of the resulting proof before it is published in its final citable form. Please note that during the production process errors may be discovered which could affect the content, and all legal disclaimers that apply to the journal pertain.
References
- 1.Paradela A, Albar JP. Advances in the analysis of protein phosphorylation. J Proteome Res. 2008;7:1809–1819. doi: 10.1021/pr7006544. [DOI] [PubMed] [Google Scholar]
- 2.Pawson T, Scott JD. Signaling through scaffold, anchoring, and adaptor proteins. Science. 1997;278:2075–2080. doi: 10.1126/science.278.5346.2075. [DOI] [PubMed] [Google Scholar]
- 3.Hunter T. Protein kinase classification. Methods Enzymol. 1991;200:3–37. doi: 10.1016/0076-6879(91)00125-g. [DOI] [PubMed] [Google Scholar]
- 4.Schmelzle K, White FM. Phosphoproteomic approaches to elucidate cellular signaling networks. Curr Opin Chem Biol. 2006;17:406–414. doi: 10.1016/j.copbio.2006.06.004. [DOI] [PubMed] [Google Scholar]
- 5.Aebersold R, Goodlett DR. Mass spectrometry in proteomics. Chem Rev. 2001;101:269–295. doi: 10.1021/cr990076h. [DOI] [PubMed] [Google Scholar]
- 6.Mann M, Jensen ON. Proteomic analysis of post-translational modifications. Nat Biotechnol. 2003;21:255–261. doi: 10.1038/nbt0303-255. [DOI] [PubMed] [Google Scholar]
- 7.Zhang WZ, Czernik AJ, Yungwirth T, Aebersold R, Chait BT. Matrix-assisted laser-desorption mass-spectrometric peptide-mapping of proteins separated by 2-dimensional gel-electrophoresis-determination of phosphorylation in synapsin. Protein Sci. 1994;3:677–686. doi: 10.1002/pro.5560030415. [DOI] [PMC free article] [PubMed] [Google Scholar]
- 8.Zhang XL, Herring CJ, Romano PR, Szczepanowska J, Brzeska H, Hinnebusch AG, Qin J. Identification of phosphorylation sites in proteins separated by polyacrylamide gel electrophoresis. Anal Chem. 1998;70:2050–2059. doi: 10.1021/ac971207m. [DOI] [PubMed] [Google Scholar]
- 9.Carr SA, Huddleston MJ, Annan RS. Selective detection and sequencing of phosphopeptides at the femtomole level by mass spectrometry. Anal Biochem. 1996;239:180–192. doi: 10.1006/abio.1996.0313. [DOI] [PubMed] [Google Scholar]
- 10.Covey TR, Huang EC, Henion JD. Structure characterization of protein tryptic peptides via liquid chromatography/mass spectrometry and collision-induced dissociation of their doubly charged molecular ions. Anal Chem. 1991;63:1193–1200. doi: 10.1021/ac00013a003. [DOI] [PubMed] [Google Scholar]
- 11.Huddleston MJ, Annan RS, Bean MF, Carr SA. Selective detection of phosphopeptides in complex mixtures by electrospray liquid chromatography/mass spectrometry. J AmSoc Mass Spectrom. 1993;4:710–717. doi: 10.1016/1044-0305(93)80049-5. [DOI] [PubMed] [Google Scholar]
- 12.Neubauer G, Mann M. Mapping of phosphorylation sites of gel-isolated proteins by nanoelectrospray tandem mass spectrometry: potentials and limitations. Anal Chem. 1999;71:235–242. doi: 10.1021/ac9804902. [DOI] [PubMed] [Google Scholar]
- 13.Wilm M, Neubauer G, Mann M. Parent ion scans of unseparated peptide mixtures. Anal Chem. 1996;68:527–533. doi: 10.1021/ac950875+. [DOI] [PubMed] [Google Scholar]
- 14.Liu T, Belov ME, Jaitly N, Qian WJ, Smith RD. Accurate mass measurements in proteomics. Chem Rev. 2007;107:3621–3653. doi: 10.1021/cr068288j. [DOI] [PMC free article] [PubMed] [Google Scholar]
- 15.Syka JE, Coon JJ, Schroeder MJ, Shabanowitz J, Hunt DF. Peptide and protein sequence analysis by electron transfer dissociation mass spectrometry. Proc Natl Acad Sci USA. 2004;101:9528–9533. doi: 10.1073/pnas.0402700101. [DOI] [PMC free article] [PubMed] [Google Scholar]
- 16.Woodling KA, Eyler JR, Tsybin YO, Nilsson CL, Marshall AG, Edison AS, Al-Naggar IM, Bubb MR. Identification of single and double sites of phosphorylation by ECD FT-ICR/MS in peptides related to the phosphorylation site domain of the myristoylated alanine-rich C kinase protein. J Am Soc Mass Spectrom. 2007;18:2137–2145. doi: 10.1016/j.jasms.2007.09.010. [DOI] [PubMed] [Google Scholar]
- 17.Zubarev RA, Horn DM, Fridriksson EK, Kelleher NL, Kruger NA, Lewis MA, Carpenter BK, McLafferty FW. Electron capture dissociation for structural characterization of multiply charged protein cations. Anal Chem. 2000;72:563–573. doi: 10.1021/ac990811p. [DOI] [PubMed] [Google Scholar]
- 18.Molina H, Horn DM, Tang N, Mathivanan S, Pandey A. Global proteomic profiling of phosphopeptides using electron transfer dissociation tandem mass spectrometry. Proc Natl Acad Sci USA. 2007;104:2199–2204. doi: 10.1073/pnas.0611217104. [DOI] [PMC free article] [PubMed] [Google Scholar]
- 19.Porath J, Carlsson J, Olsson I, Belfrage G. Metal chelate affinity chromatography, a new approach to protein fractionation. Nature. 1975;258:598–599. doi: 10.1038/258598a0. [DOI] [PubMed] [Google Scholar]
- 20.Moser K, White FM. Phosphoproteomic analysis of rat liver by high capacity IMAC and LC-MS/MS. J Proteome Res. 2006;5:98–104. doi: 10.1021/pr0503073. [DOI] [PubMed] [Google Scholar]
- 21.Ficarro SB, McCleland ML, Stukenberg PT, Burke DJ, Ross MM, Shabanowitz J, Hunt DF, White FM. Phosphoproteome analysis by mass spectrometry and its application to Saccharomyces cerevisiae. Nat Biotechnol. 2002;20:301–305. doi: 10.1038/nbt0302-301. [DOI] [PubMed] [Google Scholar]
- 22.Lim KB, Kassel DB. Phosphopeptides enrichment using on line two-dimensional strong cation exchange followed by reversed phase liquid chromatography/mass spectrometry. Anal Biochem. 2006;354:213–219. doi: 10.1016/j.ab.2006.04.027. [DOI] [PubMed] [Google Scholar]
- 23.Kweon HK, Hakansson K. Selective zirconium dioxide-based enrichment of phosphorylated peptides for mass spectrometric analysis. Anal Chem. 2006;78:1743–1749. doi: 10.1021/ac0522355. [DOI] [PubMed] [Google Scholar]
- 24.Oda Y, Nagasu T, Chait BT. Enrichment analysis of phosphorylated proteins as a tool for probing the phosphoproteome. Nat Biotechnol. 2001;19:379–382. doi: 10.1038/86783. [DOI] [PubMed] [Google Scholar]
- 25.Pinkse MW, Uitto PM, Hilhorst MJ, Ooms B, Heck AJ. Selective isolation at the femtomole level of phosphopeptides from proteolytic digests using 2D-NanoLC-ESI-MS/MS and titanium oxide precolumns. Anal Chem. 2004;76:3935–3943. doi: 10.1021/ac0498617. [DOI] [PubMed] [Google Scholar]
- 26.Zhang XM, Ye JY, Jensen ON, Roepstorff P. Highly efficient phosphopeptide enrichment by calcium phosphate precipitation combined with subsequent IMAC enrichment. Mol Cell Proteomics. 2007;6:2032–2042. doi: 10.1074/mcp.M700278-MCP200. [DOI] [PubMed] [Google Scholar]
- 27.Bajrami B, Shi Y, Lapierre P, Yao XD. Shifting unoccupied spectral space in mass spectrum of peptide fragment ions. J Am Soc Mass Spectrom. 2009;20:2124–2134. doi: 10.1016/j.jasms.2009.07.005. [DOI] [PubMed] [Google Scholar]
- 28.Mann M. Useful tables of possible and probable peptide masses. Proceedings of the 43rd ASMS conference on mass spectrometry and allied topics; Atlanta, GA. 1995. [Google Scholar]
- 29.Harris WA, Janecki DJ, Reilly JP. Use of matrix clusters and trypsin autolysis fragments as mass calibrants in matrix-assisted laser desorption/ionization time-of-flight mass spectrometry. Rapid Commum Mass Spectrom. 2002;16:1714–1722. doi: 10.1002/rcm.775. [DOI] [PubMed] [Google Scholar]
- 30.Hernandez H, Niehauser S, Boltz SA, Gawandi V, Phillips RS, Amster IJ. Mass defect labeling of cysteine for improving peptide assignment in shotgun proteomic analyses. Anal Chem. 2006;78:3417–3423. doi: 10.1021/ac0600407. [DOI] [PMC free article] [PubMed] [Google Scholar]
- 31.Shi Y, Bajrami B, Morton M, Yao XD. Cyclophosphoramidate ion as mass defect marker for efficient detection of protein serine phosphorylation. Anal Chem. 2008;80:7614–7623. doi: 10.1021/ac801355u. [DOI] [PubMed] [Google Scholar]
- 32.Steen H, Kuster B, Mann M. Quadrupole time-of-flight versus triple-quadrupole mass spectrometry for the determination of phosphopeptides by precurson ion scanning. J Mass Spectrom. 2001;36:782–790. doi: 10.1002/jms.174. [DOI] [PubMed] [Google Scholar]
- 33.Zamdborg L, LeDuc RD, Kevin JG, Kim YB, Viswanathan V, Spaulding IT, Early BP, Bluhm EJ, Babai S, Kelleher NL. ProSight PTM 2.0: improved protein identification and characterization for top down mass spectrometry. Nucleic Acids Res. 2007;35:W701–W706. doi: 10.1093/nar/gkm371. [DOI] [PMC free article] [PubMed] [Google Scholar]
- 34.Audi G, Wapstra AH. The 1995 update to the atomic mass evaluation. Nuclear Physics A. 1995;595:409–425. [Google Scholar]
- 35.He F, Emmett MR, Håkansson K, Hendrickson CL, Marshall AG. Theoretical and experimental prospects for protein identification based solely on accurate mass measurement. J Proteome Res. 2004;3:61–67. doi: 10.1021/pr034058z. [DOI] [PubMed] [Google Scholar]
- 36.Marshall AG, Hendrickson CL. High-Resolution Mass Spectrometers. Annu Rev Anal Chem. 2008;1:579–599. doi: 10.1146/annurev.anchem.1.031207.112945. [DOI] [PubMed] [Google Scholar]
- 37.Conrads TP, Anderson GA, Veenstra TD, Pasa-Tolic L, Smith RD. Utility of accurate mass tags for proteome-wide protein identification. Anal Chem. 2000;72:3349–3354. doi: 10.1021/ac0002386. [DOI] [PubMed] [Google Scholar]
- 38.Spengler B, HA Mass-based classification (MBC) of peptides: Highly accurate precursor ion mass values can be used to diretly recognize peptide phosphorylation. J Am Soc Mass Spectrom. 2008;19:1808–1812. doi: 10.1016/j.jasms.2008.08.005. [DOI] [PubMed] [Google Scholar]
- 39.Savory JJ, Kaiser NK, McKenna AM, Xian F, Blakney GT, Hendrickson CL, Rodgers RP, Marshall AG. Parts-per-billion Fourier transform ion cyclotron resonance mass measurement accuracy with a “walking” calibration equation. Anal Chem. 2011;83:1732–1736. doi: 10.1021/ac102943z. [DOI] [PubMed] [Google Scholar]
- 40.Xian F, Hendrickson CL, Blakney GT, Beu SC, Marshall AG. Automated broadband phase correction of Fourier transform ion cyclotron resonance mass spectra. Anal Chem. 2011;82:8807–8812. doi: 10.1021/ac101091w. [DOI] [PubMed] [Google Scholar]
- 41.Schaub TM, Hendrickson CL, Horning S, Quinn JP, Senko MW, Marshall AG. High Performance Mass Spectrometry: Fourier Transform Ion Cyclotron Resonance at 14.5 Tesla. Anal Chem. 2008;80:3985–3990. doi: 10.1021/ac800386h. [DOI] [PubMed] [Google Scholar]


