

Abstract
The role of cetuximab for the treatment of advanced non-small-cell lung cancer (NSCLC) is currently unclear. The molecular target of cetuximab, epidermal growth factor receptor (EGFR), as measured by fluorescent in situ hybridization (FISH), has shown potential to be a predictive biomarker for cetuximab efficacy in NSCLC. SWOG S0819 is a Phase III trial evaluating both the value of cetuximab in this setting as well as EGFR FISH as a predictive biomarker. This paper describes the decision process for determining the design and interim monitoring plan for S0819. Six possible designs were evaluated in terms of their properties and the hypotheses that can be addressed within the design constraints. A subgroup-focused multiple-hypothesis design was selected for S0819 incorporating co-primary endpoints to assess cetuximab in both the overall study population and among EGFR FISH positive patients with the sample size determined based on evaluation in the EGFR FISH positive group. The interim monitoring plan chosen specifies interim evaluations of both efficacy and futility in the EGFR FISH positive group alone. The futility monitoring plan to determine early stopping in the EGFR FISH non-positive group is based on evaluation within the positive group, the entire study population, and the non-positive group. SWOG S0819 employs a design which addresses both the biomarker-driven and general efficacy objectives of this study.
Keywords: Clinical trial design, Molecular targeted therapies, cetuximab, interim monitoring, non-small cell lung cancer
Introduction
It is well established that the epidermal growth factor receptor (EGFR) is a significant molecular target in the treatment of non-small cell lung cancer (NSCLC). Cetuximab, an EGFR-directed monoclonal antibody, blocks ligand-induced EGFR activation, stimulates receptor internalization, and is capable of inducing antibody-dependent cellular cytotoxicity. SWOG S0819, a currently active Phase III trial, is evaluating whether the addition of cetuximab to chemotherapy improves efficacy in advanced non-small cell lung cancer (NSCLC). Rationale for the trial is provided by the SWOG predecessor phase II trials S0342 and S0536, the first of which evaluated the addition of cetuximab to the chemotherapy doublet carboplatin/paclitaxel, and the second adding bevacizumab to the regimen. (1,2) Both studies met pre-specified benchmarks, indicating that further study of cetuximab was warranted in the Phase III setting, thus leading to development of S0819.
Further motivation for S0819 is based on two randomized phase III studies testing platinum-based doublet chemotherapy with or without cetuximab in first-line therapy of advanced NSCLC: the BMS 099 and First Line Erbitux in Lung Cancer (FLEX) trials. (3,4) BMS 099 was conducted in an unselected advanced stage NSCLC population, not prospectively categorized for EGFR pathway activation. The primary outcome, progression-free survival (PFS) by blinded independent radiologic review was not significantly different between the two treatment arms (HR = 0.90, p = 0.236), but PFS based on institutional review was significantly different in favor of the cetuximab arm (HR = 0.766, p=0.0015). Median survival time (MST) was numerically higher in the cetuximab arm, but this difference was not statistically significant (HR = 0.89, p = 0.17). By comparison, the primary outcome in FLEX was overall survival with eligibility based on patients with tumors exhibiting at least one EGFR positive tumor cell measured by immunohistochemistry (IHC); 85% of screened patients met this criterion. In FLEX, cetuximab significantly prolonged survival (HR = 0.87, p = 0.044), with MST in the cetuximab-containing arm of 11.3 months compared with 10.1 months in the control arm. However, as the benefit of cetuximab was viewed as modest, this trial has not yet resulted in regulatory approval for this combination. Further, these results bring into question whether selection based on minimal IHC criteria is an adequate predictive biomarker for cetuximab-based in this setting.
Alternatively, our group has reported that EGFR measured by fluorescence in situ hybridization (FISH) shows promise as a predictive biomarker for cetuximab-based chemotherapy. Specifically, retrospective analysis of tumor tissue in S0342 evaluated the predictive role of increased gene copy number of EGFR measured by FISH. (5) Tumors with four or more copies of the EGFR gene in ≥ 40% of the cells (high polysomy) or tumors with EGFR gene amplification (gene-to-chromosome ratio ≥ 2 or presence of gene cluster or ≥ 15 gene copies in ≥ 10% of the cells) were considered to be EGFR FISH positive, whereas all other tumors were considered to be EGFR FISH negative. The percentage of patients defined to be EGFR FISH positive in this study was 59%. This analysis showed a doubling of median PFS (6 versus 3 months) and MST (15 versus 7 months) among EGFR FISH positive patients relative to EGFR FISH negative patients. Previous studies had found that EGFR FISH has no prognostic significance. (6,7)
Given the promising but inconclusive data from these Phase II and Phase III studies, SWOG sought to definitively assess the role of cetuximab in the therapy of advanced NSCLC, and in addition to evaluate the role of EGFR measured by FISH as a predictive biomarker. This paper describes the process by which various study designs were compared in order to determine the “best fit” for addressing the co-primary endpoints of efficacy in overall study population plus determination of predictive value of EGFR FISH.
Trial Designs to Address Biomarkers
Broadly speaking there are four types of clinical trial designs to evaluate the role of a treatment with a potentially predictive biomarker. These are: 1) the all-comers design with secondary biomarker objectives, 2) a targeted design that restricts the study population to “marker positive” patients, 3) a strategy design which randomizes patients to receive marker-based or non-marker-based treatment and 4) a multiple-hypothesis design, which is a composite of the targeted and all-comers designs addressing multiple hypotheses as co-primary objectives. (8,9)
Each of these designs may have potential advantages and disadvantages, dependent on the study questions to be addressed. The targeted, strategy, and multiple-hypothesis designs prospectively address a potentially predictive biomarker, while the all-comers design would require independent validation of a biomarker in a separate trial. The targeted and multiple-hypothesis designs prospectively evaluate the efficacy of the experimental treatment within the marker positive subset. The strategy design discussed here is the design where only marker-positive patients randomized to receive marker-based therapy receive the experimental treatment and all other patients are assigned to receive the standard of care. The primary objective of this design is to evaluate whether assignment to treatment based on a biomarker improves outcomes. Moreover, since all marker negative patients are assigned to standard therapy, this design cannot assess the treatment effect in the unselected population or in the marker-negative population. As the targeted design restricts its patient population to marker positive patients, it is also unable to address the role of the experimental treatment in the unselected and marker-negative populations.
Multiple-hypothesis designs usually involve the specification of a hypothesis in the target population defined to be marker positive, as well as in either the entire study population or in the marker-negative population. These hypotheses are treated as “co-primary”, and to control the overall study false positive rate a fraction of the type I error is apportioned to each of the hypotheses.
Multiple-hypothesis designs can be subgroup-focused, overall-population focused, or specify discrete hypotheses for multiple subgroups. In the case of a subgroup-focused design, the study design is based on the subgroup, and the properties of the design in the entire study population are based on the residual type I error and the number of patients needed to screen to achieve the sample size for the subgroup. An overall-population focused design is just the reverse; however in such a design, the marker (or set of markers) does not have to be pre-specified as in the adaptive signature design of Freidlin, et al., 2005. (10) Discrete-hypothesis designs are essentially parallel targeted designs which may include an additional hypothesis (such as an interaction hypothesis test) joining the two together.
Examples in advanced NSCLC of study designs which were overall-population focused are the Sequential Tarceva in Unresectable NSCLC (SATURN) and INTEREST trials. (11,12) An example of a discrete-hypothesis design is the MARVEL trial, which specified separate hypotheses for the marker-positive and marker-negative subgroups defined based on EGFR FISH. (13) A common allocation of the type I error to the primary of the co-primary hypotheses is 80%, but other splits are may be reasonable and will depend on the marker prevalence and specified hypotheses. (10) To determine the testing level for the two hypotheses, one could just use a Bonferroni correction. However, for the subgroup-focused and the overall-focused designs, the subgroup hypothesis is nested within the overall population hypothesis and therefore a Bonferroni split would be conservative. The exact split can be determined analytically, through simulations, or by using software for group sequential designs. (14)
The choice of a trial design involving a biomarker depends greatly upon what is known about the marker specific to the treatment and disease setting. Hoering, et al., 2008 evaluated the relative merits of the all-comer’s, targeted, strategy and overall-population focused multiple-hypothesis trial designs. (8) Their general recommendations are to use the targeted design only when there is good evidence that the marker negative population will not benefit from the experimental treatment, and to use the strategy design only if the strategy hypothesis is truly of more interest and value than the efficacy hypothesis. Otherwise, they recommend using either the all-comer’s design with a marker-driven secondary hypothesis or a multiple-hypothesis design.
The choice between multiple-hypothesis designs should also depend on the specific scenario. The implication of a subgroup-focused design is that there is evidence that the biomarker is predictive and that the entire population may benefit. The implication of the overall population-focused design is that the evidence around the biomarker is less strong, but the inclusion of the biomarker-based subgroup analysis is a back-up plan, should the overall evaluation fail. In a discrete-hypothesis design, separate hypotheses are specified for the biomarker-defined groups. A natural consequence of this is that the separate hypotheses should be different. Should the general hypothesis be the same in both the marker positive and negative groups (at least in direction), then the implication is that there is a hypothesized effect in the unselected population and either the subgroup-focused or overall population-focused multiple-hypothesis designs address this setting more directly, and likely more efficiently.
In the context of the clinical trial setting for S0819, while there is evidence that the effect of cetuximab may be larger in the EGFR FISH positive population, it is not clear that there is no effect in the negative population. Moreover, the primary question is centered around the efficacy of cetuximab, not the effect of assigning treatment based on a biomarker. Therefore the most applicable designs are the all-comer’s design or either the subgroup-focused or overall-population-focused multiple-hypothesis designs.
Design Assumptions
For all of the designs evaluated in this paper, the power for the primary hypothesis was specified to be 90% and the study-wide one-sided type I error rate was 2.5%. The anti-angiogenic agent bevacizumab can be added to the treatment regimen in either arm, based on previously established clinical criteria and randomization is stratified by bevacizumab-eligible status. To determine the null hypothesis for median PFS, it was assumed that approximately 50% of patients would be bevacizumab eligible, that the median PFS with carboplatin/paclitaxel alone would be 4 months, and the median PFS with carboplatin/paclitaxel plus bevacizumab would be 6 months (15,16) Based on previous studies within SWOG it was assumed that the accrual rate would be approximately 366 patients/year. Further, based on Hirsch, et al., 2008, it was assumed that 40% of all screened patients would be EGFR FISH positive, 40% would be EGFR FISH negative, and 20% will have unknown EGFR FISH status either due to insufficient tissue or a failed assay. The EGFR FISH non-positive group is defined as the set of patients with either unknown EGFR FISH status or defined to be EGFR FISH negative.
Based on prior studies it was determined that target level of improvement in the EGFR FISH positive population would be a 33% improvement in median PFS (equivalent to a hazard ratio equal to 0.75), and the target level of improvement in the unselected population was a 20% improvement (equivalent to a hazard ratio equal to 0.83). PFS was chosen as the primary objective in the EGFR FISH positive group because of the potential benefit with an EGFR TKI-inhibitor in the second (or later) line setting. The actual trial was designed with overall survival as the primary outcome for the unselected population (for reasons not described here) which results in slightly less power for the overall population assessment, but to facilitate a fair comparison the candidate designs are here evaluated using the same primary outcome (PFS).
If the data can be assumed to follow the exponential distribution, then the overall population hazard rate can be approximated by a weighted average of the hazard rate in the marker-positive group and the marker-negative group. Moreover, if the marker is not prognostic, then the alternative hazard ratio is approximately a weighted average of the hazard ratios for the marker positive and negative groups. Under these assumptions, a 20% improvement in median PFS overall and a 33% improvement in the EGFR FISH positive group translates into an 11% improvement in the EGFR FISH non-positive group and a 7% improvement in the EGFR FISH negative group. To address the strategy design hypothesis, a 33% improvement in median PFS among EGFR FISH positive patients translates to a 13% improvement associated with assigning treatment based on marker status.
Allocating 80% of the type I error to one of the hypotheses in a multiple-hypothesis design results in a design with 1-sided 0.02 type I error for the primary hypothesis. Using simulations the exact residual type I error for this study was determined to be 0.008 to achieve a study-wide type I error rate of 2.5%. If 60% of the type I error is apportioned to one of the hypotheses in a multiple-hypothesis design, the levels are 0.015 for the primary group and approximately 0.013 for the other group.
Candidate Phase III Designs
Table 1 details the sample size and expected time to completion for the 6 designs considered. Throughout the all-comer’s design will be used as the reference design both in terms of sample size and time to completion. The sample size for the all-comer’s design is 1352 patients with an expected 541 EGFR FISH positive patients. Evaluating the effect of cetuximab in the EGFR FISH positive population at the 2.5% level as a secondary objective has 89.6% power to detect a 33% improvement in median PFS.
Table 1.
Comparison of Designs with 90% power for the primary hypothesis and 1-sided study-wide type I error of 2.5%
| Sample size/# Screened | Time to completion (months) | |||
|---|---|---|---|---|
| FISH+ | Overall | FISH−/Unknown | ||
| Single Hypothesis designs: | ||||
| All-comers | 541 | 1352 | 811 | 57 |
| Targeted Design | 556 | 1390a | N/A | 58 |
| Strategy Design | 1135 | 2838 | 1703 | 105 |
|
| ||||
| Multiple-hypothesisdesigns: | ||||
| Subgroup: 80% | 588 | 1462b | 874 | 60 |
| Subgroup: 60% | 626 | 1558c | 932 | 63 |
| Overall: 80% | 564d | 1420 | 856 | 59 |
Number to be screened,
Power is 84%,
Power is 90%,
Power is 81%
Relative to the all-comers design, the targeted design would require 15 (3%) more EGFR FISH positive patients and therefore necessitate screening 38 (3%) more patients overall, taking just over a month longer to complete the study. The strategy design would require over double the number of patients and would take 84% longer to complete. The subgroup-focused multiple-hypothesis designs would require 9% more patients (47 EGFR FISH positive and 110 overall) and 16% more patients (85 EGFR FISH positive and 206 overall), and would take 5% and 11% longer to complete for the 80% and 60% splits, respectively. The overall population-focused multiple-hypothesis design would require 5% more patients (23 EGFR FISH positive and 68 overall) and would take 4% longer to complete.
For the subgroup-focused multiple-hypothesis designs, the power to evaluate the “secondary” co-primary objective in the overall population is 84% for the 80% split design and 90% for the 60% split design. The power to evaluate the objective in the EGFR FISH positive group in the overall-population focused design is 81%.
S0819: The Design
The design chosen to study the effect cetuximab added to carboplatin and paclitaxel, with variable inclusion of bevacizumab, plus the role of EGFR FISH as a predictive biomarker was the subgroup-focused multiple-hypothesis design with 80% allocation of type I error to the subgroup hypothesis. This design was chosen in part because the total sample size and time to completion were only slightly larger than the all-comer’s design, and the design was able to address the biomarker hypothesis as a primary objective.
The design of S0819 does not require that a patient’s tissue specimen be analyzed by the time they are registered to the study. The decision was primarily based on clinical pragmatism in the setting of advanced stage cancer. As this study is in an advanced disease setting, patients and their physicians typically want to start a patient on treatment as soon as possible. Without the data to support the need for a delay in treatment while waiting for marker determination, this approach was viewed as being in the best interest of patients and avoided a deterrent to accrual. The only possible detriment to this is that randomization cannot be stratified on biomarker status. However, given that the trial size is quite large, stratification is unlikely to be needed. Patients with unknown marker values were also determined to be important to include as the co-primary objective is in the overall unselected population.
Interim Monitoring
Once the design of the study was finalized, the next step was to determine the interim monitoring plan. Four possible decisions could be made at each of the interim time points: the study could continue in the entire study population, continue in the EGFR FISH positive group alone, continue in the EGFR FISH non-positive group alone, or close to further accrual in both the positive and non-positive groups.
To determine the monitoring plan the first set of questions considered were: should monitoring for efficacy occur in both the entire study population and the marker positive group or just in the marker positive group; should futility monitoring occur in both groups or in just one of the groups; and finally, while the study is not designed around an evaluation of treatment efficacy in the non-positive group, should this group be evaluated for efficacy or futility at the interim analyses?
The efficacy monitoring plan chosen was to monitor the EGFR FISH positive group alone and to recommend closure of the entire study if the null hypothesis were rejected in this group. This approach was chosen because the design is focused on the subgroup. Further, if the EGFR FISH positive portion of the study is closed, the objective within the entire study population is not evaluable past this analysis. Therefore, continuation of the study in the non-positive group alone would require a redesign of the trial. S0819 is not powered to evaluate a treatment effect in the EGFR FISH non-positive group; moreover it is unclear what level of testing should be used to test an effect in this group, should the EGFR FISH positive hypothesis be rejected.
Determination of the futility monitoring plan was more complicated. While it was felt that the design warranted a somewhat conservative monitoring plan to be able to address both hypotheses, this should not be at the expense of harming any subgroup of patients. As this design used 1-sided testing, evaluation of futility was framed in terms of rejecting or failing to reject the alternative hypothesis. For futility monitoring in the EGFR FISH positive population, the question was should decisions be based on this group alone, or should information from the overall population assessment be included? That is, should futility for assessing the marker-driven hypothesis be determined if the alternative hypothesis is rejected in the marker positive group alone, or should futility be determined only if both the marker positive and the overall population alternatives are rejected?
The next issue to address was how to determine stopping for futility related to the overall study population hypothesis. Using the same logic employed to determine the efficacy monitoring approach, it was determined that the entire study should be closed for futility should futility be established in the EGFR positive group. However, failing to stop for either efficacy or futility in the EGFR FISH positive group should not necessarily mean that the study should continue in the non-positive group. But how should futility be determined in the non-positive subgroup? Should the evaluation be based on an evaluation in the overall study population, the EGFR FISH non-positive population, or some combination of the two?
Consistent with the plan to use a moderately conservative approach to monitoring, all monitoring plans utilized the standard SWOG approach to interim monitoring. Boundaries for testing are defined on the fixed-sample p-value scale and hypotheses are tested at one tenth of the overall level. The same level was used to evaluate the non-positive group as was used for the positive group. Therefore, interim testing for efficacy and futility in the EGFR FISH positive group and futility alone in the non-positive group was specified at the 0.002 level and for the overall population interim futility testing was specified at the 0.0008 level. To account for the effect of efficacy testing, the level for testing the null in the EGFR FISH positive group at the final analysis was 0.018. Levels in the overall and non-positive group were not adjusted since they were only evaluated for futility. To determine efficacy in the overall population, the null hypothesis will be tested at the 0.008 level at the final analysis, whether or not this is an interim analysis time with stopping based on the EGFR FISH positive group or at the full completion of the trial. Figure 1 depicts the stopping boundaries on the hazard ratio scale with values above one representing benefit and below one representing harm. The upper line represents the efficacy boundary for the EGFR FISH positive group. The lower lines represent the futility boundaries for the EGFR FISH positive group (thin line), the entire study (thick line) and the EGFR FISH non-positive group (dashed line).
Figure 1.
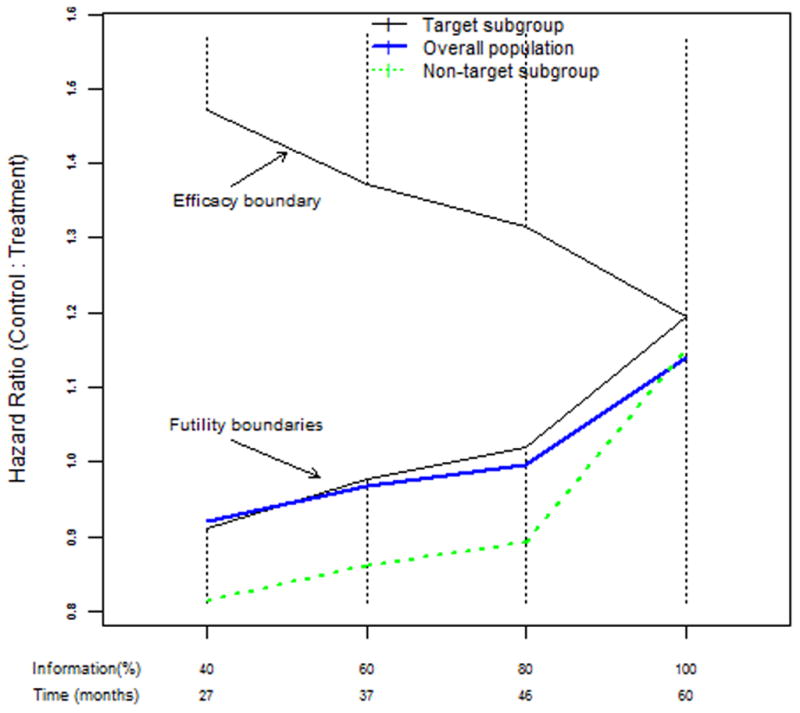
Stopping boundaries on the hazard ratio scale for S0819, a subgroup-focused multiple-hypothesis design
Simulation Study to Evaluate Monitoring Plans
To address the questions stated above and to determine the rules for stopping for futility using these boundaries the study design was simulated under 5 scenarios. For each scenario PFS data were simulated under an exponential distribution using the SWOG S0819 parameters, with 588 EGFR positive patients and 1462 total patients included and equal probability of randomization to the experimental versus control arm. Registration times were generated from a uniform distribution over a 48 month accrual period. For each scenario, 10,000 sets of data were generated. The hazard ratios specified in terms of the percent improvement in median PFS used to generate the experimental arm data for the EGFR FISH positive and EGFR FISH non-positive groups and the associated overall study population hazard ratios are presented in Table 2.
Table 2.
Hazard Ratios for Simulation Scenarios to Evaluate Interim Monitoring for S0819 Design
| EGFR FISH+ | Overall Population | EGFR FISH− | |
|---|---|---|---|
|
| |||
| Scenario 1 | 1.33 | 1.2 | 1.11 |
| Scenario 2 | 1.33 | 1.13 | 1.0 |
| Scenario 3 | 1.5 | 1.2 | 1.0 |
| Scenario 4 | 1.2 | 1.2 | 1.2 |
| Scenario 5 | 1.0 | 1.0 | 1.0 |
The first scenario is when both alternative hypotheses are true: there is a significant effect in both the EGFR FISH positive group and overall, indicating a modest effect in the non-positive group. In the second and third scenarios, the treatment effect is restricted to the positive group and there is no effect in the negative group. The effect is modest in overall population for the second scenario and equal to the design effect of a 20% improvement in the third scenario. The fourth scenario is the situation where there is an effect overall but EGFR FISH is not predictive. And finally, the last scenario specifies no effect in any group.
Interim analyses were performed at 40, 60, and 80% of the expected progression events. For each of the scenarios the frequency and properties of stopping the EGFR FISH non-positive group was determined based on an evaluation of the overall population hypothesis alone, the associated hypothesis within the EGFR FISH non-positive group alone, and stopping in the non-positive group if either the overall population or the non-positive group alternative hypotheses were rejected. Table 3 presents the frequency of rejecting the null hypothesis, stopping early for futility, and the average sample size, percent information, and study time under the different scenarios and stopping rules only for the EGFR FISH positive group.
Table 3.
Properties of the interim monitoring plan in the EGFR FISH Positive group for the subgroup-focused multiple-hypothesis design with 90% power to detect a 33% improvement in median PFS and 1-sided 2% level type I error
| Scenario | Design Powera | Percentage of: | Average: | |||||
|---|---|---|---|---|---|---|---|---|
| Reject b H0(%) | Early Stops | Stops for Efficacy | Stops for Futility | Sample Size | Events (%) | Study Time | ||
| 1& 2 | 90.1 | 89.5 | 59.6 | 59.1 | 0.6 | 498 | 75 | 46 |
| 3 | 99.6 | 99.5 | 75.0 | 74.5 | 0.5 | 483 | 70 | 42 |
| 4 | 53.6 | 52.6 | 26.4 | 20.6 | 5.7 | 553 | 90 | 54 |
| 5 | 2.0 | 1.9 | 61.8 | 0.4 | 61.4 | 487 | 74 | 44 |
The proportion of times the null was rejected if the study had gone to complete accrual with no interim stops
Proportion of time the null hypothesis was rejected accounting for interim monitoring
The proposed monitoring plan within the EGFR FISH positive group performed as expected. In the first and second scenarios which specified the same alternative for the positive group, the study stopped early for efficacy 59% of the time, and retained the power to reject the null and stopped for futility 0.6% of the time. For the scenario with the larger than specified effect (a 50% improvement), the trials were stopped early for efficacy 74.5% of the time, and for futility 0.5% of the time. Under the smaller effect size of a 20% improvement (scenario 4), the percentage of early stops was 20.6% for efficacy and 5.7% for futility. Under the null (scenario 5), the percentage of early stops was 0.4% for efficacy and 61.4% for futility.
The properties of the three candidate futility monitoring plans for the non-positive group did not vary significantly across the scenarios (see Table 4). In the first scenario, monitoring the overall population alone stopped for futility 0.8% of the time, 0.2% more often than monitoring in the EGFR FISH positive group alone. Monitoring the EGFR FISH negative group alone stopped for futility 1% of the time and monitoring both groups stopped 1.1% of the time. There was a significant decrease in power from 82.5% to 74.3% as a result of early stopping for efficacy in the EGFR FISH positive group and there was no difference across the three candidate plans. When the benefit was restricted to the positive group, the percentage of early stops for futility based on monitoring the overall group alone, the non-positive group alone, and the combined evaluation, respectively was 3.2%, 7.5%, and 8.3% in scenario 2 and 0.6%, 2.9%, and 3.0% for scenario 3. The candidate plans were essentially identical when the effect was consistent across the subgroups (scenario 4), stopping for futility 5.8% of the time and had only a modest reduction in power from 84% to 81%. In the completely null situation (scenario 5), the trial was stopped based on the assessment in the EGFR FISH positive group alone 61.8% of the time and it was this evaluate that accounting for the majority of early stops for futility in the EGFR non-positive group. Monitoring in the overall population alone stopped for futility 9.3% more often, monitoring the non-positive group alone stopped 3.1% more often, and using the combined evaluation stopped 9.5% more often than stopping purely based on the EGFR FISH positive futility monitoring.
Table 4.
Properties of the three candidate monitoring plans for the overall population component of the subgroup-focused multiple-hypothesis design with 80% type I error allocation to the subgroup
| Design Powera | Reject b H0(%) | Early Stops: | Result at Early stop: | Average: | ||||||
|---|---|---|---|---|---|---|---|---|---|---|
| % Early | % Futility | Reject Ha | Inconclusive | Reject H0 | Sample Size | Stopping Time | % Events | |||
| Scenario 1 | 82.5 | |||||||||
| Overall only | 74.3 | 59.8 | 0.8 | 0.3 | 12.5 | 47.0 | 1240 | 75 | 45 | |
| FISH-only | 74.3 | 59.8 | 1.0 | 0.1 | 12.7 | 47.0 | 1240 | 75 | 45 | |
| Either | 74.3 | 59.9 | 1.1 | 0.2 | 12.7 | 47.0 | 1239 | 75 | 45 | |
|
| ||||||||||
| Scenario 2 | 44.3 | |||||||||
| Overall only | 32.9 | 61.9 | 3.2 | 2.9 | 34.6 | 24.3 | 1230 | 74 | 45 | |
| FISH-only | 32.9 | 63.0 | 7.5 | 1.7 | 37.0 | 24.3 | 1220 | 73 | 44 | |
| Either | 32.9 | 63.7 | 8.3 | 2.5 | 36.9 | 24.3 | 1217 | 73 | 44 | |
|
| ||||||||||
| Scenario 3 | 80.4 | |||||||||
| Overall only | 58.4 | 75.0 | 0.6 | 0.1 | 36.7 | 38.3 | 1202 | 70 | 42 | |
| FISH-only | 58.4 | 75.0 | 2.9 | 0.1 | 36.7 | 38.3 | 1202 | 70 | 42 | |
| Either | 58.4 | 75.0 | 3.0 | 0.1 | 36.7 | 38.3 | 1202 | 70 | 42 | |
|
| ||||||||||
| Scenario 4 | 83.9 | |||||||||
| Overall only | 80.8 | 26.5 | 5.8 | 0.2 | 6.4 | 19.9 | 1374 | 90 | 54 | |
| FISH-only | 80.8 | 26.4 | 5.8 | 0.1 | 6.4 | 19.9 | 1375 | 90 | 54 | |
| Either | 80.8 | 26.5 | 5.9 | 0.2 | 6.4 | 19.9 | 1374 | 90 | 54 | |
|
| ||||||||||
| Scenario 5 | 1.0 | |||||||||
| Overall only | 1.0 | 71.6 | 71.1 | 39.5 | 32.0 | 0.1 | 1158 | 68 | 41 | |
| FISH-only | 1.0 | 65.3 | 64.9 | 32.3 | 32.9 | 0.1 | 1194 | 72 | 43 | |
| Either | 1.0 | 71.7 | 71.3 | 39.1 | 32.5 | 0.1 | 1156 | 68 | 41 | |
The proportion of times the null was rejected if the study had gone to complete accrual with no interim stops
Proportion of time the null hypothesis was rejected accounting for interim monitoring
The probability of rejecting both hypotheses for the three candidate plans is presented in Table 5. Monitoring based on the non-positive group alone has a greater impact on the minimal power (the probability of rejecting at least one false null) than the plan based on the overall population alone. The plans based on monitoring the overall population (either alone or with the non-positive group) also more effectively retain the false positive rate. The level is likely increased in the non-positive evaluation because the overall population hypothesis is tested at the 0.008 level at the final analyses, be it an interim or at the full information level.
Table 5.
Probability of rejecting either null hypothesis in the subgroup-focused multiple-hypothesis design with 90% power in the subgroup and 80% type I error allocation in the subgroup for the three candidate futility monitoring plans
| Scenario | Minimal power | Overall alone | FISH-alone | Either |
|---|---|---|---|---|
| 1 | 94.0 | 93.7 | 92.5 | 92.4 |
| 2 | 90.3 | 89.9 | 89.7 | 89.7 |
| 3 | 99.6 | 99.5 | 99.5 | 99.5 |
| 4 | 86.1 | 83.9 | 82.5 | 80.6 |
| 5 | 2.7 | 2.6 | 2.9 | 2.4 |
Given that the choice of monitoring plan did not seem to affect the power for the overall hypothesis substantially across the three futility monitoring plans for futility in the non-positive group, the final design included the plan that performed the best across all scenarios. Therefore final plan defines futility based on the combined evaluation in the overall and the non-positive group.
Discussion
Clearly there is no one “right” design for addressing the variety of issues involved in assessing a potential predictive biomarker of cancer therapy, but the choice of trial design in each case must account for what is known and what remains unknown in specific clinical scenarios. (17) Each of designs considered for S0819 have associated benefits and statistical costs. While the subgroup-focused multiple-hypothesis design chosen is almost as efficient as the all-comer’s design (i.e. similar sample size and time to completion), the cost of the multiple-hypothesis design chosen was a reduction in power in the overall population.
A possible complication of the S0819 design is deciding on what should be the conclusion about EGFR FISH as a predictive biomarker if both hypotheses are rejected in favor of the alternative. As the power detect the differences in hazard ratios specified in this design is only 50% using a 1-sided 0.05 level test, it is highly unlikely that an interaction will be detected, even if it exists. But this does not reduce the value of significant findings. In this case, the shift in focus should be whether or not the statistically significant effects are clinically meaningful effects. The sample size for both the subgroups based on biomarker values: positive, negative, and unknown are relatively large and will provide good measures of precision of the estimates. These data can be used to evaluate if the EGFR FISH positive group derives a greater benefit from cetuximab.
The multiple-hypothesis design chosen for this study retains flexibility to evaluate additional biomarkers, perhaps even ones that are discovered or become important after a trial is initiated. Subsequent to activation of S0819, both the BMS099 and FLEX studies published on the potentially predictive effect of EGFR as measured by FISH, IHC, and by mutational status. (18,19,20) While the majority of biomarkers evaluated were not found to be associated with cetuximab efficacy, in FLEX, high tumor EGFR expression (200 and above on a scale of 0–300) was found to be significantly associated cetuximab efficacy.
Another key aspect of the trade-offs between the various designs is the prevalence of the biomarker. (21,22) For the subgroup-focused multiple-hypothesis designs, the power to detect a specific hazard ratio in the overall study population increases with decreasing prevalence as a result of the need to enroll more patients. That said, the specified hazard ratio in the overall population should likely be decreased with decreasing marker prevalence or the treatment effect in the marker positive group should be increased. For example, if the prevalence were only 20%, then a 33% improvement in the positive group and an 11% improvement in the non-positive group would translate to an 15% improvement overall. Thus a subgroup-focused multiple-hypothesis design would require the accrual of 2,846 patients to accrue 572 EGFR FISH positive patients over a 94 month period. The residual type I error with 20% marker prevalence is 0.6%, and therefore with 2,846 patients, the study would have 88% power to detect a 15% improvement in median PFS. Alternatively, assuming the prevalence is 20% and retaining the assumed 20% improvement overall and 11% improvement in the non-positive group results in a target of a 56% improvement in the marker positive group. With the larger effect size for EGFR FISH positive patients, a total of 1,212 patient accruals are needed to accrual 248 marker positive patients. However, now the design only has 72% power to detect a 20% improvement in median PFS.
In conclusion, we have discussed possible studies designs specific to our disease setting and trial-specific assumptions. By carefully evaluating the properties of various designs we conclude that the multiple-hypothesis design selected for SWOG S0819 is well situated to robustly address the variety of scenarios possible in this clinical setting and to provide meaningful answers to the S0819 study questions
Acknowledgments
We would like to thank Michael LeBlanc for his helpful comments on this manuscript and for the many discussions when this trial was being designed. We would also like to thank James Moon for his input on the trial design.
Grant Support: This investigation was supported in part by the following PHS Cooperative Agreement grant numbers awarded by the National Cancer Institute, DHHS: CA32102, CA38926, CA46441, CA105409, CA42777 and NIH grant CA090998.
Footnotes
Clinical Trials Registration: ClinicalTrials.govIdentifier: NCT00946712
Conflicts of Interest: None
References
- 1.Herbst RS, Kelly K, Chansky K, Mack PC, Franklin WA, Hirsch FR, et al. Phase II selection design trial of concurrent chemotherapy and cetuximab versus chemotherapy followed by cetuximab in advanced-stage non-small-cell lung cancer: Southwest Oncology Group study S0342. J Clin Oncol. 2010;28 (31):4747–4754. doi: 10.1200/JCO.2009.27.9356. [DOI] [PMC free article] [PubMed] [Google Scholar]
- 2.Gandara DR, Kim ES, Herbst RS. S0536: Carboplatin, paclitaxel, cetuximab followed by cetuximab and bevacizumab maintenance in advanced non-small cell lung cancer: A SWOG phase II study. J Clin Oncol. 2009;27(15s suppl):abst 8015. doi: 10.1097/JTO.0000000000000009. [DOI] [PMC free article] [PubMed] [Google Scholar]
- 3.Pirker R, Pereira J, Szczesna A, von Pawel J, Krzakowski M, Ramlau R, et al. Cetuximab plus chemotherapy in patients with advanced non-small-cell lung cancer (FLEX): an open-label randomised phase III trial. Lancet. 2009;373 (9674):1525–1531. doi: 10.1016/S0140-6736(09)60569-9. [DOI] [PubMed] [Google Scholar]
- 4.Lynch T, Patel T, Dreisbach L, McCleod M, Heim W, Hermann R, et al. Cetuximab and first-line taxane/carboplatin chemotherapy in advanced non-small-cell lung cancer: results of the randomized multicenter phase III trial BMS099. J Clin Oncol. 2010;28(6):911–917. doi: 10.1200/JCO.2009.21.9618. [DOI] [PubMed] [Google Scholar]
- 5.Hirsch FR, Herbst RS, Olsen C, Chansky K, Crowley J, Kelly K, et al. Increased EGFR gene copy number detected by fluorescent in situ hybridization predicts outcome in non-small-cell lung cancer patients treated with cetuximab and chemotherapy. J Clin Oncol. 2008;26(20):3351–3357. doi: 10.1200/JCO.2007.14.0111. [DOI] [PMC free article] [PubMed] [Google Scholar]
- 6.Hirsch F, Varella-Garcia M, Bunn PJ, Franklin W, Dziadziuszko R, Thatcher N, et al. Molecular predictors of outcome with gefitinib in a phase III placebo-controlled study in advanced non-small-cell lung cancer. J Clin Oncol. 2006;24(31):5034–5042. doi: 10.1200/JCO.2006.06.3958. [DOI] [PubMed] [Google Scholar]
- 7.Hirsch FR, Varella-Garcia M, Di Marie MV, Veve R, Baron AE, Zeng C, Franklin WA, Bunn PA., Jr Epidermal growth factor receptor in non-small cell lung carcinomas: Correlation between gene and protein expression and impact prognosis. J Clin Oncol. 2003;21:3798–3807. doi: 10.1200/JCO.2003.11.069. [DOI] [PubMed] [Google Scholar]
- 8.Hoering A, LeBlanc M, Crowley J. Randomized phase III clinical trial designs for targeted agents. Clin Cancer Res. 2008;14(14):4358–4367. doi: 10.1158/1078-0432.CCR-08-0288. [DOI] [PMC free article] [PubMed] [Google Scholar]
- 9.Mandrekar S, Sargent D. Clinical trial designs for predictive biomarker validation: theoretical considerations and practical challenges. J Clin Oncol. 2009;27(24):4027–4034. doi: 10.1200/JCO.2009.22.3701. [DOI] [PMC free article] [PubMed] [Google Scholar]
- 10.Freidlin B, Simon R. Adaptive Signature Design: an adaptive clinical trial design for generating and prospectively testing a gene expression signature for sensitive patients. Clin Cancer Res. 2005;11(21):7872–7878. doi: 10.1158/1078-0432.CCR-05-0605. [DOI] [PubMed] [Google Scholar]
- 11.Cappuzzo F, Ciuleanu T, Stelmakh L, Cicenas S, Szczésna A, Juhász E, et al. Erlotinib as maintenance treatment in advanced non-small-cell lung cancer: a multicentre, randomised, placebo-controlled phase 3 study. Lancet Oncol. 2010;11(6):521–529. doi: 10.1016/S1470-2045(10)70112-1. [DOI] [PubMed] [Google Scholar]
- 12.Kim E, Hirsh V, Mok TS, Gervais R, Wu Y, Li L, et al. Gefitinib versus docetaxel in previously treated non-small-cell lung cancer (INTEREST): a randomised phase III trial. Lancet. 2008;372(9652):1809–1818. doi: 10.1016/S0140-6736(08)61758-4. [DOI] [PubMed] [Google Scholar]
- 13.Wakelee H, Kernstine K, Vokes E, Schiller J, Baas P, Saijo N, et al. Cooperative group research efforts in lung cancer 2008: focus on advanced non-small cell lung cancer. Clin Lung Cancer. 2008;9(6):346–351. doi: 10.3816/CLC.2008.n.050. [DOI] [PubMed] [Google Scholar]
- 14.Spiessens B, Dubois M. Adjusted significance levels for subgroup analyses in clinical trials. Contemp Clin Trials. 2010;6:647–656. doi: 10.1016/j.cct.2010.08.011. [DOI] [PubMed] [Google Scholar]
- 15.Williamson S, Crowley J, Lara PJ, McCoy J, Lau D, Tucker R, et al. Phase III trial of paclitaxel plus carboplatin with or without tirapazamine in advanced non-small-cell lung cancer: Southwest Oncology Group Trial S0003. J Clin Oncol. 2005;23(36):9097–9104. doi: 10.1200/JCO.2005.01.3771. [DOI] [PubMed] [Google Scholar]
- 16.Sandler A, Gray R, Perry MC, JB, Schiller J, Dowlati A, et al. Paclitaxel-carboplatin alone or with bevacizumab for non-small cell lung cancer. N Engl J Med. 2006;355(24):2542–2550. doi: 10.1056/NEJMoa061884. [DOI] [PubMed] [Google Scholar]
- 17.Freidlin B, McShane LM, Korn EL. Randomized Clinical Trials with Biomarkers: Design Issues. JNCI. 2010;102(3):152–160. doi: 10.1093/jnci/djp477. [DOI] [PMC free article] [PubMed] [Google Scholar]
- 18.O’Byrne K, Gatzemeier U, Bondarenko I, Barrios C, Eschbach C, Martens U, et al. Molecular biomarkers in non-small-cell lung cancer: a retrospective analysis of data from the phase 3 FLEX study. Lancet Oncol. 2011;12(8):795–805. doi: 10.1016/S1470-2045(11)70189-9. [DOI] [PubMed] [Google Scholar]
- 19.Pirker R, Paz Ares L, Eberhardt W, Krzakowski M, Störkel S, Heeger S, et al. High EGFR expression a predictor for improved survival with cetuximab plus chemotherapy. World Conference on Lung Cancer; Amsterdam: IASLC; 2011. [Google Scholar]
- 20.Khambata-Ford S, Harbison CT, Hart LL, Awad M, Xu LA, Horak CE, et al. Analysis of potential predictive markers of cetuximab benefit in BMS099, a phase III study of cetuximab and first-line taxane/carboplatin in advanced non-small-cell lung cancer. J Clin Oncol. 2010;28(6):918–927. doi: 10.1200/JCO.2009.25.2890. [DOI] [PubMed] [Google Scholar]
- 21.Sargent D, Conley B, Allegra C, Collette L. Clinical trial designs for predictive marker validation in cancer treatment trials. J Clin Oncol. 2005;9:2020–2027. doi: 10.1200/JCO.2005.01.112. [DOI] [PubMed] [Google Scholar]
- 22.Simon R, Maitournam A. Evaluating the efficiency of targeted designs for randomized clinical trials. Clin Cancer Res. 2004;10:6759–6763. doi: 10.1158/1078-0432.CCR-04-0496. [DOI] [PubMed] [Google Scholar]