

Abstract
Purpose
To measure natural image search performance in patients with central vision impairment. To evaluate the performance effect for a JPEG based image enhancement technique using the visual search task.
Method
150 JPEG images were presented on a touch screen monitor in either an enhanced or original version to 19 patients (visual acuity 0.4 to 1.2 logMAR, 6/15 to 6/90, 20/50 to 20/300) and 7 normally sighted controls (visual acuity −0.12 to 0.1 logMAR, 6/4.5 to 6/7.5, 20/15 to 20/25). Each image fell into one of three categories: faces, indoors, and collections. The enhancement was realized by moderately boosting a mid-range spatial frequency band in the discrete cosine transform (DCT) coefficients of the image luminance component. Participants pointed to an object in a picture that matched a given target displayed at the upper-left corner of the monitor. Search performance was quantified by the percentage of correct responses, the median search time of correct responses, and an “integrated performance” measure – the area under the curve of cumulative correct response rate over search time.
Results
Patients were able to perform the search tasks but their performance was substantially worse than the controls. Search performances for the 3 image categories were significantly different (p≤0.001) for all the participants, with searching for faces being the most difficult. When search time and correct response were analyzed separately, the effect of enhancement led to increase in one measure but decrease in another for many patients. Using the integrated performance, it was found that search performance declined with decrease in acuity (p=0.005). An improvement with enhancement was found mainly for the patients whose acuity ranged from 0.4 to 0.8 logMAR (6/15 to 6/38, 20/50 to 20/125). Enhancement conferred a small but significant improvement in integrated performance for indoor and collection images (p=0.025) in the patients.
Conclusion
Search performance for natural images can be measured in patients with impaired vision to evaluate the effect of image enhancement. Patients with moderate vision loss might benefit from the moderate level of enhancement used here.
1. Introduction
The leading cause of vision impairment particularly in the elderly population is age-related macular degeneration.1 With a projected increase in this population, it is important to devise and test effective rehabilitation techniques. Image enhancement has been suggested as a viable vision rehabilitation option for patients with vision impairment resulting from loss of visual acuity and or contrast sensitivity. 2–5 Such techniques can be applied to activities of daily living such as TV viewing and internet use. A recent survey study 6 has determined that visually impaired people have similar video viewing habits as normally sighted people, and most visually impaired people are interested in image enhancement technologies for TV watching and computer use.4, 6
Prior studies have found that visually impaired prefer image enhancement in both static images 5, 7, 8 and videos.4, 9, 10 More specifically, it was found that patients preferred moderate level of enhancement, and rejected higher level of enhancement due to the unnatural appearance of the images. 10 A similar preference for only moderate level of enhancement was also found for normally sighted observers. 11 While preference is an important criterion for determining the value of image enhancement, it is basically a subjective outcome. It is also important to objectively measure the functional benefits (i.e. improved performance) of the technology. It is possible that a technology that improves performance may not be preferred by the patients (e.g. bioptic telescopes that would help viewing in a sport arena may be rejected by a patient for cosmetic reasons). An optimal technology would be both preferred by the patients and aid their visual performance.
A few studies have reported the effect of image enhancement on functional visual performance for images.3, 12, 13 Peli et al found improvement with adaptive enhancement, adaptive thresholding, and band enhancement for recognition of celebrities faces.3, 14 Mei et al tested enhancement filters preferred by each individual and reported improved recognition of facial expression.13
Most of prior studies that examined visual search with impaired vision either used a feature search paradigm, where a square target was asked to be identified amongst distracters 15 or had the subjects locate and identify the orientation of a Landolt’s C target.16 In our study we used natural images (photos) that more closely represent real world tasks to evaluate the visual performance.
The visual search task was used to evaluate a JPEG based image enhancement. The preference for this kind of enhancement has been previously documented for both static images,7 and motion videos.9, 10, 17 Since JPEG was adopted for image compression in the 1990s, it has become the most popular static image format. It is well-suited for image storage and transfer because of its high compression and selectable image quality. Similar image compression technology has been adopted in video image coding (for spatial image compression), such as MPEG2 (used by DVD) and H.264 (commonly used in videos on Internet and portable devices). Current digital TV broadcasting also relies on JPEG based video compression technologies to provide many channels within a limited bandwidth. It is not an overstatement that JPEG image compression is the foundation of modern image information transfer. With increasing dependence on electronic media for information dissemination, it is worthwhile to evaluate image enhancement for compressed images such as JPEG for vision rehabilitation applications. We need to determine if the image compression may interfere and/or restrict the ability to enhance JPEG images.
2. Methods
Subjects
Nineteen patients (9 males, age: 26 to 81 years, median 62 years) with binocular visual acuity of 0.4 to 1.2 logMAR (6/15 to 6/90; 20/50 to 20/300) were enrolled in the study. Table 1 shows the distribution of these patients along with their ocular diagnosis. Seven normally sighted participants (3 males, age: 21 to 75 years, median 62 years) with binocular visual acuity of 0.1 logMAR (6/7.5, 20/25) or better served as control subjects. All participants signed an informed consent. The study was approved by the institutional review board of Schepens Eye Research Institute and adhered to the tenets of the declaration of Helsinki.
Table 1.
Age, sex, visual acuity (VA) distribution along with diagnosis is shown for the patients enrolled in the study.
| S.No | Age | Sex | VA logMAR (6/YY;20/XX) | Diagnosis |
|---|---|---|---|---|
| 1 | 71 | Male | 0.40 (15; 50) | Diabetic Retinopathy |
| 2 | 81 | Female | 0.40 (15; 50) | AMD |
| 3 | 65 | Male | 0.48 (18; 60) | Angioid streaks |
| 4 | 68 | Female | 0.48 (18; 60) | AMD |
| 5 | 36 | Male | 0.48 (18; 60) | North Carolina retinal dystrophy |
| 6 | 81 | Female | 0.60 (18; 80) | AMD |
| 7 | 68 | Female | 0.70 (30; 100) | AMD |
| 8 | 47 | Male | 0.70 (30; 100) | Coloboma, nystagmus |
| 9 | 68 | Female | 0.80 (38; 125) | AMD |
| 10 | 79 | Female | 0.80 (38; 125) | AMD |
| 11 | 62 | Female | 0.9 (48; 160) | AMD |
| 12 | 43 | Female | 0.90 (48; 160) | JMD |
| 13 | 46 | Male | 0.90 (48; 160) | JMD |
| 14 | 59 | Female | 0.90 (48; 160) | Myopic degeneration |
| 15 | 26 | Female | 1.0 (60; 200) | ROP |
| 16 | 54 | Male | 1.1 (75; 250) | Glaucoma, Retinal detachment |
| 17 | 33 | Male | 1.1 (75; 250) | JMD |
| 18 | 52 | Male | 1.2 (90; 300) | Myopic degeneration |
| 19 | 62 | Male | 1.2 (90; 300) | JMD |
AMD – Age-related macular degeneration, JMD – Juvenile macular degeneration, ROP – retinopathy of prematurity
Stimuli
Static high definition images (1600x1200 pixels) in JPEG format were collected from websites such as Flickr and Google images. Images were classified into one of three categories namely faces, indoors and collections (Figure 1). The faces category comprised of images with small groups of people, such as sports teams, class pictures etc. Some (not all) images had people wearing uniforms and posing in a similar manner. The indoors category of images contained images of kitchens, living rooms etc. without any people. The collections images contained various objects from the same category such as shells, toys etc. These image categories were selected for specific reasons. Difficulty in face recognition is a common complaint of patients with central vision impairment18, 19. Searching for objects in indoor images is closer to real world search tasks, but a top-down knowledge could be used to locate the search targets (e.g. search for a flower vase on a table rather than on the ceiling) Therefore, the third category called collections was added, for which no such top-down knowledge could be applied.
Figure 1.

Examples of the search images used in the study. Images were broadly classified into (from left to right) faces, indoors and collections. Given search targets were shown on the left corner in the experiment.
Initially 300 images (100 in each category) were tested in a pilot study with 10 normally sighted individuals (who did not participate in the main study), half of whom wore a contrast-reducing filter to simulate low vision. Based on the average search time of the pilot subjects, 150 images (50 in each category) with shorter search times were selected for the main study. It was determined that the other images were too difficult for some patients, and would extend the experiment time beyond a practical limit.
JPEG image Enhancement
Peli et al have proposed an image enhancement method that directly boosts the amplitude (contrast) of mid spatial frequency bands of the quantization table in the JPEG or MPEG decoder. 7, 20 This technique can be performed at the receiver end and requires little additional computation beyond what is normally done in decoding the transmitted image or video sequence. Using the same technique in this study, the discrete cosine transform (DCT) frequency table of each 8x8 pixel block in the JPEG images was multiplied with the filter shown in Figure 2a. Each cell in the frequency table represents a particular spatial frequency component of the image block, with the upper-left cell being the average luminance, and the lower-right cell being the highest frequency in diagonal direction. The corresponding retinal spatial frequency in our set up for each of the horizontal DCT components is listed in the figure (the same values apply for the vertical components). The enhancement filter we used boosts mid-range frequency, while the lower gain at low and high frequencies limits ringing artefacts in the images. Only the luminance component was modified, and the chromatic components were not changed.
Figure 2.
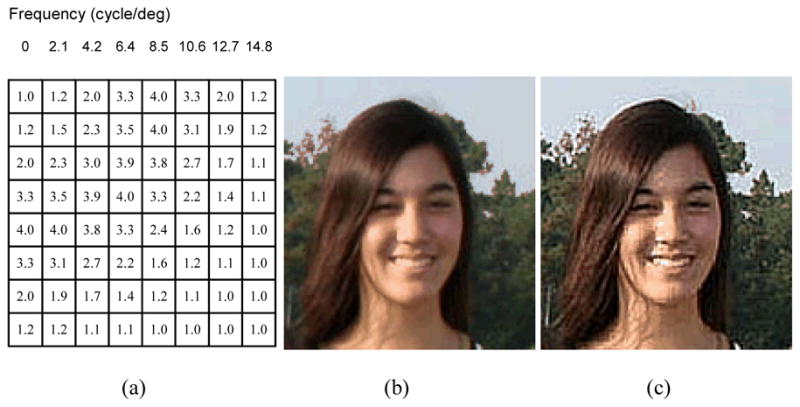
(a) The mid frequency bands in the JPEG quantization table are boosted directly in the JPEG decoder (shown here as scale coefficients larger than 1). Retinal spatial frequencies corresponding to the quantization table are listed above the table. Examples of original and enhanced images are shown in (b) and (c), respectively.
Experimental task
Images were presented using a MATLAB program on a touch screen monitor (NEC Multisync LCD 2090UXi; 40.7 cm wide by 30.5 cm high; set at its native resolution 1600×1200 pixel; maximum brightness: 190 cd/m2). A target object preselected from each of the search images was presented on the upper left corner along with the search image on the screen (Figure 3). Subjects were asked to find the targets on the screen as quickly and many as possible. A 60-pixel (1.5cm) wide tolerance zone around the target image was allowed. If the subject was unable to find the target s/he was encouraged to select the closest matching target or touch anywhere on the screen to begin the next trial. The response time was recorded as the time duration from an image onset to the touch response from the subject.
Figure 3.

Visual search experimental set up. The subject’s task is to find the object that matches the target displayed on the upper left corner of the monitor by touching the screen with the stylus.
Subjects were seated at 40 cm, to permit comfortable reach over the entire area of the touch screen. The display was lowered on the stand to permit presbyopes to comfortably view through their reading aids. 150 images (50 images per image category) were presented randomly, half of which were enhanced. A break was given after every 30 trials and at any other time if requested by the subject.
Data Analysis
Conventional performance measures for visual search uses percentage of correct response and median (or average) response time. These two legitimate measures quantify two different aspects of performance and they may change inconsistently from one testing condition to another. The result will be ambiguous when there is an improvement in one measure but a decrement in the other. The usual practice to deal with this problem is to examine accuracy within a fixed time window, or examine the response time for a fixed accuracy. For instance, Smith et al. measured the search time for 100% correct response on normally sighted glaucoma patients, 21 whereas Mei tested discrimination performance of facial expression within 0.73 seconds display duration.13 The selection of such a time window or accuracy is usually somewhat arbitrary. As the example in Figure 4 illustrates, where search performances in two conditions are compared, if percentage of correct response is examined at an arbitrary 30 seconds search time or simply the median search time of each condition is used, performance in condition 1 would be better than condition 2. However, the final percentage of correct response in condition 2 is better than condition 1. In this study we added a novel measure that combines the two conventional measures that we call “integrated performance”. As shown in Figure 4, the integrated performance measure is based on the cumulative percentage of correct response with increase in the search time. The area under the curve generated by the cumulative function is used as the integrated performance measure. Generally, a higher percentage of correct response and a shorter search time will result in a larger area under the curve, which represents better search performance. Having a unitary measure allows us to quantify performance more comprehensively and unambiguously. In the area computation, the search time ranging from the fastest response to the longest response for each individual was normalized to 1, and the percentage of correct response was not normalized. The best performance one can achieve by this computation is 1.
Figure 4.

Illustration of cumulative correct response versus search time. These are real data from one subject used only to illustrate the analysis method. Here conditions 1 and 2 are universal, and they do not refer to any specific condition. Search performance can be quantified by the area under the curve, which combines both the percentage of correct response and the search time. A larger area, such as that of condition 1 here, represents a better performance. The area is computed with the longest response time normalized to 1 (not shown here). If measured by final correct response, performance in condition 2 would be better. If measured by median response time, performance in condition 1 would be better.
Repeated Measures of ANOVA was mainly used for statistical analyses of the percentage of correct response (accuracy), median search time and integrated performance measure using SPSS 11.5.0 (SPSS, Chicago, IL). In addition, a proportion test method was also used.
3. Results
By all the measures the control group performed substantially and significantly better than the patient group (average of the median search time: 2.3 vs. 9.3 sec; average accuracy: 99% vs. 62%; average integrated performance: 0.81 vs. 0.47; p<0.001). Enhancement did not have a significant effect for the control group (p>0.12). By search time and integrated performance measures, image category was a significant factor (p=0.001) for the control group. By accuracy measure, image category was not significant (p=0.7), as it almost reached 100% for the control group (ceiling effect) with and without enhancement.
All the patients were able to perform the visual search task, but on average they were able to correctly identified about 60% of the targets (Figure 5). Both their search time and accuracy were significantly different across image categories (F2,34>10, p<0.001). Visual search for the face images was the most difficult task, as it took the longest time and yielded the lowest accuracy. Among the 3 image categories, searching in the collection images was the least difficult task. The effect of enhancement was not statistically significant either for search time (F1,18=1.29, p=0.27), or for accuracy (F1,18=0.43, p=0.52). When individual’s differences in search time and accuracy between searching with and without enhancement were examined (Figure 6), it was found that there were many cases where the patients’ performance improved in one measure but declined in another (data points in the upper right and lower left quadrants). In order to avoid ambiguity, further analyses were conducted using the integrated performance measure.
Figure 5.

Search time and percentage of correct response (accuracy) performance of the patient group. Searching Face images seemed to be the most difficult task, and searching Collection images seemed to be the least difficult.
Figure 6.

Differences between search with and without enhancement measured by search time and accuracy. Each data point represents performance difference of one patient for one image category. Points in the two upper quadrants represent improved accuracy, and points in the two left quadrants represent shorter search time. Points in the lower right quadrant represent decrement in performance on both measures.
A Repeated Measure ANOVA was carried out on the integrated performance with VA and age as covariates. Both the VA (F1,16=10.6, p=0.005) and age (F1,16=5.4, p=0.034) had significant effects on the integrated performance. The effect of enhancement was found to be not significant (F1,16=0.95, p=0.34) when all categories included. The image category was significant factor (F2,32=11.4, p<0.001). As Figure 7 shows, enhancement slightly improve search performance for the indoor and collection images, but not for the face images. This suggests that the face image search may be different from the others, as discussed in the discussion section. Excluding the face image category, the effect of enhancement was found to be significant (F1,16=6.1, p=0.025) for the indoor and collection images.
Figure 7.

Integrated search performance of the patient group. There is a trend for enhancement to improve search performance for the indoor and collection images but not for the face images.
The effect of VA was further examined. Figure 8 plots the overall integrated performance (average over all image categories) of each individual patient along with their VA. Patients with better VA had a better search performance; and were more likely to benefit from the enhancement. For patients with VA better than 0.8 LogMAR (6/38, 20/125; subjects S1 to S10), the mean of relative improvement with enhancement was 7%. Linear regression found that VA alone can explain 22% (R2=0.22, p=0.04) of the variability of the integrated performance, and a combination of VA and age can explain 42% (R2=0.42, p=0.01).
Figure 8.

Integrated performance (average over 3 image categories) of each individual patient along with VA. Bars represent individual VA, and they are plotted in order. Black squares represent performance with enhancement, and crosses represent performance without enhancement. Subjects with better VA had better performance, and they were more likely to benefit from enhancement (square above cross).
The proportion of performance improvement was also examined. It was found that 1 out of 19 patients (5%) performed better with enhancement for all three categories; 8 out of 19 (42%) performed better with enhancement for two image categories; and 10 out of 19 (53%) performed better with enhancement for only one image category. No patient performed worse with enhancement for all three categories. Taken together, all patients had improved performance with enhancement for at least one image category. Assuming the enhancement absolutely had no effect, the arbitrary chance we would observe “improved” performance (not real) for at least one image category would be 7 out of 8 (87.5%). A proportion Z-test showed that the 100% we observed in our study is significantly different from the arbitrary chance (p=0.049, one-tailed), indicating that the enhancement indeed improved search performance.
4. Discussion
We have shown that patients with central vision impairment from various diseases and with varying levels of acuity loss were able to perform the natural image search task, although their performance was much worse than that of the normally sighted subjects. Our novel integrated performance measure combines the search time and accuracy measures and provides a comprehensive, unitary measure that allows a greater flexibility of experiment design than using only one single conventional measure (with the other arbitrarily fixed). This and our other ongoing studies show that the natural image search task may be used to evaluate the performance of patients with central vision impairment. This paradigm has more face validity than prior search studies conducted with search objects that are graphically produced and with limited features. Using natural images is particularly important when evaluating the effect of image enhancement technologies including the type of spatial filtering used here or any other enhancement technique which may include magnification effects.22
With a significant difference in search performance for the three different image categories, it is important to consider the nature of the stimuli used when evaluating visual functional performance in visual search. For the indoor and collection images, one may use many clues, such as colour, overall shape, orientation, to find the targets. Searching for faces is more difficult than searching in the indoor and collection images. This finding is not surprising, as face recognition has always been reported as a major difficulty in patients with visual impairment 18, 19 and is a frequent clinical complaint. It was more challenging in our study to find a given face target, especially since some of our face images included rather homogeneous groups of people (see Figure 1). In order to find the target face correctly when coarse visual information, such as the overall colour and shape, are essentially the same, one needs to be able to distinguish the fine details of facial features between people of the same sex, with similar hair styles and facing directions. However, that is what patients with poor visual acuity are unable to do. It seemed that our image processing parameters did not provide sufficient enhancement for the fine details. The enhancement filter was chosen based on our previous preference studies, where patients preferred moderate enhancement and rejected harsher enhancement that caused the images unnatural. 9, 10 Further studies are needed to see if higher enhancement can increase performance of patients with worse visual impairment, even if they may reject the harsh enhancement in the preference evaluation.
Although we did not find a large overall performance improvement with the JPEG image enhancement used here, we did find significant improvement in search performance for some patients and on some image categories. Enhancement significantly improved the integrated performance for indoor and collection images. However, it is unlikely that the small improvement would have any practical value for patients. An interesting finding is that patients with mild to moderate visual impairment (VA between 0.4 to 0.8 logMAR, 6/15 to 6/38, 20/50 to 20/125) are more likely to benefit from the enhancement used here (Figure 8). The finding supports our previous speculation 9 that contrast enhancement may help low vision patients to detect a certain range of frequencies that otherwise they would not be able to see. If these frequencies are critical for object recognition, the enhancement would presumably help with visual search. For higher frequencies, the elevated contrast thresholds in the patients may be so high that they are beyond the improvement that the contrast enhancement can provide. This might also explain why there was a significant improvement for indoor and collection images, but not for face images. Frequencies required for face recognition are higher than that for indoor and collection objects. 23
Based on this understanding, we think that a sound low vision rehabilitation approach may be a combination of magnification and image enhancement. With magnification, the higher spatial retinal frequency range can be shifted to a lower frequency range where the contrast enhancement may become helpful. With enhancement, images may not have to be greatly enlarged, alleviating the problem of loss of field of view inherent in magnification.
Acknowledgments
Supported in part by NIH grants EY05957 and EY016093
We thank Lily Wang for image collection, Matthew Straight for data collection, Akarsha Ramani for processing images.
References
- 1.Congdon N, O’Colmain B, Klaver CC, et al. Causes and prevalence of visual impairment among adults in the United States. Arch Ophthalmol. 2004;122:477–485. doi: 10.1001/archopht.122.4.477. [DOI] [PubMed] [Google Scholar]
- 2.Peli E, Peli T. Image enhancement for the visually impaired. Opt Eng. 1984;23:47–51. [Google Scholar]
- 3.Peli E, Goldstein RB, Young GM, Trempe CL, Buzney SM. Image enhancement for the visually impaired: Simulations and experimental results. Invest Ophthalmol Vis Sci. 1991;32:2337–2350. [PubMed] [Google Scholar]
- 4.Wolffsohn JS, Mukhopadhyay D, Rubinstein M. Image enhancement of real-time television to benefit the visually impaired. Am J Ophthalmol. 2007;144:436–440. doi: 10.1016/j.ajo.2007.05.031. [DOI] [PubMed] [Google Scholar]
- 5.Leat SJ, Mei M. Custom-devised and generic digital enhancement of images for people with maculopathy. Ophthalmic Physiol Opt. 2009;29:1–19. doi: 10.1111/j.1475-1313.2008.00633.x. [DOI] [PubMed] [Google Scholar]
- 6.Woods RL, Satgunam P. Television, computer and portable display device use by people with central vision impairment. Ophthalmic Physiol Opt. 2011;31:258–274. doi: 10.1111/j.1475-1313.2011.00833.x. [DOI] [PMC free article] [PubMed] [Google Scholar]
- 7.Tang J, Kim J, Peli E. Image enhancement in the JPEG domain for people with vision impairment. IEEE Trans Biomed Eng. 2004;51:2013–2023. doi: 10.1109/TBME.2004.834264. [DOI] [PubMed] [Google Scholar]
- 8.Leat SJ, Omoruyi G, Kennedy A, Jernigan E. Generic and customized digital image enhancement filters for the visually impaired. Vision Res. 2005;45:1991–2007. doi: 10.1016/j.visres.2005.01.028. [DOI] [PubMed] [Google Scholar]
- 9.Kim J, Vora A, Peli E. MPEG-based image enhancement for the visually impaired. Opt Eng. 2004;43:1318–1328. [Google Scholar]
- 10.Fullerton M, Woods RL, Vera-Diaz FA, Peli E. Measuring perceived video quality of MPEG enhancement by people with impaired vision. Journal of the Optical Society of America A, Optics, Image Science, and Vision. 2007;24:B174–B187. doi: 10.1364/josaa.24.00b174. [DOI] [PMC free article] [PubMed] [Google Scholar]
- 11.Satgunam P, Woods RL, Bronstad PM, Peli E. Factors affecting image quality preferences. The Society for Information Display International Symposium; Society for Information Display; 2010. pp. 94–97. [Google Scholar]
- 12.Peli E, Fine EM, Pisano K. Video enhancement of text and movies for the visually impaired. In: Kooijman AC, Looijestijn PL, Welling JA, van der Wildt GJ, editors. Low Vision: Research and New Developments in Rehabilitation. Amsterdam: IOS Press; 1994. pp. 191–198. [Google Scholar]
- 13.Mei M, Leat SJ. Quantitative assessment of perceived visibility enhancement with image processing for single face images: a preliminary study. Invest Ophthalmol Vis Sci. 2009;50:4502–4508. doi: 10.1167/iovs.08-3079. [DOI] [PubMed] [Google Scholar]
- 14.Peli E, Lee E, Trempe CL, Buzney S. Image enhancement for the visually impaired: the effects of enhancement on face recognition. Journal of the Optical Society of America A: Optics, Image Science and Vision. 1994;11:1929–1939. doi: 10.1364/josaa.11.001929. [DOI] [PubMed] [Google Scholar]
- 15.Kuyk TK, Liu L, Fuhr PS. Feature search in persons with severe visual impairment. Vision Res. 2005;45:3224–3234. doi: 10.1016/j.visres.2005.07.019. [DOI] [PubMed] [Google Scholar]
- 16.MacKeben M, Fletcher DC. Target search and identification performance in low vision patients. Investigative Ophthalmological & Visual Science. 2011;52:7603–7609. doi: 10.1167/iovs.10-6728. [DOI] [PubMed] [Google Scholar]
- 17.Fullerton M, Woods RL, Vera-Diaz F, Peli E. Vision 2008-The 9th International Conference on Low Vision. Montreal, Canada: International Society for Low-Vision Research and Rehabilitation (ISLRR); 2008. Image contrast enhancement for the visually impaired: new opportunities in the digital age. [Google Scholar]
- 18.Barnes CS, De L’Aune W, Schuchard RA. A test of face discrimination ability in aging and vision loss. Optom Vis Sci. 2011;88:188–199. doi: 10.1097/OPX.0b013e318205a17c. [DOI] [PubMed] [Google Scholar]
- 19.Bullimore MA, Bailey IL, Wacker RT. Face recognition in age-related maculopathy. Invest Ophthamol Vis Sci. 1991;32:2020–2029. [PubMed] [Google Scholar]
- 20.Fullerton M, Peli E. Post-transmission digital video enhancement for people with visual impairments. JSID. 2006;14:15–24. doi: 10.1889/1.2166829. [DOI] [PMC free article] [PubMed] [Google Scholar]
- 21.Smith ND, Crabb DP, Garway-Heath DF. An exploratory study of visual search performance in glaucoma. Ophthalmic & Physiological Optics. 2011;31:225–232. doi: 10.1111/j.1475-1313.2011.00836.x. [DOI] [PubMed] [Google Scholar]
- 22.Luo G, Li Z, Peli E. Mobile electronic magnification device for people with central vision loss (abstract) Invest Ophthalmol Vis Sci. 2011;52:E-Abstract 386. [Google Scholar]
- 23.Kwon M, Legge GE. Spatial-frequency cutoff requirements for pattern recognition in central and peripheral vision. Vision Res. 2011;51:1995–2007. doi: 10.1016/j.visres.2011.06.020. [DOI] [PMC free article] [PubMed] [Google Scholar]