

Abstract
Neuronal activity elicits metabolic and vascular responses, during which oxygen is first consumed and then supplied to the tissue via an increase in cerebral blood flow. Understanding the spatial and temporal dynamics of blood and tissue oxygen ( ) responses following neuronal activity is crucial for understanding the physiological basis of functional neuroimaging signals. However, our knowledge is limited because previous
  measurements have been made at low temporal resolution (>100 ms). Here we recorded
  at high temporal resolution (1 ms), simultaneously with co-localized field potentials, at several cortical depths from the whisker region of the somatosensory cortex in anaesthetized rats and mice. Stimulation of the whiskers produced rapid, laminar-specific changes in
  . Positive
  responses (i.e. increases) were observed in the superficial layers within 50 ms of stimulus onset, faster than previously reported. Negative
  responses (i.e. decreases) were observed in the deeper layers, with maximal amplitude in layer IV, within 40 ms of stimulus onset. The amplitude of the negative, but not the positive,
  response correlated with local field potential amplitude. Disruption of neurovascular coupling, via nitric oxide synthase inhibition, abolished positive
  responses to whisker stimulation in the superficial layers and increased negative
  responses in all layers. Our data show that
  responses occur rapidly following neuronal activity and are laminar dependent.
Keywords: amperometry, barrel cortex, hemodynamic response, local field potential, tissue oxygen
Introduction
Functional magnetic resonance imaging (fMRI) is now the dominant methodology for investigating human brain function but it does not measure neuronal activity directly. Instead, fMRI uses secondary correlates to infer neuronal activity, e.g. the blood-oxygen-level-dependent (BOLD) signal. Understanding the complex processes linking neuronal activity with downstream metabolic and hemodynamic changes is therefore imperative if we are to understand what neuroimaging signals represent and their spatial and temporal limitations.
Measuring neuronal activity concomitantly with BOLD in the scanner presents major technical challenges (Goense et al., 2010). An alternative approach employed by several laboratories is to measure tissue oxygen ( ) as a proxy for BOLD, using the rationale that
  changes are driven by the same physiological mechanisms as changes in the BOLD signal (Thompson et al., 2003; Offenhauser et al., 2005; Masamoto et al., 2008; Lowry et al., 2010). These studies have significantly advanced our knowledge of the neurometabolic and neurovascular mechanisms that underlie BOLD. However, to date,
  has been measured at relatively low temporal resolution (typically > 100 ms per data point), largely for technical reasons. Thus, although neuronal activity takes place within milliseconds, we have no knowledge of
  responses at a millisecond timescale. To address this issue, here we measured
  at high temporal resolution (1 ms) concomitantly with local field potentials (LFPs) in the whisker-barrel pathway of anaesthetized rats and mice.
High temporal resolution  measurements were achieved using constant potential amperometry at uncovered carbon paste electrodes (CPEs). Previous studies have measured
  with gold or platinum electrodes, housed within a protective membrane that prevents electrode deterioration and subsequent loss of oxygen (O2) sensitivity. However, the membrane also increases the diffusion time for O2 to reach the electrode surface and thus limits the temporal resolution (for discussion see Bolger et al., 2011). CPEs do not require this protective membrane and their temporal resolution is limited only by O2 diffusion kinetics (<1 ms).
We have previously used this approach to study hippocampal  responses in freely-moving rats during cognitive and emotional tasks (McHugh et al., 2011) but, because the stimuli (e.g. spatial cues) were not time-locked to the
  recordings, the temporal parameters of the
  response remain unknown. Here we used single electrical pulses or mechanical deflections of the whiskers to elicit neuronal and
  responses in the barrel cortex. The whisker-barrel sensory pathway is an ideal network for this approach because it has a topographical and columnar spatial organization, and well-defined vasculature, such that somatic stimulation produces discrete and reproducible responses within each cortical layer. Moreover, neuronal responses differ between cortical layers, with the earliest firing units and the largest amplitude LFPs found in layer IV (Armstrong-James & Fox, 1987; Di et al., 1990). Here we investigated the laminar specificity of
  responses and LFPs by recording sequentially at multiple depths within the barrel cortex. In addition, we investigated the relationship between the magnitude of LFPs and
  responses by varying the intensity of whisker stimulation. Finally, we investigated the effects of disrupting neurovascular coupling on
  responses by inhibiting neuronal nitric oxide synthase (nNOS) with 7-nitroindazole (7-NI).
Materials and methods
Constant potential amperometry for tissue oxygen
Changes in  were recorded using constant potential amperometry at CPEs as described previously (Lowry et al., 1997; Bolger et al., 2011). In this technique, the CPE is held at a constant potential (−650 mV relative to a reference electrode) using a potentiostat (‘Biostat’; ACM Instruments, Cumbria, UK or Electrochemical and Medical Systems Ltd, Newbury, UK). The application of this potential causes the electrochemical reduction of O2 at the surface of the CPE, which induces an electrical current that is measured by the potentiostat. The availability of O2 for this two-step reaction (O2 + 2H+ + 2e− → H2O2; H2O2 + 2H+ + 2e− → 2H2O) is determined by the local
  concentration. Therefore, when
  increases (e.g. following an increase in cerebral blood flow (CBF) or when there is a decrease in O2 utilization during constant CBF), the current increases linearly, and when
  decreases (e.g. when O2 utilization is greater than CBF, or there is a relative decrease in CBF), the current decreases linearly. In this way, changes in local
  concentration directly produce proportional changes in the amperometric signal (Hitchman, 1978).
Electrode construction
The CPEs were made from 8T (200 μm bare, 270 μm coated diameter; Experiment 1) or 5T (125 μm bare, 177 μm coated diameter; Experiment 2) Teflon®-coated silver wire (Advent Research Materials, Suffolk, UK). The Teflon insulation was slid along the wire to create a 2 mm deep cavity that was packed with carbon paste. The Teflon coating on the CPEs was flush with the tip of the electrode such that the active part of the electrode was a flat disk with diameter 250 μm (area: 0.05 mm2) in Experiment 1 or 125 μm (area: 0.01 mm2) in Experiment 2. The carbon paste was prepared by mixing 2.8 g of carbon powder (Sigma-Aldrich, St Louis, MO, USA, catalogue no. 282863) and 1.0 mL of silicone oil (Sigma-Aldrich, catalogue no. 17563-3) (O’ Neill et al., 1982). LFP electrodes were made from 5T Teflon-coated silver wire. Co-localized LFP and  recordings were achieved by twisting the LFP electrode around the CPE, making a double electrode with the active tips level in the dorsal–ventral plane. The distance between the electrodes in the medial–lateral/anterior–posterior planes was approximately 150 μm. Reference electrodes for the
  recordings were made from 8T Teflon®-coated silver wire. All wire electrodes were soldered to gold connectors (E363/0; Plastics One, Roanoke, VA, USA). Skull screws served as auxiliary electrodes (O2 and LFP circuits) and reference electrodes (LFP circuit).
Electrode calibration
The linear response of CPEs to changes in O2 concentration was confirmed by in vitro calibration, using a three-electrode glass electrochemical cell (BASi C3 cell stand, Bioanalytical Systems, USA ) containing 15 mL phosphate-buffered saline (pH 7.4) with a silver/silver chloride reference electrode and a platinum auxiliary electrode (Bioanalytical Systems). Calibrations were performed in nitrogen (N2)-purged, air-saturated, and O2-saturated solutions with O2 concentrations of 0, 240, and 1200 μm, respectively. Calibration coefficients for each CPE were calculated by plotting a line of best fit through the three data points by least squares linear regression and taking the slope as the coefficient in nA/μm [full details of this procedure can be found in Bolger et al. (2011)]. Mean (±SEM) coefficients were 1.42 (±0.14) nA/μm for the 250 μm diameter CPEs used in Experiment 1 and 0.75 (±0.02) nA/μm for the 125 μm diameter CPEs used in Experiment 2. Raw  signals (in nA) from each CPE were multiplied by their coefficient to produce a calibrated
  signal in μm.
Electrode properties
The characterization of CPEs and constant potential amperometry (at −650 mV) for measuring  has recently been published in detail (Bolger et al., 2011). In summary, the
  signal shows high sensitivity (0.5−1.5 nA/μm), low detection limits (∼0.1 μm) and near-linear responses (r > 0.9) to changes in O2 concentration. In vitro, the
  signal responds rapidly (within 1 s) to changes in O2 concentration and shows low stirring sensitivity (∼3–4%). Moreover, the
  signal is insensitive to changes in pH, temperature, or ionic concentration (Ca2+and Mg2+) within the normal physiological range. The O2 consumption of the electrodes is approximately 1.1 nmol/h, which is small compared with the 40–80 μm O2 concentration in the extracellular fluid (Erecinska & Silver, 2001). The amperometric detection of O2 is based on the electrochemical reduction of O2 and therefore the
  signal is free from interference from oxidizable analytes within the extracellular fluid. Moreover, the
  signal shows negligible interference from other electroactive species present in brain tissue (e.g. ascorbic acid, dopamine, serotonin, homovanillic acid, 5-hydroxyindoleacetic acid, 3,4-dihydroxyphenylacetic acid, l-tyrosine, l-cysteine, l-tryptophan, l-glutathione, dehydroascorbic acid, and uric acid).
Experimental design overview
Two experiments were carried out, one in rats and one in mice. Apart from species, there were several methodological differences between the experiments (Experiment 1 vs. Experiment 2): sex (male vs. female), anaesthetic (urethane vs. halothane), method of ventilation (spontaneous breathing vs. artificial ventilation), angle of electrode penetration into cortex (vertical vs. perpendicular to cortex), CPE active surface diameter (250 vs. 125 μm), and method of whisker stimulation (electrical pulse to whisker pad vs. mechanical deflection of whiskers). The objective of both experiments was the same, i.e. to investigate the laminar specificity of  and neuronal responses in the somatosensory cortex at high temporal resolution. The same pattern of results was observed in both experiments, despite these methodological differences, testifying to the generality of the data.
Subjects
Experiment 1 used seven adult male Sprague-Dawley rats (280–350 g at the time of surgery) and Experiment 2 used 11 adult female C57/BL6 mice (17–30 g at the time of surgery). All procedures were performed in accordance with the UK Animals (Scientific Procedures) Act 1986.
Surgery
Experiment 1
Rats were anaesthetized with 1.5 mL 25% urethane solution (∼2 g/kg, i.p.) and placed in a stereotaxic frame with the head level between bregma and lambda. Lack of withdrawal reflexes was tested throughout the experiment and additional doses of urethane were given if necessary to ensure a stable level of anaesthesia. The temperature of the animal was maintained at 37 °C using a rectal probe and a thermostatically-controlled heating blanket (Harvard Apparatus, MA, USA). An incision was made in the scalp and the periosteum resected. Five holes were drilled in the skull and the underlying dura was pierced with a hypodermic needle. One hole allowed the insertion of a double LFP/CPE into the somatosensory cortex (anterior-posterior: −2.5 mm; medial-lateral: +5.5 mm from bregma). LFP and  responses were investigated at several cortical depths from 0 mm (cortical surface) to 2 mm below the cortical surface. A second hole drilled into the contralateral hemisphere (approximate anterior-posterior: −2.0 mm; medial-lateral: +3.0 mm from bregma) allowed insertion of the
  reference electrode into the cortex. Skull screws were inserted into the remaining holes to act as an auxiliary electrode for the
  circuit and as reference and auxiliary electrodes for the LFP circuit. Rats were breathing spontaneously during surgery and all subsequent recording.
Experiment 2
Mice were first anaesthetized using Hypnorm/Hypnovel (10 μL/g, i.p.; Hypnorm; Janssen Pharmaceutica: fentanyl citrate 0.315 mg/mL; fluanisone 10 mg/mL, Hypnovel; Roche: midazolam 5 mg/mL) and local anaesthetic was then applied to the throat (EMLA cream; APP Pharmaceuticals, 5% emulsion containing 2.5% each of lidocaine and prilocaine) and a tracheotomy was performed. The mice were then connected to a ventilator (Mini Vent Type 845; Hugo Sachs Elektronik, Germany) with the respiration set at 130 strokes/min and 175 μL/stroke. Anaesthesia was maintained using halothane (1.5–2%) in a mixture of O2 and NO2. The mouse was then placed in a stereotaxic frame with the head level between bregma and lambda, an incision was made in the scalp and the periosteum resected. A hole was drilled into the skull to allow the insertion of a double LFP/CPE into the somatosensory cortex (AP: −1.5 mm; ML: −3.0 mm from bregma). The centre of this craniotomy was over the whisker barrel cortex corresponding to the D2 whisker region. LFP and  responses were investigated at five cortical depths from 0.05 mm (layer I) to 0.85 mm (layer VI) below the cortical surface in 0.2 mm steps. A second hole was drilled in the contralateral hemisphere to allow insertion of the reference electrode (approx AP: −1.0 mm; ML: +1.5 mm from bregma). An auxiliary electrode was placed in the scalp. During stereotaxic surgery and subsequent recordings, the heart rate was monitored via two electrocardiogram wires inserted into the armpits and connected to a Cardiotachometer (CT 100; CWE Inc., PA, USA); end tidal CO2 was also monitored (Micro Cap Star CO2 analyzer; CWE Inc.) and typically maintained at ∼4% during recordings. Throughout the experiment, body temperature was thermostatically controlled at 37 °C. Mice were artificially ventilated throughout stereotaxic surgery and during all subsequent recordings.
Data recording
In both experiments, LFP electrodes were connected to a differential amplifier (Harvard Apparatus) and the signal was sent to an analogue/digital converter (Micro 1401; CED, Cambridge, UK) and onto a PC running either Signal 2.10 (Experiment 1) or Spike2 (Experiment 2) software (CED). LFPs were recorded at 15 kHz (Experiment 1) or 5 kHz (Experiment 2).  measurements were made using the potentiostat, which contained a custom-built pre-amplifier. The output of the potentiostat was connected to an analogue/digital converter (Experiment 1: Powerlab 8/30, AD Instruments, Oxon, UK; Experiment 2: Micro 1401; CED) and then onto a PC running digital acquisition software (Experiment 1: Chart v5, AD Instruments; Experiment 2: Spike2; CED).
  responses were recorded continuously at 1 kHz (Experiment 1) or 5 kHz (Experiment 2).
  and LFP data were downsampled to 1 kHz for analysis. Once electrodes were implanted into the brain, the potential (−650 mV) was applied and the CPEs were left to settle for 30 min before any experiments began.
Whisker stimulation
In Experiment 1, electrical stimulation of the rat whisker pad was used to elicit LFPs and  responses. Two needle electrodes were attached to a stimulator (Isolated Pulse Stimulator; A-M Systems, USA) and placed 2 mm subcutaneously in a posterior direction between rows A/B and C/D of the whisker pad, contralateral to the barrel cortex recording site. Square-wave pulse stimulations of 0.3 ms duration were administered every 10 s. The timing and intensity of stimuli were controlled by Signal 2.10 software via the Micro 1401 analogue/digital converter (CED). In Experiment 2, mechanical stimulation of the whiskers was used to elicit neuronal and
  responses. Approximately 10 whiskers, surrounding the D2 whisker, were inserted into a small metal cannula that was attached to a piezo-electric wafer (multilayer piezo bender actuator, model PL140.11, Physik Instrumente, Germany). Applying a voltage (using the piezo driver, E-650; Physik Instrumente) caused a deformation of the wafer that, in turn, produced a controlled movement of the cannula and hence the whiskers. Sinusoidal pulse stimulations of 20 ms duration were administered every 1 s and were controlled by Spike2 v5 software via the Micro 1401 analogue/digital converter (CED).
Procedures
In vitro and in vivo control experiments
Control experiments were performed to demonstrate (i) that the  signal was free from electrical interference and (ii) that it detected changes in O2 availability.
First, the susceptibility of the  signal to changes in electrical potential was investigated in vitro using a three-electrode electrochemical cell (Bioanalytical Systems) containing 15 mL phosphate-buffered saline (pH 7.4) with a Ag/AgCl reference electrode, a Pt auxiliary electrode, and a CPE for O2 detection. The polarizing potential (−650 mV) was applied to the CPE and the phosphate-buffered saline was bubbled with air (∼20% O2) to establish a baseline O2 signal. Changes in
  (Δ
(Δ ) were measured with reference to this baseline. Trains of electrical stimuli (1–100 Hz, +5 V, 0.5 ms) were then administered via a bipolar stimulating electrode placed into the phosphate-buffered saline to simulate electrical neuronal activity. This stimulation protocol was performed six times. Electrical stimulation of the cell had no effect on the
  signal (Supporting Information Fig. S1). Therefore, as this level of stimulation is more than an order of magnitude greater than that typically seen in vivo, it is extremely unlikely that changes in electrical potential within the brain tissue affected the
  signals in the whisker stimulation experiments described below.
The second control experiment investigated the sensitivity of the  signal to changes in O2 availability and was performed in anaesthetized rats. With the
  electrodes positioned in the barrel cortex, mild hyperoxia and hypoxia were induced by applying gaseous O2 (BOC Medical, Manchester, UK) or N2 (BOC Gases, Guildford, UK), respectively, to the snout of the anaesthetized rats. Polyurethane tubing, connected to the appropriate gas cylinder, was held approximately 2 cm from the snout and the gas delivered for either 60 s (O2) or 30 s (N2) at a flow rate of ∼1 L/min. O2 inhalation increased the
  signal by 33.0 ± 12.0 μm after 30 s (61.7 ± 18.2 μm after 60 s), whereas N2 inhalation decreased the
  signal by 16.2 ± 3.1 μm after 30 s (Fig. 1). A paired t-test revealed that the
  signal was significantly higher after O2 than N2 inhalation [n = 6 rats; t(5) = 3.3; P = 0.02]. This demonstrates that the
  signal is highly sensitive to changes in O2 availability in vivo.
Fig. 1.
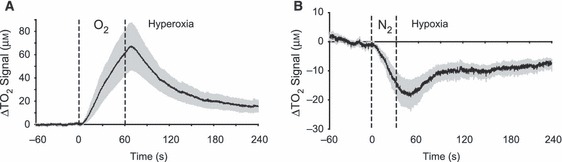
CPEs recording the partial pressure of  in the whisker-barrel region of the somatosensory cortex respond to changes in systemic O2 availability in vivo (n = 6 rats). The black line shows the mean
  and the grey line shows ±SEM. (A) Inhalation of O2 (hyperoxia) increased the
  signal. (B) Inhalation of N2 (hypoxia) decreased the
  signal.
Whisker stimulation experiments
Experiment 1
Depth profile
To investigate the laminar specificity of LFP and  responses, we created a depth profile by recording sequentially at 10 cortical depths. The order was counterbalanced such that, in some animals, recordings were made at the dorsal-most site first and in others at the ventral-most site first. Using the arm of the stereotaxic frame, the dual CPE/LFP electrode was carefully lowered/raised in 0.2 mm steps from 0 mm (brain surface) to 1.8 mm below the brain surface (n = 3), or from −1.8 to 0 mm (n = 4), with 10 stimulations given at each depth (1.2 mA, 0.3 ms pulses). Note that, as the Teflon coating was flush with the electrode tip, the active surface of the CPE was entirely within brain tissue even at 0 mm. Electrode penetrations were made such that the electrodes entered the brain at a vertical angle (see Fig. 2). Due to this angle, we estimated the most ventral recording site (1.8 mm below the brain surface) to be in layer V.
Fig. 2.
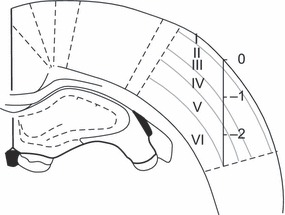
Reconstruction of recording sites in rat whisker barrel cortex (Experiment 1) showing the vertical angle of electrode insertion. Recordings were made at 10 depths from 0 mm (cortical surface) to −1.8 mm (approximately layer V). The scale bar is in mm. [Figure adapted with permission from Elsevier. The figure was published in The Rat Brain in Stereotaxic Coordinates, Paxinos, G. & Watson, C., ©Academic Press (1998)].
Effects of stimulus intensity on local field potential and tissue O2 responses
The depth profile was used to determine the site of maximum LFP amplitude, which, based on previous studies (Di et al., 1990), we assumed to be in layer IV. LFP and  responses were then recorded to a range of stimulus intensities (0.5–3.0 mA in 0.5 mA steps; 0.3 ms pulses in all cases) with the electrodes fixed in the same position in the cortex throughout (i.e. layer IV). Ten stimulations were given at each intensity level.
Effects of local anaesthetic into ipsilateral or contralateral whisker pad
To demonstrate that  responses (and LFPs) were due to neuronal transmission in the whisker-barrel pathway and not a stimulation or other electrical artefact, local anaesthetic was injected into either the ipsilateral or contralateral whisker pad. If
  responses were caused by a stimulation artefact, then injection into either the ipsilateral or contralateral whisker pad should have no effect. However, if
  responses are dependent upon neuronal transmission then contralateral injections should reduce
  responses (and LFPs), whereas ipsilateral injections should have little effect because of decussation of the sensory pathway. With the electrodes positioned in layer IV (based on the maximum evoked LFP amplitude), we established a pre-injection baseline for LFP and
  responses by giving 10 whisker stimulations (1.2 mA, 0.3 ms). Lignocaine hydrochloride (1%; 10 mg in 1 mL 0.9% NaCl) was then injected (0.1 mL, SC) into the ipsilateral whisker pad and 10 stimulations were administered. A second lignocaine injection was then made into the contralateral whisker pad followed by 10 whisker stimulations.
Effects of sustained whisker stimulation
To investigate the effect of sustained stimulation, we applied a 10 Hz train to the whisker pad for 40 s, with the electrodes positioned in layer IV. (Note that this procedure was performed before the local anaesthetic injection).
Experiment 2
The primary aims of Experiment 2 were to (i) replicate the findings of Experiment 1 in a different species and with mechanical movements of the whiskers rather than electrical stimulation; and (ii) investigate whether the rapid positive  responses seen in the superficial layers during Experiment 1 were affected by disrupting neurovascular coupling. To achieve aim (ii), a subset of mice (n = 4) were injected with 7-NI (50 mg/kg, i.p.; Sigma-Aldrich, catalogue no. N7778; 5 mg/mL in peanut oil vehicle, Sigma-Aldrich, catalogue no. P2144) approximately 45 min before recording began. Previous studies have shown that this dose of 7-NI reduces stimulus-evoked CBF by 50–70% without reducing the field potential amplitude (Iadecola et al., 1996; Yang et al., 1999, 2000). The drug was sonicated in vehicle for 5 min immediately before injection. Three mice were injected with vehicle only (0.2–0.3 mL peanut oil) and four mice served as uninjected controls. There were no differences between the vehicle and uninjected groups in LFP amplitudes [t5 = 1.4; P = 0.19] or
  amplitudes [t5 = 1.4, P = 0.22] and they were combined into a single control group.
Depth profile
The LFP and  responses were investigated in 7-NI-treated and control mice at five cortical depths in the barrel cortex (0.05, 0.25, 0.45, 0.65, and 0.85 mm below the brain surface), corresponding to layers I, II/III, IV, V, and VI, respectively. Note that in Experiment 2 the stereotaxic arm was positioned at an angle such that the electrodes penetrated perpendicular to the cortical surface (see Fig. 3). The dual CPE/LFP electrode was carefully lowered from layer I (0.05 mm) to layer VI (0.85 mm) in 0.2 mm steps (control group, n = 3; 7-NI group, n = 2) or raised from layer VI (0.85 mm) to layer I (0.05 mm) in 0.2 mm steps (control group, n = 4; 7-NI group, n = 2). One hundred stimulations were administered at each depth. During recording, the preparation was insulated with silicon oil (Sigma).
Fig. 3.
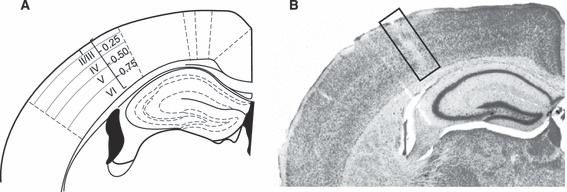
Reconstruction (A) and representative photomicrograph (B) showing recording positions from the mouse barrel cortex (Experiment 2). Note that the angle of electrode insertion is perpendicular to the cortical lamina. Recordings were made at five depths, corresponding to layers I, II/III, IV, V, and VI. The scale bar is in mm. [Figure adapted with permission from Elsevier. The figure was published in The Mouse Brain in Stereotaxic Coordinates, Paxinos, G. & Franklin, K.B.J., ©Academic Press (2001)].
Perfusion and histology
After the experiment, a subset of mice from Experiment 2 were perfused for histological determination of the electrode placements (Fig. 3). Mice were injected with 0.1 mL of pentobarbital (Euthatal, 200 mg/mL) and perfused transcardially with physiological saline (0.9% NaCl) and then formol–saline (10% formalin in 0.9% NaCl). The brains were removed and preserved in formol–saline. They were then transferred to a 30% sucrose–formalin solution for 24 h and frozen. Coronal sections (50 μm) were cut on a freezing microtome and stained with cresyl violet to enable visualization of the electrode tracks.
Signal processing and analysis
This study was primarily concerned with rapid and transient responses, and our analyses are therefore mostly restricted to  signals and LFPs occurring within the first 1 s after stimulus onset. Stimulus-induced changes to single pulses or deflections were typically not observed beyond 1 s (see Fig. 4). Stimulus-induced LFP and
  responses were calculated as the mean response for 10 stimulations in Experiment 1 (i.e. at each cortical depth, stimulus intensity, or injection condition) or 100 stimulations in Experiment 2 (i.e. at each cortical depth). Changes in
  (Δ
(Δ ) were calculated by subtracting a baseline (the mean
  signal in the 50 ms before stimulus onset) from the stimulus-induced
  signals.
Fig. 4.
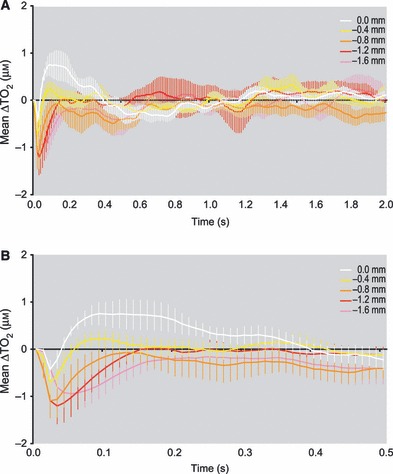
Mean (±SEM)  responses at five cortical depths in response to electrical stimulation of the whisker pad (1.2 mA, 0.3 ms) in rats (n = 7). (A) There was no evidence of stimulus-induced changes in
  beyond the first 1 s after stimulus onset. (B) Same data as in A but showing
  responses during 0.5 s after stimulus onset.
Local field potential metrics
The LFP amplitude was calculated as the maximum-to-minimum value occurring 4–50 ms (Experiment 1) or 4–100 ms (Experiment 2) after stimulus onset (i.e. LFP amplitude = |maximum amplitude–minimum amplitude|). The difference in time windows for the two experiments reflected the different LFPs elicited by electrical (Experiment 1) and mechanical (Experiment 2) stimulation. The slope (b) of the LFP was calculated as the least squares linear regression through y-values occurring 4–9 ms after stimulus onset, where y = bx + a.
Tissue O2 metrics
For  responses we calculated maximum-to-minimum amplitude (|maximum amplitude–minimum amplitude|), maximum amplitude (i.e. for positive
  responses), and minimum amplitude (i.e. for negative
  responses) occurring within the 100 ms after stimulus onset. The slope (b) of the
  response was calculated as the least squares linear regression through y-values occurring 0–20 ms after stimulus onset. When negative, the slope of the
  response gave a measure of the rate of O2 decrease in the tissue (e.g. from increased utilization or decreased CBF). Positive and negative areas under the curve (AUCs) for
  responses were calculated separately and gave measures of cumulative increases in
  (positive AUC) or decreases in
  (negative AUC) over time. This measure is useful because
  responses exhibit inter-subject variability in their precise temporal kinetics and timepoint-to-timepoint averaging can obscure important differences that are captured by AUC. The time windows for AUC were 0–200 ms (Experiment 1), 0–500 or 0–900 ms (Experiment 2), where 0 ms denotes stimulus onset. These time windows were chosen based on the duration of positive and negative
  responses in the two experiments. AUCs were calculated using the trapezoidal method in Prism v4 (Graphpad Software, CA, USA), which treats a timeseries curve as a series of connected XY points that form trapeziums with width ΔX (i.e. a timebin) and heights Y1 and Y2, with area ΔX × ½ (Y1 + Y2). The onset latency of
  responses was defined as a signal change greater than two SDs of baseline fluctuations (i.e. during the 50 ms pre-stimulus period) that was sustained for at least 5 ms. Positive (i.e. above baseline) and negative (i.e. below baseline)
  onset latencies were determined separately for each cortical depth (note that not all rats had both positive and negative responses above baseline at every cortical depth). To compare the temporal characteristics of
  and LFP responses, we also calculated the time-to-peak (e.g. negative peak) amplitude for each signal.
Statistical analyses
Statistical analyses were performed in SPSS (IL, USA) or SigmaStat (SPSS) using paired t-tests, Pearson correlation (r), or anova using a general linear model (presented in the form [Ak × Bm × Sn] where A is a factor with k levels, B is a factor with m levels and n is the number of subjects in the analysis). Post-hoc tests were performed using the Newman–Keuls or least significant difference method. Data are presented as arithmetic mean ± 1 SEM, unless otherwise stated. For clarity, error bars have been omitted from some figures.
Results
Experiment 1: laminar tissue O2 and local field potential responses in rat whisker barrel cortex
Local field potentials and tissue O2 responses are laminar specific
The LFPs and  responses were measured at 10 depths in the rat barrel cortex in response to whisker pad stimulation. LFPs were reproducible within a given cortical lamina but varied between laminae (Fig. 5A, red traces). LFPs exhibited a depth profile consistent with that of previous studies (Di et al., 1990). At the cortical surface, the LFP consisted of a fast positive/negative complex. At progressively deeper penetrations, the early positive component reduced in amplitude and the negative component came earlier and increased in amplitude. The largest amplitude negative deflections were observed at 1.2 ± 0.1 mm below the brain surface, which we estimate to be in layer IV, with a peak negative value at 12.1 ± 1.2 ms after stimulus onset. The amplitude of the negative deflection was reduced at recording sites ventral to 1.2 mm.
Fig. 5.
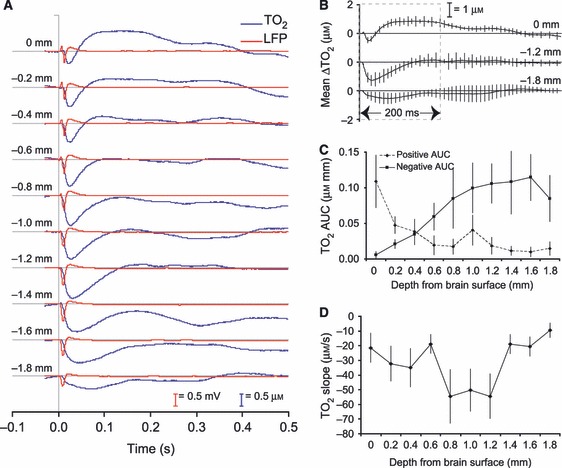
Depth profile of LFP and  responses in the rat whisker barrel cortex (n = 7 rats) following electrical stimulation of the whisker pad (1.2 mA, 0.3 ms). (A) Mean LFP (red trace) and
  (blue trace) responses at 10 cortical depths (0 to −1.8 mm below the cortical surface) for 30 ms before and 500 ms after stimulus onset. (B) Mean (±SEM)
  responses at 0, −1.2 and −1.8 mm below the brain surface (same data as blue traces in A). (C) Mean (±SEM) positive and negative AUCs for
  responses (0–200 ms after stimulus onset). (D). Mean (±SEM) slope of
  responses (0–20 ms after stimulus onset).
The  responses were also laminar specific but had different shapes and temporal dynamics compared with LFPs recorded at the same depth (Fig. 5A, blue traces). At the cortical surface (0 mm), there was a small initial decrease in
  that was followed by a much larger overshoot above baseline (Fig. 5A,B, top trace). In most cases, the overshoot in
  was clearly evident within 100 ms after stimulus onset and was consistently observed only in the superficial recording sites (from 0 to 0.4 mm below the brain surface, i.e. in layer I and layer II/III). At more ventral cortical depths, the
  decrease became larger in amplitude (and slope), reaching a maximum at 1.2 mm below the brain surface (i.e. at the same site as the largest amplitude LFPs, in layer IV). The
  responses at this depth exhibited a negative peak at 32.7 ± 4.0 ms after stimulus onset, followed by a rapid return to baseline with little subsequent overshoot (see Fig. 5A). When the electrodes were positioned ventral to 1.2 mm, the amplitude (and slope) of the initial
  decrease became smaller, and the return to baseline became slower, but with no consistent overshoot above baseline.
To analyse the laminar differences in the  response, we calculated positive and negative AUCs for each cortical depth (Fig. 5C). Separate repeated-measures anovas were performed on the positive and negative AUCs with depth as the within-subjects factor (anova: cortical depth10 × S7). There was a significant effect of cortical depth on the positive AUC (F9,54 = 4.3; P < 0.001), with the largest positive AUC in the superficial layers. There was also a significant effect of cortical depth on the negative AUC (F9,54 = 3.7; P < 0.001), which was greatest in the deeper layers (Fig. 5C). Thus, the timecourse, magnitude, and direction of
  responses were dependent on the cortical depth of the
  electrode. We performed a further anova on the effect of cortical depth on the slope of the
  response, which revealed a significant effect of cortical depth (F9,54 = 5.4; P < 0.001), with steeper (negative) gradients at recording sites 0.8–1.2 mm below the brain surface, i.e. around the same depth that the maximum LFPs were recorded (Fig. 5D). Thus, the rate of O2 consumption was greatest at the site of maximum neuronal activity and decreased markedly outside this region.
Positive and negative tissue O2 onset latencies differ between cortical lamina
The  onset latencies (i.e. signal change greater than two SDs of baseline fluctuations) for five of the 10 depths are shown in Fig. 6A (positive
  latency) and B (negative
  latency). Positive
  latencies were lowest at the cortical surface (36 ± 6 ms at 0 mm) and higher and more variable at deeper sites (e.g. 310 ± 123 ms at 1.6 mm). Negative
  latencies were lowest in layer IV (8 ± 1 ms at 1.2 mm) and highest at the cortical surface (e.g. 14 ± 0.3 ms at 0 mm). Positive and negative
  onset latencies were analysed in separate repeated-measures anovas (anova: cortical depth5 × S7). There was a main effect of cortical depth for positive
  latencies (F4,15 = 4.5; P = 0.01), driven by the low-onset latency at 0 mm and the high-onset latency at 1.6 mm. There was also a main effect of cortical depth for negative
  latencies (F4,18 = 4.8; P = 0.008), driven by the low-onset latency at 1.2 mm and the higher latencies at 0 and 1.6 mm. Thus, both positive and negative
  latencies differed between cortical layers.
Fig. 6.
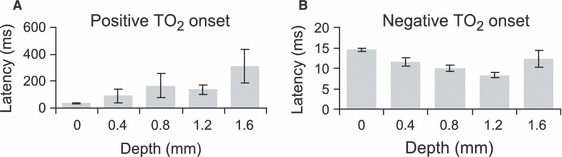
 onset latencies (i.e. signal change greater than two SDs of baseline fluctuations) in the rat whisker barrel cortex for five of the 10 recording depths. Onset times for (A) positive and (B) negative
  responses.
Correlations between local field potential and tissue O2 responses
We investigated the predictive relationship between the LFP and  responses in two ways. First, we plotted LFP amplitude against
  amplitude for responses recorded during the depth profile (Fig. 7). Second, we generated input–output curves for LFP and
  responses to a range of stimulus intensities (0–3 mA in 0.5 mA steps) when the electrodes were positioned in layer IV, and then plotted LFP amplitude against the amplitude of the
  decrease (Fig. 8).
Fig. 7.
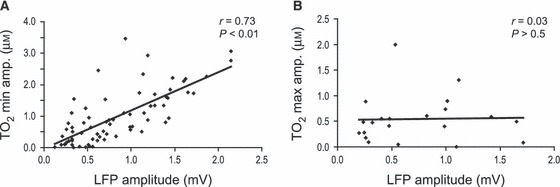
Depth profile. Relationship between LFP amplitude and  amplitude in the rat whisker barrel cortex (n = 7 rats). (A) Correlation between LFP amplitude and minimum (i.e. negative)
  amplitude (all depths, n = 70 observations). (B) Correlation between LFP amplitude and maximum (i.e. positive)
  amplitude from the three most superficial cortical recording sites (i.e. where positive
  responses were consistently seen, n = 21 observations). In all cases, responses were evoked by electrical stimulation of the whisker pad (1.2 mA, 0.3 ms).
Fig. 8.
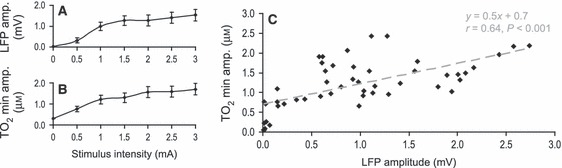
Effects of stimulus intensity on LFP and  amplitude in layer IV. Input–output curves showing the effects of varying stimulus intensity (0–3 mA, 0.3 ms) on LFP amplitude (A) and the amplitude of the
  decrease (B). The correlation between LFP amplitude and negative
  amplitude is shown in C, with the linear fit in grey (n = 7 rats, 49 pairs of observations).
Negative but not positive tissue O2 response amplitude correlates with local field potential amplitude
For responses recorded during the depth profile, the linear correlation between LFP and  amplitudes for individual rats ranged from r = 0.44 to r = 0.91 (mean r = 0.67 ± 0.06). When data were combined across animals and the 10 cortical depths (n = 7 rats, n = 70 pairs of observations) there was a significant correlation between LFP amplitude and total (i.e. maximum to minimum)
  amplitude [r = 0.65; t68 = 7.1, P < 0.001] but the correlation was stronger for LFP amplitude vs. minimum
  amplitude [i.e.
  decrease, r = 0.73; t68 = 8.8, P < 0.001; Fig. 7A]. In contrast, there was no significant correlation between LFP amplitude and maximum
  amplitude (i.e.
  overshoot) when considering responses from the three depths (0, 0.2, 0.4 mm) that showed consistent positive
  responses [r = 0.03; t19 = 0.1, P = 0.9; Fig. 7B].
Local field potential amplitude predicts negative tissue O2 amplitude in layer IV
With the electrodes positioned in layer IV, higher stimulus intensities elicited larger amplitude LFPs (predominantly the negative component) and larger amplitude  decreases (Fig. 8). Linear correlations between LFP amplitude and negative
  amplitudes for individual rats ranged from r = 0.67 to r = 0.98 (mean r = 0.87 ± 0.04). When data were combined across animals and across the seven stimulus intensities (n = 7 rats, n = 49 pairs of observations), there was a significant linear correlation [r = 0.64; t(47) = 5.7; P < 0.001]. These data and the correlational data from the depth profile suggest that, when evoked by single pulses, LFP amplitude is a good predictor of the size of negative but not positive
  amplitude.
Tissue O2 response is not due to stimulation or recording artefact
The short latency of detectable negative and (especially) positive  responses has, to our knowledge, never been reported before. It is important therefore to consider any methodological factors that could have influenced our results. First, could
  signals reflect a stimulation artefact or some other type of electrical interference from the recording equipment? This would seem unlikely because of the laminar differences in
  responses (i.e. if it is an artefact then it is not a uniform artefact) but we also addressed this possibility with a pharmacological manipulation. We injected local anaesthetic (lignocaine) into the whisker pads either ipsilateral or contralateral to the hemisphere containing the recording electrodes (which were positioned in layer IV). If the
  response was a stimulation (or equipment interference) artefact then injection into either whisker pad should have little or no effect as stimulation and recording parameters remained constant. Alternatively, if the
  response depends upon neuronal transmission in the whisker-barrel pathway, then ipsilateral injection should have little or no effect but contralateral injection should reduce
  responses (and LFPs).
Consistent with the second hypothesis, ipsilateral lignocaine had little effect but contralateral lignocaine dramatically reduced the slope and amplitude of  responses and the LFP (Fig. 9). Separate analyses were performed on the LFP and
  slopes and amplitudes [anova: injection condition (baseline, contralateral lignocaine, ipsilateral lignocaine)3 × S5]. There were significant effects of injection condition on the LFP slope (F2,8 = 13.0; P = 0.003) and LFP amplitude (F2,8 = 10.7; P = 0.005), which were lower in the contralateral condition compared with both pre-injection baseline (slope: P = 0.008; amplitude P = 0.01) and ipsilateral (slope: P = 0.04; amplitude P = 0.05) conditions. There were no differences between the ipsilateral and baseline conditions for LFP slope (P = 0.3) or LFP amplitude (P = 0.4). Similarly, there were effects of injection condition on the
  slope (F2,8 = 13.5; P < 0.003) and
  amplitude (F2,8 = 10.3; P = 0.006), which were lower in the contralateral condition compared with both baseline (slope: P = 0.01; amplitude: P = 0.02) and ipsilateral (slope: P = 0.02; amplitude: P = 0.04) conditions. There were no differences between the ipsilateral and baseline conditions for
  slope (P = 0.4) or
  amplitude (P = 0.7). These results demonstrate that the observed
  responses (and LFPs) were dependent on neuronal transmission within the whisker-barrel pathway and that
  signals are not due to a stimulation artefact or electrical interference from the recording equipment.
Fig. 9.
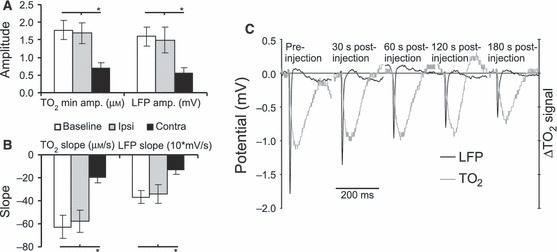
Effects of lignocaine injection (1%, 0.1 mL in 0.9% NaCl) into the rat whisker pad (n = 5 rats) on whisker-stimulation-evoked LFP and  responses in layer IV. Contralateral but not ipsilateral lignocaine reduced
  and LFP amplitude (A) and slope (B). In all cases, responses were evoked by electrical stimulation of the whisker pad (1.2 mA, 0.3 ms). *P < 0.05. (C) Gradual reduction in stimulus-evoked LFP and
  amplitude and slope following lignocaine injection into the contralateral whisker pad (representative example from one rat).
Is the tissue O2 response contaminated by the local field potential?
Another possibility is that the  response is contaminated by, or simply reflects, the (electrical) neuronal activity inherent in the LFP. This would seem unlikely given the control experiment presented in the Materials and methods (see Supporting Information Fig. S1), where the
  signal was unaffected by electrical activity in vitro, and also because the temporal dynamics (and shapes) of LFP and
  responses were quite different. For example, in the superficial layers, the LFP exhibited a positive–negative complex that reversed in polarity in the deeper layers to a negative–positive complex. In contrast, in all layers, the
  response was first negative (i.e. below baseline) and then positive (returning to or overshooting baseline; see Fig. 5). In addition, as reported earlier, the correlation between maximum-to-minimum LFP amplitude and minimum
  amplitude was higher than the correlation between maximum-to-minimum LFP and maximum-to-minimum
  amplitude (r = 0.73 vs. r = 0.65). If the early
  signal was a function of the LFP then one would expect a stronger correlation between the total amplitudes of the respective signals.
Time-to-peak measures in local field potential and tissue O2 response are negatively correlated
In addition, if the  signal reflected the electrical activity of the LFP, one would expect the time-to-peak (e.g. minimum peak) values for the LFP and
  to be positively correlated. However, time-to-minimum LFP amplitude was negatively correlated with time-to-minimum
  amplitude (mean for individual rats: r = −0.6 ± 0.1; range: r = −0.2 to r = −0.9). This is because there was a negative correlation between LFP latency and LFP amplitude (i.e. shorter latency LFPs tended to be higher amplitude; mean correlation between LFP amplitude and LFP time-to-minimum: r = −0.6 ± 0.2), and LFP amplitude was positively correlated with minimum
  amplitude (Fig. 7A). In contrast, shorter latency time-to-minimum
  responses tended to have smaller negative
  amplitude (mean correlation between minimum
  amplitude and time-to-minimum
  amplitude: r = −0.3 ± 0.2). In other words, as the negative peak of the LFP came earlier, the negative peak of the
  response came later. It is difficult to see how, if the
  signal was simply a downsampled, filtered or skewed function of the electrical activity of the LFP, the time-to-peak latencies of the two signals could be negatively correlated. Thus, a methodological explanation for the rapid
  responses observed in Experiment 1 does not seem tenable.
Sustained stimulation leads to positive tissue O2 response
To investigate  responses to sustained stimulation, we applied electrical stimulation to the whisker pad at 10 Hz for 40 s when the electrodes were positioned in layer IV (n = 5 rats). This elicited a substantial
  increase (Fig. 10A) lasting tens of seconds, although the response to individual stimuli of the train (e.g. during the first 1 s) was a
  decrease (Fig. 10B) similar to that observed to single electrical pulses (cf. Fig. 5,
  responses at −1.2 mm). Thus, sustained stimulation produced a characteristically slower-onset but positive
  response, replicating the late-phase
  kinetics shown in previous studies (e.g. Offenhauser et al., 2005).
Fig. 10.
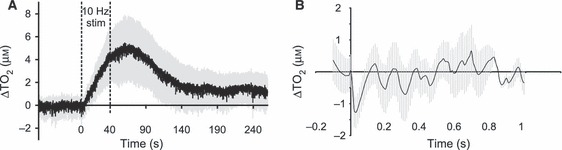
(A) Continuous whisker stimulation (10 Hz, 40 s) in layer IV elicited a slower onset and sustained  increase in layer IV of the rat barrel cortex. (B) Responses to individual whisker stimulations in the first 1 s of the stimulus train showed a decrease in
  (mean
(mean  signal in black, SEM in grey; n = 5 rats).
Experiment 2: laminar tissue O2 and local field potential responses in control mice vs. mice treated with nitric oxide synthase inhibitor (7-nitroindazole)
Experiment 2 had two objectives: (i) to see if the short latency  responses seen in rats in Experiment 1 were also present in mice; and (ii) if so, to see if
  responses were affected by systemic disruption of neurovascular coupling via inhibition of nNOS. To this end, we generated depth profiles for LFP and
  responses in the barrel cortex to whisker deflections in control mice (uninjected, n = 4; vehicle, n = 3, Fig. 11A) and mice treated with the nNOS inhibitor, 7-NI (n = 4, Fig. 11B).
Fig. 11.
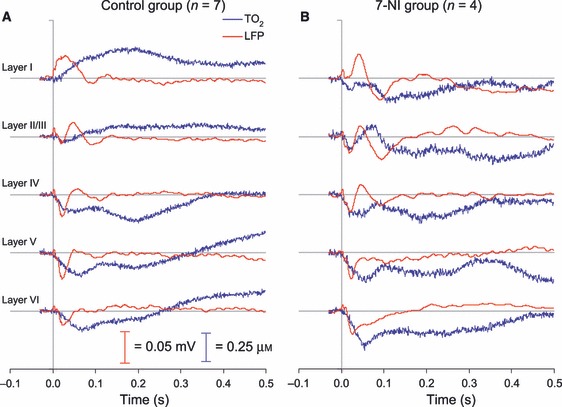
Depth profile of LFP and  responses from the mouse whisker barrel cortex following whisker stimulation in control mice (A, n = 7) and mice treated with the nNOS inhibitor, 7-NI (B, n = 4). Recordings were made at five depths, corresponding approximately to layers I, II/III, IV, V, and VI. Mean LFPs are shown in red; mean
  responses are shown in blue. In all cases, responses were evoked by mechanical whisker deflection (20 ms sinusoidal pulse applied to piezo-electric wafer producing a controlled movement of a cannula containing ∼10 whiskers).
No effect of 7-nitroindazole on local field potentials
The LFPs showed similar laminar profiles in controls and 7-NI-treated mice. In layer I (0.05 mm), the LFP was characterized by a positive–negative complex, which reversed in layer II/III (0.25 mm) to a negative–positive complex, and which was largely negative in the deeper layers. The largest amplitude negative deflection was recorded in layer IV (0.45 mm), with a peak negative value at 25.4 ± 2.1 ms after stimulus onset. LFPs were similar in the 7-NI-treated and control mice, and there was no evidence that 7-NI reduced LFP amplitude at any cortical depth. (Note that the differences in LFP shape, timing, and amplitude between Experiments 1 and 2 were probably due to the different whisker stimulation methods and parameters used, i.e. 0.3 ms electrical stimulation of the whisker pad in Experiment 1 vs. 20 ms mechanical deflection of the whiskers in Experiment 2.)
7-nitroindazole decreases positive tissue O2 responses
In contrast to LFPs,  responses were very different in controls and 7-NI-treated mice.
  responses showed marked laminar differences in the control mice (Figs 11A and 12A), with a large positive
  response in layer I (0.05 mm), a smaller but still positive
  response in layer II/III (0.25 mm), a prominent negative
  response with little overshoot in layer IV (0.45 mm), and a biphasic response (
 decrease then later overshoot) in layers V and VI (0.65 and 0.85 mm, respectively). This pattern of results was very similar to that seen in rats in Experiment 1. In contrast, responses in the 7-NI-treated mice were characterized by negative
  signals at all cortical depths, and a slow return to baseline with little or no overshoot, on average (Figs 11B and 12A). At most depths, negative
  responses were larger in the 7-NI group than controls.
  responses in layer I from individual control and 7-NI-treated mice are shown in Fig. 12D,E. [Note that in layer IV and V in both groups, there seemed to be a ‘double initial dip’. This may have been caused by additional movement of the cannula (and hence the whiskers contained therein) at the end of its travel.]
Fig. 12.
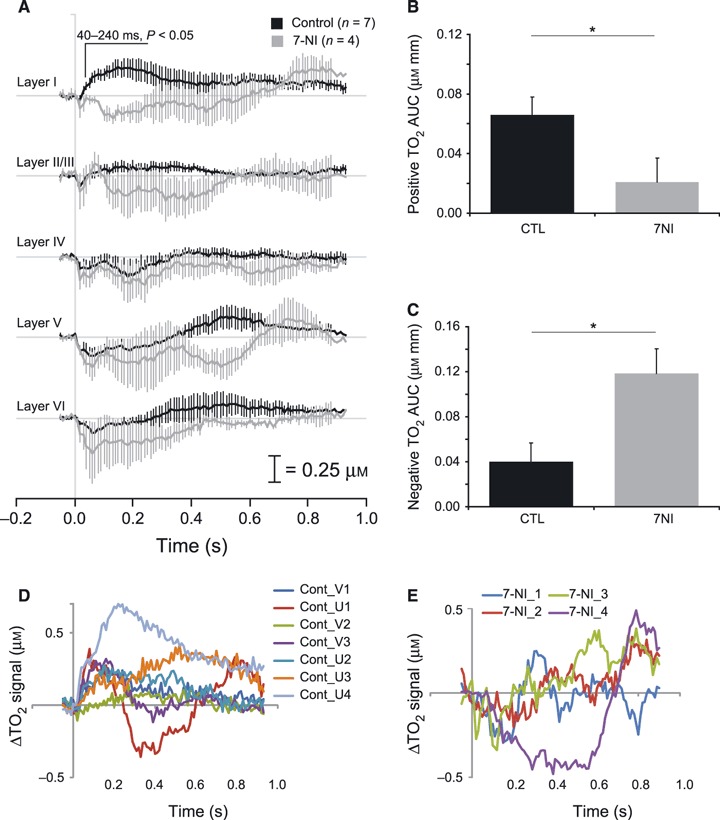
 responses in control mice (n = 7) and mice treated with 7-NI (n = 4). (A) Mean
  responses from control mice (black lines) and mice treated with 7-NI (grey lines). (B) Mean (+SEM) positive AUCs (0–500 ms) from layers I and II/III in control (CTL) mice (black bar) and mice treated with 7-NI (grey bar). (C). Mean (+SEM) negative AUCs (0–900 ms) from layers I-VI in control mice (black bar) and mice treated with 7-NI (grey bar). *P < 0.05.
  responses to whisker stimulation in layer I from individual mice (D, controls, n = 7; E, 7-NI-treated, n = 4). 7-NI_1, 7-NI mouse no. 1; Cont_V1, vehicle control mouse no. 1; Cont_U1, uninjected control mouse no. 1, etc.
7-nitroindazole decreases positive tissue O2 area under the curve but increases negative tissue O2 area under the curve
To analyse differences between  responses in the 7-NI and control groups, we calculated positive and negative AUCs. For the positive AUC we included responses from layers I and II/III (i.e. where positive
  responses were prominent in the control group) and calculated the AUC over 500 ms after stimulus onset. This analysis (anova: drug treatment2 × cortical depth2 × S11) found a significant effect of drug treatment (F1,9 = 5.2; P = 0.048), with larger positive AUCs in the control group (Fig. 12B). There was no effect of cortical depth or interaction (Fs < 1.1; P > 0.3). For the negative AUC we included all cortical layers. When the negative AUC was calculated for the 500 ms after stimulus onset (anova: drug treatment2 × cortical depth5 × S11), there were no significant effects of drug, cortical depth, or interaction (Fs < 3.1; P > 0.1). However, when the AUC was calculated over 900 ms after stimulus onset there was a significant effect of drug condition (F1,9 = 8.1; P = 0.02), with higher negative AUCs in the 7-NI group (Fig. 12C). Thus, 7-NI treatment resulted in a decreased positive
  response and an increased negative
  response.
No effect of 7-nitroindazole on slope of tissue O2 decrease
Importantly, there were no differences between the control and 7-NI groups in the rate of O2 consumption, as indexed by the slope of the initial  decrease. Analysis of the slope function for
  responses in layers IV, V, and VI (anova: drug treatment2 × cortical depth3 × S11) revealed no effect of drug treatment or interaction between drug treatment and cortical depth (all Fs < 1; P > 0.4). In addition, the correlation between LFP amplitude and negative
  amplitude was almost identical in both groups (controls: r = 0.37; 7-NI: r = 0.39). Consistent with the findings of other groups (e.g. Offenhauser et al., 2005), this shows that inhibition of nNOS does not affect the rate of
  consumption.
Positive tissue O2 responses occur within 50 ms of stimulus onset
Previous studies have suggested that the positive  response is slow, of at least the order of several hundred milliseconds after stimulus onset, but the present data suggest that faster positive
  responses can occur. To quantify the latency of the positive
  response in layer I (see Fig. 12A, top panel), we divided the
  signal into 10 ms timebins (covering the 50 ms before stimulus onset and the 500 ms after stimulus onset) and compared
  responses from the 7-NI and control groups (anova: drug treatment2 × timebin56 × S11). There was a main effect of drug treatment (F1,9 = 6.3; P = 0.03), with higher
  signals in the controls, and a drug treatment × timebin interaction (F55,495 = 2.3; P = 0.001). The interaction revealed no differences between the control and 7-NI groups during the baseline period but significantly higher
  levels in the control group from 40 to 240 ms after stimulus onset. We further analysed onset latencies in control mice by calculating signal changes greater than two SDs of baseline fluctuations (Fig. 13), as was done in Experiment 1. Negative
  responses were not consistently observed in layer I and there were no differences in onset between the other layers (F3,12 = 1.7; P = 0.2). Positive
  onset latencies were lowest in layer I and increased monotonically with depth. The mean positive
  onset latency in layer I (0.05 mm) was 72 ± 30 ms, although this was positively skewed by one mouse with a high latency (249 ms) and the median latency was 50 ms. There was a main effect of cortical depth on positive
  onset (F4,15 = 8.6; P = 0.001), driven by the lower latency in layer I compared with the other layers. These data demonstrate that positive
  responses can occur within tens rather than hundreds of milliseconds.
Fig. 13.
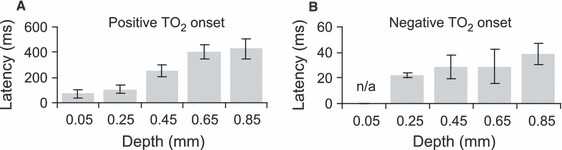
 onset latencies (i.e. signal change greater than two SDs of baseline fluctuations) in control mice. Onset times for (A) positive and (B) negative
  responses.
Discussion
Summary of results
The present data show that changes in  occur rapidly following neuronal activity, with evidence of both decreases and increases in
  within 50 ms of stimulus onset. In addition,
  responses were laminar specific, with
  increases predominating in the superficial layers and
  decreases predominating in the deeper layers. The largest decreases in
  occurred in layer IV, i.e. in the same layer that the LFP amplitude was largest. Across layers, and when varying stimulus intensity within layer IV, LFP amplitude was a reliable predictor of the amplitude of the negative
  response but not the positive
  response. Moreover, our data show that the rapid, positive
  response is abolished following the inhibition of nNOS. Collectively, these data show that (i) contrary to current opinion,
  changes, both positive and negative, occur on a similar timescale to neuronal activity, i.e. in tens rather than hundreds or thousands of milliseconds; and (ii) there are strong laminar differences in
  responses, probably reflecting laminar differences in local metabolic conditions and vascular architecture as well as differences in timing and degree of neuronal activity levels between cortical layers.
Temporal dynamics of tissue O2 responses
The rapid changes in  following whisker stimulation demonstrate the tight temporal coupling between neuronal and metabolic responses in the rat somatosensory cortex.
  decreases were evident within 40 ms of stimulus onset, confirming the existence of an initial decrease in
  that is closely linked to the timing of neuronal activity. The initial
  decrease has been reported in several previous studies (Ances et al., 2001; Thompson et al., 2003; Offenhauser et al., 2005) but only at low temporal resolution (hundreds of milliseconds) and in response to sustained stimulation. Here, with much higher temporal resolution, we also show that it occurs rapidly and in response to single electrical pulses or mechanical deflections of the whiskers. However, during sustained stimulation, a slower-onset
  increase was observed (see Fig. 10), similar to that seen in previous studies (e.g. Ances et al., 2001; Offenhauser et al., 2005).
More surprisingly, we also observed increased  responses within 50 ms of stimulus onset when recording from the superficial layers. Such rapid
  increases have never been reported previously and challenge current conceptions about the temporal limitations of
  dynamics. It is possible that these changes reflect a small but rapid increase in CBF. Indeed, using laser–Doppler flowmetry, Neilsen and Laurtizen (2001) found increased CBF within 200 ms of stimulus onset in the superficial layers of the rat somatosensory cortex following stimulation of the infraorbital nerve. This response latency was at the temporal resolution limits of laser–Doppler flowmetry, leaving open the possibility that CBF might respond earlier than 200 ms under certain circumstances. Also, in the current study we found that the nNOS inhibitor, 7-NI, abolished positive
  responses, which also implies a vascular basis.
However, we did not measure CBF directly in the present study and so cannot assert that this is the origin of the positive  response. Moreover, there are alternative explanations for our findings that do not assume a change in CBF. Our rapid positive
  responses could occur under conditions where CBF remains constant but
  utilization decreases in the supragranular layers. For example, following the synchronous thalamic input to layer IV, excitatory activation spreads to the supragranular layers within a few milliseconds, accompanied by a substantial GABAergic activation (e.g. in layers II/III) that controls the spread of excitation within the barrel cortex (Petersen & Sakmann, 2001). It has previously been shown that increasing GABAA activity (via local muscimol application) attenuates stimulus-induced
  utilization (Caesar et al., 2008). Thus, it could be that, during the fast positive
  responses that we observed, CBF remains constant but there is a GABAA-mediated decrease in
  utilization in the supragranular layers that manifests as a net increase in
  . Future studies concomitantly measuring
  and CBF at high temporal resolution during manipulations of GABAA activity are required to test this hypothesis. Even subtle disruption of neuronal-dependent vascular tone (e.g. reducing baseline blood flow) could interfere with this process. This could explain the abolition of the fast positive
  response seen in our 7-NI-treated mice in Experiment 2 without necessarily involving a drug effect on stimulus-induced changes in CBF.
Relationship between local field potentials and tissue O2
There was a strong correlation between LFP amplitude and the amplitude of the initial  decrease, suggesting that not only are the two events closely linked in time but both can serve as an index of the strength of afferent input. This finding is consistent with previous studies. For example, following stimulation of the climbing fibre pathway in the rat cerebellum, Offenhauser et al. (2005) reported a high correlation between the sum of LFPs (i.e. ΣLFP = mean LFP amplitude × stimulation frequency) and the slope of the initial
  decrease. Moreover, blocking AMPA receptors (with topical application of the AMPA antagonist 6-cyano-7-nitroquinoxaline-2,3-dione) reduced both ΣLFPs and the size of the initial
  decrease. These data argue that the size of the initial
  decrease is dependent upon glutamate release and excitatory post-synaptic activity. In the present study, LFP amplitude did not predict the size of the
  overshoot. Offenhauser et al. (2005) reported an exponential relationship between ΣLFP and positive
  responses, such that ΣLFP did not predict positive
  responses until a threshold of ΣLFP magnitude had been reached. In the present study, given that LFPs and
  responses were evoked by single electrical pulses or whisker deflections, it is likely that this threshold was not reached, and hence no predictive relationship was found.
Laminar nature of tissue O2 responses
The  increases were seen in the superficial layers, whereas the
  decreases were seen in the deeper layers. The largest
  decreases were seen at the site of the largest LFPs, in layer IV, with smaller
  decreases observed dorsal and ventral to layer IV. This suggests that stimulus-induced
  consumption in the rat barrel cortex reflects the magnitude of proximal excitatory post-synaptic activity. It is possible that the
  decrease could reflect a decrease in CBF but it is more commonly found that LFP amplitude (e.g. ΣLFP) correlates with increased rather than decreased CBF (Mathiesen et al., 2000). This pattern of laminar-specific responses in
  has not been reported before but our data are consistent with a recent fMRI study reporting whisker stimulation-induced positive BOLD responses in the superficial layers and negative BOLD responses in the deeper layers of the somatosensory cortex in alpha-chloralose-anaesthetized rats (Alonso et al., 2008). Moreover, our data are also consistent with the distribution of cytochrome oxidase activity (a mitochondrial enzyme and sensitive marker for oxidative capacity), which shows dense staining of barrels in layer IV with less staining in the superficial layers (Anderson et al., 2009). These data suggest that laminar differences in cellular organization may have important consequences for the size and direction of
  and BOLD responses, although it is important to note that laminar differences in vascular responses probably play a significant role (Cox et al., 1993; Woolsey et al., 1996; Tian et al., 2010).
Advantages and limitations of constant potential amperometry for tissue O2 measurements
The principal advantage of the technique used in the present study is its high temporal resolution and, as previously reported, its applicability in freely-moving rodents (Lowry et al., 1997; McHugh et al., 2011). In addition, although the CPE diameter is relatively large (125–250 μm) compared with some Clark-type O2 electrodes (Thompson et al., 2003; Offenhauser et al., 2005), CPEs can resolve laminar differences (∼200 μm) in the  response and therefore have spatial resolution that is suitable for studying region-specific activation in rodents (McHugh et al., 2011). Indeed, CPEs offer an advantage over smaller diameter electrodes in that there is a gradient of O2 tension from capillaries to mitochondria such that small O2 electrodes can detect widely varying O2 levels depending on their exact placement. In contrast, electrodes with dimensions larger than a capillary zone (i.e. >100 μm) detect an average level of
  irrespective of placement.
Nevertheless, larger diameter electrodes do increase the possibility of tissue damage and/or tissue compression, but we do not think that these factors can account for our dataset for two reasons. First, depth recordings were counterbalanced across animals (i.e. dorsal-to-ventral in some animals, ventral-to-dorsal in others) and the results were the same irrespective of order. Second, reliable LFPs were seen in all recordings, indicating that, although some tissue damage may occur, the neurons in the vicinity of the electrode remain functional. Moreover, it is worth re-emphasizing that the rapid, laminar-specific  responses were observed in both Experiments 1 and 2 despite their methodological differences. In particular, the fact that similar results were obtained using different anaesthetics (urethane vs. halothane) and methods of ventilation (spontaneous breathing vs. artificial ventilation with O2/N2O) argues that these findings are not due to elevated or depressed levels of systemic oxygenation.
Using the tissue O2 signal as a proxy for the blood-oxygen-level-dependent signal
Although the present study was in anaesthetized animals, our principal reason for developing this technique is to use the  signal in freely-moving rodents to investigate region-specific brain activity during behavioural tasks (e.g. McHugh et al., 2011). BOLD fMRI cannot be used in behaving rodents (because the subject’s head must remain stationary) but
  offers a good proxy measure for BOLD because both signals are driven by the same physiological mechanisms and respond in a similar fashion to reflect the balance of local O2 delivery and consumption (e.g. increased signals when CBF > O2 consumption; decreased signals when O2 consumption > CBF). Moreover, there is close concordance between the BOLD and
  signals when recorded simultaneously in the fMRI scanner (Lowry et al., 2010). Thus,
  amperometry has the potential to improve translation between rodent and human studies across many areas of neuroscience.
Conclusions
The relationships between neuronal, metabolic, and vascular responses are complex and understanding them requires mapping each signal at an appropriate level of spatial and temporal resolution. The present study has advanced this cause by demonstrating that changes in  occur rapidly following neuronal activity and that the size and direction of these
  changes are laminar specific.
Acknowledgments
This study was supported by the Wellcome Trust (grant nos 074385 and 087736) and the Biotechnology and Biological Sciences Research Council and Eli Lilly as part of a University of Oxford CASE studentship.
Glossary
- AUC
area under the curve
- BOLD
blood-oxygen-level-dependent
- CBF
cerebral blood flow
- CPE
carbon paste electrode
- fMRI
functional magnetic resonance imaging
- LFP
local field potential
- 7-NI
7-nitroindazole
- nNOS
neuronal nitric oxide synthase

tissue oxygen (partial pressure of tissue oxygen)
Supplementary material
Fig. S1. In vitro control data performed in aphosphate-buffered saline-filled glass cell showing no response ofthe constant potential amperometry O2 signal to a train of electrical stimulations.
As a service to our authors and readers, this journal provides supporting information supplied by the authors. Such materials are peer-reviewed and may be re-organized for online delivery, but are not copy-edited or typeset by Wiley-Blackwell. Technical support issues arising from supporting information (other than missing files) should be addressed to the authors.
References
- Alonso B, de C, Lowe AS, Dear JP, Lee KC, Williams SC, Finnerty GT. Sensory inputs from whisking movements modify cortical whisker maps visualized with functional magnetic resonance imaging. Cereb. Cortex. 2008;18:1314–1325. doi: 10.1093/cercor/bhm163. [DOI] [PMC free article] [PubMed] [Google Scholar]
- Ances BM, Buerk DG, Greenberg JH, Detre JA. Temporal dynamics of the partial pressure of brain tissue oxygen during functional forepaw stimulation in rats. Neurosci. Lett. 2001;306:106–110. doi: 10.1016/s0304-3940(01)01868-7. [DOI] [PubMed] [Google Scholar]
- Anderson LA, Christianson GB, Linden JF. Mouse auditory cortex differs from visual and somatosensory cortices in the laminar distribution of cytochrome oxidase and acetylcholinesterase. Brain Res. 2009;1252:130–142. doi: 10.1016/j.brainres.2008.11.037. [DOI] [PubMed] [Google Scholar]
- Armstrong-James M, Fox K. Spatiotemporal convergence and divergence in the rat S1 “barrel” cortex. J. Comp. Neurol. 1987;263:265–281. doi: 10.1002/cne.902630209. [DOI] [PubMed] [Google Scholar]
- Bolger FB, McHugh SB, Bennett R, Li J, Ishiwari K, Francois J, Conway MW, Gilmour G, Bannerman DM, Fillenz M, Tricklebank M, Lowry JP. Characterisation of carbon paste electrodes for real-time amperometric monitoring of brain tissue oxygen. J. Neurosci. Methods. 2011;195:135–142. doi: 10.1016/j.jneumeth.2010.11.013. [DOI] [PubMed] [Google Scholar]
- Caesar K, Offenhauser N, Lauritzen M. Gamma-aminobutyric acid modulates local brain oxygen consumption and blood flow in rat cerebellar cortex. J. Cereb. Blood Flow Metab. 2008;28:906–915. doi: 10.1038/sj.jcbfm.9600581. [DOI] [PubMed] [Google Scholar]
- Cox SB, Woolsey TA, Rovainen CM. Localized dynamic changes in cortical blood flow with whisker stimulation corresponds to matched vascular and neuronal architecture of rat barrels. J. Cereb. Blood Flow Metab. 1993;13:899–913. doi: 10.1038/jcbfm.1993.113. [DOI] [PubMed] [Google Scholar]
- Di S, Baumgartner C, Barth DS. Laminar analysis of extracellular field potentials in rat vibrissa/barrel cortex. J. Neurophysiol. 1990;63:832–840. doi: 10.1152/jn.1990.63.4.832. [DOI] [PubMed] [Google Scholar]
- Erecinska M, Silver IA. Tissue oxygen tension and brain sensitivity to hypoxia. Respir. Physiol. 2001;128:263–276. doi: 10.1016/s0034-5687(01)00306-1. [DOI] [PubMed] [Google Scholar]
- Goense JB, Whittingstall K, Logothetis NK. Functional magnetic resonance imaging of awake behaving macaques. Methods. 2010;50:178–188. doi: 10.1016/j.ymeth.2009.08.003. [DOI] [PubMed] [Google Scholar]
- Hitchman ML. Measurement of Dissolved Oxygen. New York: John Wiley; 1978. [Google Scholar]
- Iadecola C, Yang G, Xu S. 7-Nitroindazole attenuates vasodilation from cerebellar parallel fiber stimulation but not acetylcholine. Am. J. Physiol. 1996;270:R914–R919. doi: 10.1152/ajpregu.1996.270.4.R914. [DOI] [PubMed] [Google Scholar]
- Lowry JP, Boutelle MG, Fillenz M. Measurement of brain tissue oxygen at a carbon past electrode can serve as an index of increases in regional cerebral blood flow. J. Neurosci. Methods. 1997;71:177–182. doi: 10.1016/s0165-0270(96)00140-9. [DOI] [PubMed] [Google Scholar]
- Lowry JP, Griffin K, McHugh SB, Lowe AS, Tricklebank M, Sibson NR. Real-time electrochemical monitoring of brain tissue oxygen: a surrogate for functional magnetic resonance imaging in rodents. Neuroimage. 2010;52:549–555. doi: 10.1016/j.neuroimage.2010.04.187. [DOI] [PubMed] [Google Scholar]
- Masamoto K, Vazquez A, Wang P, Kim SG. Trial-by-trial relationship between neural activity, oxygen consumption, and blood flow responses. Neuroimage. 2008;40:442–450. doi: 10.1016/j.neuroimage.2007.12.011. [DOI] [PMC free article] [PubMed] [Google Scholar]
- Mathiesen C, Caesar K, Lauritzen M. Temporal coupling between neuronal activity and blood flow in rat cerebellar cortex as indicated by field potential analysis. J. Physiol. 2000;523:235–246. doi: 10.1111/j.1469-7793.2000.t01-1-00235.x. [DOI] [PMC free article] [PubMed] [Google Scholar]
- McHugh SB, Fillenz M, Lowry JP, Rawlins JN, Bannerman DM. Brain tissue oxygen amperometry in behaving rats demonstrates functional dissociation of dorsal and ventral hippocampus during spatial processing and anxiety. Eur. J. Neurosci. 2011;33:322–337. doi: 10.1111/j.1460-9568.2010.07497.x. [DOI] [PMC free article] [PubMed] [Google Scholar]
- Nielsen A, Lauritzen M. Coupling and uncoupling of activity-dependent increases of neuronal activity and blood flow in rat somatosensory cortex. J. Physiol. 2001;533:773–785. doi: 10.1111/j.1469-7793.2001.00773.x. [DOI] [PMC free article] [PubMed] [Google Scholar]
- O’ Neill RD, Grunewald RA, Fillenz M, Albery WJ. Linear sweep voltammetry with carbon paste electrodes in the rat striatum. Neuroscience. 1982;7:1945–1954. doi: 10.1016/0306-4522(82)90009-4. [DOI] [PubMed] [Google Scholar]
- Offenhauser N, Thomsen K, Caesar K, Lauritzen M. Activity-induced tissue oxygenation changes in rat cerebellar cortex: interplay of postsynaptic activation and blood flow. J. Physiol. 2005;565:279–294. doi: 10.1113/jphysiol.2005.082776. [DOI] [PMC free article] [PubMed] [Google Scholar]
- Paxinos G, Franklin KBJ. The Mouse Brain in Stereotaxic Coordinates. 2nd edn. New York: Academic Press; 2001. [Google Scholar]
- Paxinos G, Watson C. The Rat Brain in Stereotaxic Coordinates. 4th edn. New York: Academic Press; 1998. [Google Scholar]
- Petersen CC, Sakmann B. Functionally independent columns of rat somatosensory barrel cortex revealed with voltage-sensitive dye imaging. J. Neurosci. 2001;21:8435–8446. doi: 10.1523/JNEUROSCI.21-21-08435.2001. [DOI] [PMC free article] [PubMed] [Google Scholar]
- Thompson JK, Peterson MR, Freeman RD. Single-neuron activity and tissue oxygenation in the cerebral cortex. Science. 2003;299:1070–1072. doi: 10.1126/science.1079220. [DOI] [PubMed] [Google Scholar]
- Tian P, Teng IC, May LD, Kurz R, Lu K, Scadeng M, Hillman EM, De Crespigny AJ, D’ Arceuil HE, Mandeville JB, Marota JJ, Rosen BR, Liu TT, Boas DA, Buxton RB, Dale AM, Devor A. Cortical depth-specific microvascular dilation underlies laminar differences in blood oxygenation level-dependent functional MRI signal. Proc. Natl. Acad. Sci. USA. 2010;107:15246–15251. doi: 10.1073/pnas.1006735107. [DOI] [PMC free article] [PubMed] [Google Scholar]
- Woolsey TA, Rovainen CM, Cox SB, Henegar MH, Liang GE, Liu D, Moskalenko YE, Sui J, Wei L. Neuronal units linked to microvascular modules in cerebral cortex: response elements for imaging the brain. Cereb. Cortex. 1996;6:647–660. doi: 10.1093/cercor/6.5.647. [DOI] [PubMed] [Google Scholar]
- Yang G, Chen G, Ebner TJ, Iadecola C. Nitric oxide is the predominant mediator of cerebellar hyperemia during somatosensory activation in rats. Am. J. Physiol. 1999;277:R1760–R1770. doi: 10.1152/ajpregu.1999.277.6.R1760. [DOI] [PubMed] [Google Scholar]
- Yang G, Huard JM, Beitz AJ, Ross ME, Iadecola C. Stellate neurons mediate functional hyperemia in the cerebellar molecular layer. J. Neurosci. 2000;20:6968–6973. doi: 10.1523/JNEUROSCI.20-18-06968.2000. [DOI] [PMC free article] [PubMed] [Google Scholar]
Associated Data
This section collects any data citations, data availability statements, or supplementary materials included in this article.