Abstract
Silicon nanoparticles with strong blue photoluminescence were synthesized by electrochemical etching of silicon wafers and ultrasonically removed under N2 atmosphere in organic solvents to produce colloids. Thermal treatment leads to the formation of colloidal Si particles of 3 ± 1 nm diameter, which upon excitation with 340 – 380 nm light exhibited room temperature luminescence in the range from 400 to 500 nm. The emission and the one- and two-photon excitation spectra of the particles are not sensitive to surface functionalization with methyl 2-methylprop-2-enoate. However, the derivatized particles show higher emission quantum yields in air-saturated suspensions (44%) than the underivatized particles (27%), as well as higher stability of its dispersions.
FTIR and XPS spectra indicate a significant surface oxidation of the particles. The Si:O:C ratio at the surface of the derivatized particles estimated from XPS is Si3O6(C5O2Hy)1, with y = 7 - 8. Vibronic spacing is observed in both the emission and excitation spectra. The information obtained from one-photon excitation experiments (emission and excitation spectra, photoluminescence quantum yields, luminescence decay lifetimes and anisotropy correlation lifetimes), as well as from two-photon excitation fluorescence correlation spectroscopy (brightness and diffusion coefficients) and TEM indicate that the blue-emitting particles are monodisperse and ball-shaped. Particle size clearly determines the emission and excitation spectral region, as expected from quantum confinement, but the presence and extent of Si-O species on the silicon networks seem crucial for determining the spectrum features and intensity of emission. The nanoparticles could hold great potential as quantum dots for applications as luminescence sensors in biology and environmental science.
Keywords: photoluminescence, biphotonic excitation, MMA functionalization, electrochemical synthesis
Introduction
Silicon nanoparticles (Si-NPs) of 1–5 nm size received a great attention, as they combine size-dependent photoluminescence (PL) with the richness of silicon surface chemistry. The momentum requirements that make bulk Si a rather inefficient light emitter are relaxed in the 1–5 nm diameter Si crystals as a result of quantum confinement effects.1 The PL of H-terminated nanocrystals may be tuned from the near-IR to the blue with decreasing particle size.2, 3, 4
The controlled synthesis of monodisperse batches of these nanoparticles (NPs) are of interest as materials for light emitting structures for a variety of biochemical and engineering applications.5,6 Si-NPs have been prepared by several routes including: electrochemical HF-mediated etching of crystalline Si wafers to yield porous silica (PS) and further dispersion of the particles by ultrasound, 3,4,7,8,9 chemical reaction of Si precursors in solution,1,10 and gas phase synthesis.11, 12 However, significant differences are reported in the room temperature PL of apparently similar particles obtained by different synthetic routes, as discussed below.
Hydrogen-capped and methyl ester functionalized Si-particles of ~ 1 nm diameter prepared from anodically etched PS,8 show a PL spectrum with maxima around 320 or 380 nm at excitation wavelengths of 270 and 320 nm, respectively. Air-stable octanol -capped 1.6 nm mean diameter Si-NPs synthesized from a mixture of argon/silane in a continuous flow atmospheric-pressure microdischarge reactor, were reported to exhibit PL that peaks at 420 nm and an excitation peak at 360 nm.12 On the other hand, alkyl-functionalized Si-NPs of (1.6 ± 0.2) nm size synthesized by a solution reduction method in the presence of micelles, showed UV/Vis absorption and emission spectra (γemmax ~ 280 – 290 nm) with vibrational progressions (974 ± 14 cm−1) which resembled bulk SiC phonons.1 Octyl -capped Si-NPs of (3.9 ± 1.3) nm diameter, synthesized by the metathesis reaction of sodium silicide with NH Br, exhibited PL with γem max ~ 438 nm upon excitation at 360 – 400 nm.13
In small crystalline - Si-NPs of sizes comparable to or smaller than the exciton Bohr radius in bulk Si (~ 4.5 nm),14, 15 the wave functions of excitons and electrons are delocalized over the nanoparticles. Therefore, the optical properties of crystalline -Si nanoparticles and nanostructures are also sensitive to the surface chemistry and to the geometry of the structures.15 The important role of surface reconstruction and termination in determining the nature of the 1 nm- particles PL is well described by theoretical studies, which consider molecular-like energy levels.3 , 16, 17 Studies performed for Si-NPs of 1- to 1.5-nm size17 demonstrated that oxygen has a direct interaction with the Si orbitals that substantially changes the HOMO and LUMO with respect to those of H-terminated particles. Thus, the emission of H-terminated nanocrystals above 3.0 eV in the blue (emission peak with γem max < 400 nm) moves to near 2.0 eV in the yellow-red (γ em max ~ 600 nm) upon oxidation. For these sizes, the excited state is a surface excitation directly involving the capping atoms rather than the volume excitation. The direction of the oxidation effect is opposite to that predicted by a quantum size model, which considers that only the number of elemental Si atoms in the nanocrystal core is responsible for the PL, as surface oxidation decreases the number of these Si atoms. In fact, studies reporting the preparation of oxidized stable blue-emitting Si-NPs (γem ~ 460 nm) from the oxidation of 5 nm size red-emitting (γem max ~ 600 nm) Si-NPs with an organic monolayer grafted to their surface support the quantum size model.11 The presence of oxygen is an evident reason for the observed discrepancies, still, the direction and magnitude of these differences is not clear.
With the aim of obtaining organically-capped Si-NPs dispersible in most common solvents and with strong and stable emission for their use as luminescent markers in biological and environmental systems, we undertook the electrochemical etching of crystalline Si wafers and further dispersion of particles by ultrasound as a synthetic route. An adaptation of the method allowed us to obtain stable suspensions of functionalized Si-NPs with emission lifetimes and spectrum different from those previously reported for particles of similar size. Here, we report their synthesis and further derivatization with methanol and methyl 2-methylprop-2-enoate, as well as their characterization by transmission electron microscopy (TEM), Fourier transformed infrared spectroscopy (FTIR), X-ray photoelectron spectroscopy (XPS), luminescence lifetime, fluorescence correlation spectroscopy (FCS), and time-resolved anisotropy measurements, to show that the extent of surface oxidation, is as important as particle size in determining the particle luminescence characteristics. Moreover, to evaluate their potential use in biological experiments, their two-photon excitation spectrum and absorption cross section were determined.
Experimental Methods
All Chemicals used were purchased from Sigma–Aldrich and employed without further purification unless otherwise indicated. Toluene ((0.005% H2O content), 99.7% (GC)), methanol, and methyl 2-methylprop-2-enoate (MMA) were deaerated before reaction. When required, toluene and methanol were dried over molecular sieves for 24 hours.
For the synthesis of Si-NPs a modification of the electrochemical etching of porous Si published in the literature was employed.3,8,18,19 Clean crystalline Si p-type 100 wafers with resistivities between 1.0 and 10.0 Ωcm were electrochemically etched in a Teflon cell containing an electrolytic solution (3% HF, 22% CH3OH and 25% HNO3 (v/v)). A 5 – 20 mA/cm2 galvanostaticcurrent was applied between the anode (Si wafer) and the cathode (Pt electrode). The Silicon wafer was immersed in the electrochemical bath at a constant rate of 1 mm/h for 20 hours. After etching, the wafer was rinsed with methanol, dried under nitrogen and further immersed in deaerated toluene. Approximately 80 μg Si-NPs were released by ultrasound (Ney Dental Inc; 50/60 Hz; 100 W). Pulverization of the Si-NPs colloids in different organic solvents was also investigated. Under identical experimental conditions, toluene yields very stable suspensions (vide infra) with the highest PL. Therefore, toluene was mainly used as the solvent for further surface derivatization.
The derivatization of the particles was performed with batches of “freshly” prepared Si-NPs suspended in toluene in the absence of oxygen. Methyl coating is obtained after 4 hours treatment of the toluene suspensions with 40 mM methanol at 90°C. Coating with methyl 2-methylprop-2-enoate (MMA) is obtained after 4 hours irradiation of the Si-NPs suspensions containing 10 mM MMA with a Rayonet Photochemical Reactor Lamp (RPR 3500 A, Southerm N.E. Ultraviolet Co.) emitting at 350 ± 20 nm. A similar methodology for the coating with hydrocarbons is reported in the literature.20, 21
The resulting Si-NPs suspension was passed through hydrophilic 0.1 μm PVDF Durapore® VVPP Membrane Filters (Millipore) to eliminate solid residues, the solvent evaporated, and the particles further dispersed in other solvents of interest. Solvent evaporation and re-suspension of the derivatized particles does not change the characteristics of their emission and excitation spectra. Contrary to this observation, underivatized particles showed a spectrum expanded to the red after solvent evaporation to dryness and re-suspension, probably due to particle-particle interactions leading to an irreversible agglomeration as dilution does not appreciably change the observed spectrum.
FTIR spectra were obtained with a Bruker EQUINOX spectrometer. Either KBr disks or silicon wafers were used as holders. Disks were prepared by mixing vacuum dried Si-NPs toluene suspensions with dried KBr and pressed into a pellet. Otherwise, a small piece of Si wafer was dip-coated with a toluene suspension of Si-NPs and dried at room temperature. Spectra were taken in the 4000 - 400 cm−1 with 4 cm−1 resolution and corrected for the background signal by collecting 64 scans for each measurement. Attenuated total reflection infrared (ATR-IR) spectroscopy used for the analysis of the surface of the nanoparticles was obtained with a NICOLET 380 FITR ATR accessory using a ZnSe crystal and an incident beam angle of 45°. Sixty four scans at 4 cm−1 resolution were collected.
The XPS spectra were obtained under UHV with a XR50 Specs GmbH spectrometer with Mg K(α) as the excitation source and a PHOIBOS 100 half sphere energy analyzer. Calibration was performed with Au4f 7/2 and Cu2p 3/2 with binding energies of 84.00 and 933.67 eV, respectively.
TEM samples were prepared by dipping a carbon-coated 300-mesh copper grid into a Si-NPs suspension in toluene and the solvent evaporated in air. TEM micrographs were taken with a Phillips CM-10 microscope operating at 100 kV at five different spots of each grid.
Optical measurements were performed at atmospheric pressure and at room temperature. Electronic absorption spectra were recorded in a quartz cuvette (1 cm, Hellma) with a Cary 13 UV/Vis double-beam spectrophotometer (Varian, Australia).
Steady-state luminescent measurements were performed with a Perkin-Elmer LS-50B spectrometer equipped with a Xe lamp as excitation source, a monochromator for selecting the excitation wavelength with a bandpass gap of 3 nm, and a sensitive to the red R928 PMP detector. All spectra were corrected for the wavelength-dependent sensitivity of the detector and the source by recording reference data simultaneously. Additionally, emission spectra were corrected for Raman scattering by using the solvent emission spectrum.
To estimate the quantum yield of the synthesized Si nanoparticles, PL emission spectra were collected at various excitation wavelengths. Identical measurements (excitation conditions, lamp energy, and spectrometer band-pass) were performed with 9, 10-diphenylanthracene in cyclohexane, which emits between 400 and 500 nm with a known efficiency of 90 % upon 275 to 405 nm excitation.22 The absorbance of argon saturated toluene suspensions of the NPs at the excitation wavelength was used for the quantum yield calculations to avoid introducing a further source of error due to the charge transfer absorption of toluene –oxygen mixtures.23
Frequency-domain luminescence and anisotropy measurements were performed with a multifrequency cross-correlation phase and modulation fluorometer based on ISS Koala automated sample compartment, modulatable LEDs (280, 295, 370, 405, 471, 443, and 630 nm), and a modulatable Hamamatsu photomultiplier (up to 500 MHz). A pulsed light-emitting diode (γexc = 405 nm) was used as excitation source. Excitation light was passed through a 405 ± 10 nm filter. Polarizers were used in a magic-angle position (54.7°) when no anisotropy was measured.
Two photon scanning fluorescence correlation spectroscopy (FCS) measurements were performed with an Olympus IX70 microscope equipped with an UPlus Sapo Olympus 60x, 1.20 V objective coupled with a Coherent Chameleon-Ultra femtosecond Ti–sapphire near infrared laser, a Cambridge Technologies mirror scanner, and a Hamamatsu H7422P-40 PMT. The laser generated pulses of 150 fs duration at a repetition rate of 80 MHz and 2.53 W at 774 nm. The excitation light was limited by 2 Schott RG715 filters to cut-off light of γ < 715 nm. Three filters, a HQ 520 / 90M, a dichroic 435 / 70 M, and a 470 / 30M limited the detected emission light to the 440 – 500 nmrange, detected in photon counting mode. Data were taken with 128 kHz frequency and a time base of 7.81×10⁻⁶ s, to obtain 1023 cycles in a total time of 261.888 s and using 512 bins.
A 1–2 mm radio Teflon ring was used as a cell to avoid evaporation effects. The excitation volume waist of the setup is determined from the autocorrelation function of Rodhamine 110, taken under the same beam focusing conditions. Assuming a diffusion coefficient for rodhamine of D = 3×10⁻⁶ cm2 / s,24 the laser is calculated to be focused to a spot of 0.37 μm diameter. SimFCS and Globals, UCI developed programs, were used for analyzing the signals.
The signal-to-background ratio defined as the photon count rates of the excited molecules in the focused volume divided by the photon count rates of the background (e.g. solvent) is ~ 20 for the rhodamine experiments and ~ 34 for the nanoparticles experiments, under identical conditions.
Bilinear regression analysis
For each excitation wavelength of the particle suspension an emission spectrum is obtained. For a pure substance existing in a unique form, the luminescence spectrum is invariant, remaining the same independent on the excitation wavelength. For low fluorophore absorbance (< 0.05), the steady state emission intensity at a given emission wavelength (I(λm)) is proportional to the absorption coefficient of the fluorophore at a given excitation wavelength (ε(λx)), the concentration of the fluorophore, and the factor F(λm) reflecting the distribution of the probability of the various transitions from the lowest vibrational level of the first electronic excited level to the various vibrational levels of the ground state.25 A bilinear regression analysis taking advantage of the linearity of I(λm) with both, ε(λx) and F(λm) was applied to the experimental emission matrix in order to retrieve information on the minimum number of species and on their relative emission and absorption spectra.26 Using the running indexes x and m for the excitation and emission wavelengths, respectively, in a matrix form [ixm] = [εxj].[fjm], where [ixm], [εxj] and [fjm] represent the emission intensity, absorption coefficients, and F(λm) matrixes, respectively. The procedure is based on the alternating calculus of the matrices [εxj] and [fjm] by multiple linear regression iteratively until convergence is achieved when a least-squares condition is applied in order to minimize the elements of an error matrix. From the error matrix, a corrected emission intensity matrix, [ixm c], is obtained. The number of species is selected as the minimum that shows a reasonable approximation between [ixm c] and [ixm].
Results and Discussion
“As obtained” Si-NPs
Evolution of the PL with aging
The excitation and emission spectra of the “as obtained” particles in toluene strongly depend on aging. The suspension was sonicated for 30 minutes before measurement to avoid the slow precipitation of reddish luminescent particles. Figure 1 shows the evolution of the emission spectrum obtained by exciting a toluene suspension of the particles with 360 nm light at different times after the synthesis. The broad band with maximum at 650 nm observed two hours after the synthesis is shifted to the blue and decreases in intensity with aging, while a new emission band with maximum around 440 nm is observed. Si-NPs obtained from pulverization of PS in methanol show a similar behavior, though lower luminescence intensities are observed.
Figure 1.
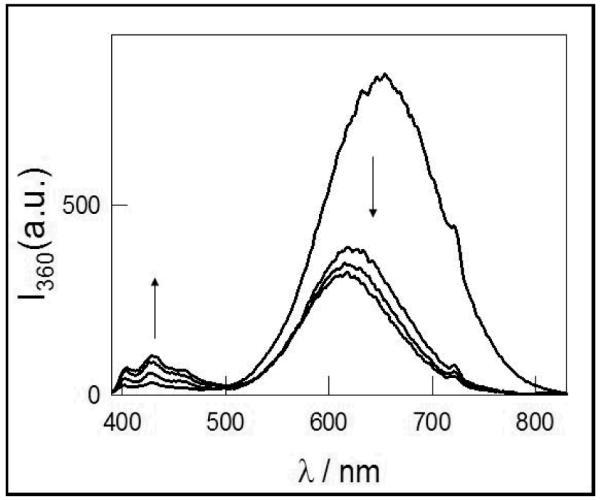
Time evolution of the emission spectra obtained at 360 nm excitation, of as obtained Si-NPs in toluene suspension. The arrows indicate the direction of the increasing and decreasing emission after 2, 5, 16 and 25 days.
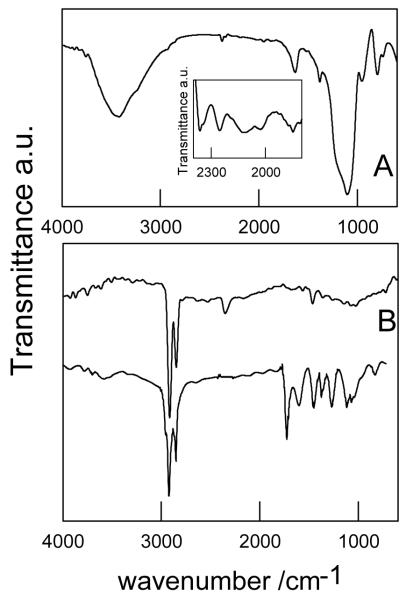
The FTIR spectra of as obtained Si-NPs supported on KBr disks show very weak and broad absorption peaks at 2100 - 2250 cm−1 and 2200- 2300 cm−1 (see Figure 2A inset) which could be due to Si-Hx stretching modes and OxSi-H vibrations, respectively. Accordingly, the peak at ~900 cm−1 could be assigned to Si-H bending modes. These results are in agreement with those usually observed for planar hydrosilylated Si surfaces.27,28,29,30,31 The additional bands observed at nearly 3400, 1630 and 800 cm−1 are assigned to Si-OH groups and those at 1100 cm−1 to Si-O-Si vibrations which characterize the spectrum of SiO -NPs.28,29,32
Figure 2.
FTIR spectrum of: A: HOSi-NPB supported on a silicon wafer. Inset A: “as obtained” silicon particles supported on KBr pellets B: top spectrum: MeSi-NPB supported on Si wafer. Bottom spectrum: ATR-IR spectrum of MMASi-NPB supported on Si wafer.
Four hours heating at 90 °C of toluene suspensions of freshly prepared Si-NPs under nitrogen have almost the same effect on the luminescence evolution of the particles than two weeks aging at room temperature. Therefore, this procedure was applied to optimize the synthesis of the blue emitting particles. However, in order to avoid surface oxidation of the particles during workout, derivatization was performed with batches of freshly prepared Si-NPs suspended in toluene in the absence of oxygen, without previous thermal treatment. Filtration of suspensions of either underivatized particles, methanol or methyl 2-methylprop-2-enoate derivatized particles with 0.1 μm PVDF filters or 10 minutes centrifugation with a force of 10062×g allows the mechanical separation of the blue emitting particles which remain in suspension from those emitting in the red, retained in the filter.
Blue emitting particles
Underivatized blue-emitting particles: HOSi-NPB
A bilinear analysis 26 of the emission intensity matrix of the filtered suspension indicates the existence of one well defined population of particles emitting in the blue, as the emission spectrum does not depend on the excitation wavelength. The excitation and emission spectra are shown in Figure 3. The FTIR spectrum of these particles, from now on denoted as HOSi-NPB, shows peaks due to Si-OH (3400 - 3500, 1630 and 800 cm−1) and Si-O-Si (1100 -cm−1), but no peaks attributed to O3Si-H vibrations,3,33 see Figure 2A (main figure). Therefore, a high degree of surface oxidation is observed for HOSi-NPB. A mean diameter of 3 ± 1 nm (Figure 4) was determined by TEM.
Figure 3.
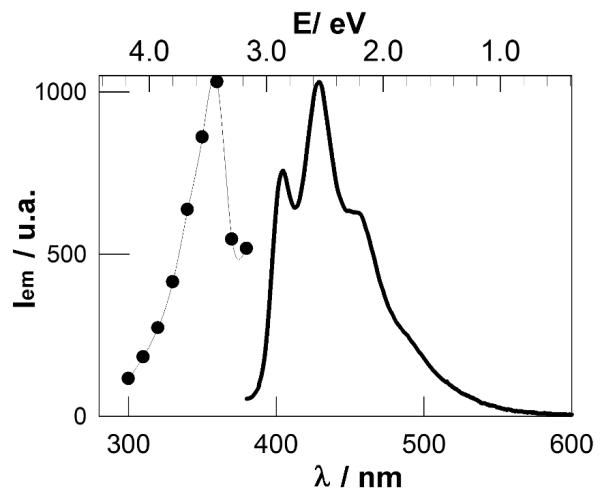
Emission and excitation spectra of HOSi-NPB suspensions in toluene retrieved from the bilinear regression analysis of the excitation-emission matrix. The emission spectrum was normalized to the excitation at 360 nm and the excitation spectrum to the emission at 425 nm.
Figure 4.
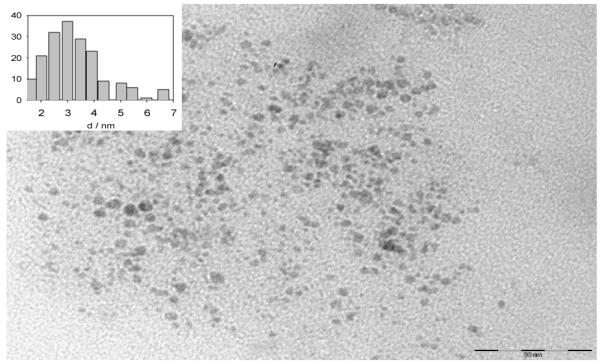
Representative TEM micrograph of HOSi-NPB nanoparticles. Scale bar 50 nm. Inset: particle size histogram.
Surface functionalized blue-emitting particles
The FTIR spectrum for the blue emitting nanoparticles functionalized with methanol (MeSi-NPB) supported on a silicon wafer (Figure 2 B top spectrum) shows a set of peaks around 2920 and 2850 cm−1 due to C-H stretching of the CH3 group, and a very small absorption at 1470 cm−1 attributed to Si-C scissoring.1,34 The broad absorption with maximum around 1050 cm−1 due to polar Si-O-Si bonds 29 indicates some surface oxidation. No evidence for an OH stretching mode in the 3500 - 3000 cm−1 region was observed, indicating the absence of physisorbed methanol and of surface Si-OH groups. Therefore, the covalent attachment of CH3 groups to the surface of the H-terminated Si-NPs due to condensation reaction (1) is supported.
The ATR-IR spectrum of the methyl 2-methylprop-2-enoate functionalized nanoparticles (MMASi-NPB) using as a reference the Si wafer (bottom spectrum in Figure 2B) shows peaks at 2920 and 2850 cm−1 due to C-H stretching of the CH3 group, 1724 cm−1 due to the C=O stretching in esters, and at 1450 and 1370 cm−1 due to the contribution of CH3 deformation modes in alkanes and esters, respectively. The absorption at 1260 cm−1 is assigned to Si-CH2-CH deformation and those at 1600 and 960 cm−1 may be attributed to Si-C=C vibration modes.35 The latter bands together with the absence of signals at 2100 - 2200 cm−1 due to Si–H suggests a successful covalent attachment of methyl ester linkers to the surface, as shown in reaction (2) for two proposed structures. The presence of peaks at 1115 and 1055 cm−1 characteristic of Si-O-Si in small particles (and probably that at 830 cm−1) 27,36 are indicative of a surface oxidized silicon particle; though the absence of bands around 3500 cm−1 clearly indicate the lack of Si-OH bonds. Successful methyl 2-methylprop-2-enoate attachment is also supported by the determination of the contact angle > 120° for water drops on the Si-NPs surface suggesting a hydrophobic NPs surface compared to contact angles < 90° observed for the hydrophilic silicon wafer surface.34
 |
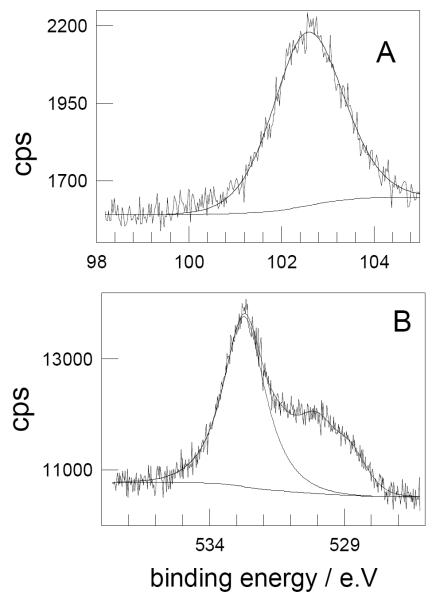
The XPS spectrum obtained for MMASi-NPB shows signals due to O1s, C1s, Si2s and Si2p surface elements. The Si2p region (see Figure 5A) mainly displays the contribution of a peak at 102.6 eV (1.6 FWHM) which shows a local environment of silicon between those of Si-C and Si-O bonds, reported at 101 and 103.5 eV, respectively. A peak at 102.5 eV was assigned to Si(C,O) environments in polymethylsilsesquioxanes37 and in oxycarbide glasses,38 and to S i-SiO3 environments in SiO films.39 The O1s region shown in Figure 5B displays the contribution of three different environments for the oxygen atoms. The most important contribution (67 %) with a binding energy of 532.7 eV could be attributed to Si-O bonds.39 The ratio of areas of the latter peak to that of Si2p yields approximately a 1:2 Si:O ratio. Assuming that the remaining oxygen atoms belong to the ester group of the surface attached organic molecule, the ratio between the areas of these oxygen atoms and that of silicon indicates the attachment of 1 organic molecule every 3 silicon atoms.
Figure 5.
A: Si2p and B: O1s XPS peaks observed for MMASi-NPB.
Therefore, both the FTIR and XPS data agree in indicating that the particle surface is highly oxidized with a layer of SiO2 and that surface functionalization with methyl 2-methylprop-2-enoate leads to the formation of surface -O-Si-C-networks. In average, the Si:O:C ratio at the surface of the derivatized particles seems to be Si3O6(C5O2Hy)1, with y = 7 - 8. A mean diameter of the order of 2.5 ± 0.5 nm was determined by TEM for MMASi-NPB.
Photophysical properties
Figure 6 shows the absorption, emission and excitation spectra of toluene suspensions of HOSi-NPB, MeSi-NPB, and MMASi-NPB. The small differences observed in the relative intensity of the bands depends more on the synthesis batch than on the type of surface groups (see supporting information for the spectra obtained for suspensions of different batches of particles). The excitation spectra of the different particles show a common maximum. However, some fluctuations on the UV range of the excitation spectra may be observed with different Si-NPs batches and different surface groups, see Figure 6B. Solvent evaporation and further dispersion of the MMASi-NPB particles in methanol, ethanol, chloroform, carbon tetrachloride or toluene does not change, within the experimental error, the particle PL properties. PL was stable in ambient air for up to 4 months. Dispersion in water considerably diminishes the particle emission and causes a loss of the peak resolution of the emission spectrum.
Figure 6.
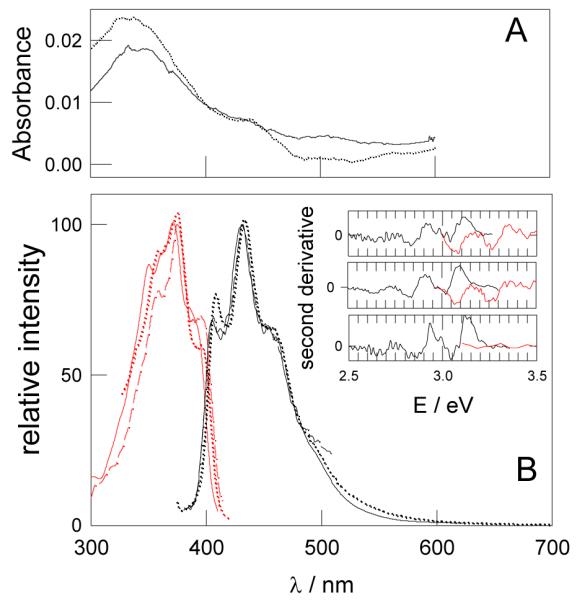
A: Absorption spectra (uncorrected for scattering) of argon-saturated toluene suspensions of MMASi-NPB (full line) and HOSi-NPB (dashed line). B: Excitation (red) and emission (black) spectra of toluene suspensions of HOSi-NPB (dashed lines), MeSi-NPB (full line) and MMASi-NPB (dotted line). Inset: second derivative of the emission and excitation spectra of the main figure. From top to bottom: MeSi-NPB, MMASi-NPB and HOSi-NPB.
Emission and excitation in the same spectral region was also reported for 5 nm partially surface oxidized organically-capped Si-NPs11 and for 3-4 nm octylcapped Si-NP.13 However, despite the emission is in the same wavelength region, the spectrum and its dependence on the excitation wavelength differ from those reported here.
Both, the emission and the excitation spectra, show peaks with a constant spacing of approximately 0.2 eV, as shown by the separation between minima in the second derivative spectra displayed in figure 6B inset. A peak structure in the photoluminescence of electrochemically synthesized Si-NPs was previously reported40, 41 and attributed either to the contribution of Si nanocrystals with specific number of atoms and surface configuration40 or to the presence of oxygen on the particle surface.41 The fine peak structure was not affected by the length of the alkyl chain of the surface attached hydrocarbons nor by the variation of the excitation wavelength40, in coincidence with our observations, but showed excitation wavelength-dependent relative emission intensity. Peak resolution in the absorption and emission spectrum of nanometer size Si-NPs synthesized by chemical reaction of Si precursors in solution was attributed to the participation of vibrations of silicon-bonded surface groups due to the surface localization of the LUMO.1 As a consequence electronic excitation of the NPs yields a shift in the electron density towards the surface of the NPs, with a concomitant change in geometry. As discussed above, HOSi-NPB, MeSi-NPB and MMASi-NPB are covered by surface siloxane networks and, except for HOSi-NPB, they do not show vibrations of 0.2 eV in their IR spectrum (IR peaks at 1630 cm−1). We therefore suggest that Si-SiO2 networks may either induce specific surface configurations or else undergo multiple vibrations of negligible IR absorption leading to the observed peak resolution. The red luminescence observed for the bigger particles does not show vibrational features, as expected for larger systems where the wave functions approach those of simple quantum confinement independent on the oxidation of the surface.2
From the absorption and emission spectra, a FWHM of ~ 70 nm and a Stokes shift due to the energy difference of ~ 0.47 eV between the absorption and emission maximum peaks are determined. Theoretical and experimental studies on CdS and CdSe NPs indicate that particles with broad emission and large Stokes shift are considered to exhibit emission originated from the recombination of holes and trapped electrons due to surface irregularities.42 Both, the latter observations and the peak resolution of the excitation and emission spectra indicate that the luminescence of the synthesized Si-NPs is dominated by surface interactions which are present in underivatized and derivatized NPs.
To determine the quantum yields of luminescence, Φ, 9, 10-diphenylantracene in cyclohexane (ΦR = 0.90 ± 0.04) was used as a reference emitter.20 A comparison of the ratios between the area of the emission spectrum and the absorbance at a given excitation wavelength yields the quantum efficiency of MMASi-NPs.43 Table 1 shows the values of Φ obtained at different excitation wavelengths for Si-NPB and MMASi-NPB in air-saturated suspensions. The measured quantum yields of the latter particles decrease with decreasing wavelengths, as also observed for 1 nm alkyl-capped Si-NPs.1 Scattering of light by NPs causes the measured attenuance to be higher than the actual absorbance, as the scattered part of the incoming light is recorded as absorption but does not necessarily excite the sample and therefore it does not result in any recorded emission. Scattering depends on the wavelength of the incoming light as γ −4o and is proportional to the square of the particle volume, (vp 2).42 Assuming a (γ/ 370)−4 correction for the dispersion of light, the corrected quantum yields, Φcorr also listed in Table 1, show, within the experimental error, no dependence on the excitation wavelength. A wavelength independent quantum yield is expected for an excitonic transition, as is the case for fluorescent molecules with emission from only one excited state. The latter considerations are in agreement with the observation of mainly one luminescence decay time (vide infra) and an emission spectrum independent of the excitation wavelength. The measured values are on the order reported for other Si-NPs, despite their different crystallinity.12, 13
Table 1.
Room temperature quantum yield, Φ, of air-saturated toluene suspensions of MMASi-NPB and HOSi-NPB as a function of the excitation wavelength, λexc. Corrected quantum yields, Φcorr, assume a (λexc/ 370)−4 correction for the dispersion of light (see text).
| MMASi-NPB | HOSi-NPB | |||
|---|---|---|---|---|
| λexc / nm | Φ | Φ corr | Φ | Φ corr |
| 340 | 0.28 ± 0.04 | 0.40 ± 0.04 | 0.19 ± 0.03 | 0.26 ± 0.03 |
| 350 | 0.34 ± 0.05 | 0.43 ± 0.05 | 0.22 ± 0.03 | 0.27 ± 0.03 |
| 360 | 0.41 ± 0.06 | 0.45 ± 0.06 | 0.25 ± 0.04 | 0.27 ± 0.04 |
| 370 | 0.48 ± 0.07 | 0.48 ± 0.07 | 0.28 ± 0.04 | 0.28 ± 0.04 |
Higher quantum yields are observed for MMASi-NPB than for HOSi-NPB, which therefore indicates that the particle photoluminescence is not quenched by surface derivatization with MMA.
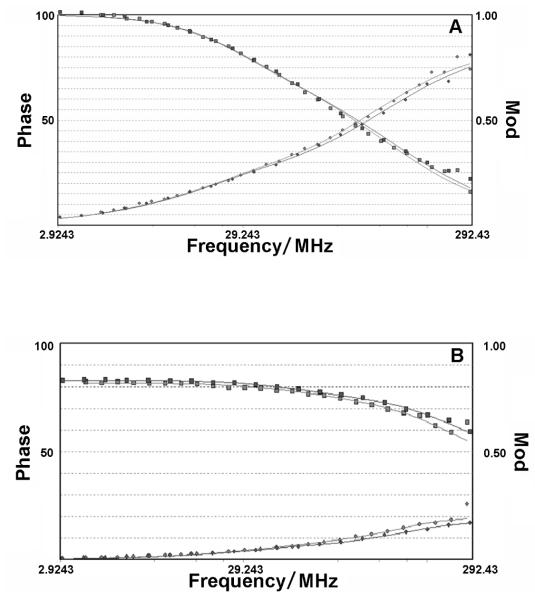
Luminescence time-resolved experiments indicate a rapid relaxation of electronically excited Si-NPs to the ground state. The modulation and phase curves obtained from the frequency-domain experiments of air-saturated suspensions of the particles may be well fitted if two decay lifetime components are considered (see figure 7A). The fitting parameters obtained for HOSi-NPB curves suggest a short lifetime component of (1.1 ± 0.1) ns contributing to a 78-88 % of the total luminescence, and a longer component of (5.8 ± 0.3) ns responsible for the remaining 22-12 % of the emitted light. MMASi-NPB parameters indicate almost the same lifetimes, (1.1 ± 0.1) ns with a 95-97 % contribution to the emitted light, and a very small contribution of a longer component of (4.6 ± 0.4) ns. Since both underivatized and MMA derivatized particles were obtained from the same synthetic batch, the differences in size distribution and surface configuration are expected to be negligible. However, HOSi-NPBs are observed to agglomerate with aging. The observation of almost one lifetime component for MMASi-NPs seems to be in line with the fact that these particles are less prone to agglomeration, as also indicated by the long stability of their suspensions (vide supra). Particle agglomeration may also be a cause for the lower quantum yields observed for HOSi-NPB suspensions.
Figure 7.
Frequency-domain experiments performed for air-saturated toluene suspensions of HOSi-NPs. A: luminescence decay and B: luminescence decay anisotropy measurements. Each figure shows the results of two experiments. Circles and squares stand for phase and modulation curves, respectively.
The shorter component, responsible for most part of the emission, supports a direct band gap transition. In fact, the general observations on the photophysical properties of the particles show some similarity with early publications on PS44 which report transformation of PS μs red luminescence into fast 1–10 ns blue luminescence (centered at 480 nm) after thermal and chemical surface oxidation.
Anisotropy frequency-domain experiments, through the determination of the rotational correlation times (Θi) and the anisotropy at time zero (ro), give information on the shape of the particles and on the relative orientation of the excited- and fundamental state dipole moments of the particles. These experiments show that the anisotropy of HOSi-NPB and MMASi-NPB follow a single exponential anisotropy decay, r(t) = ro×exp(t/Θ), see Figure 7B for a typical experiment. This can only be the case if the emission originates mainly from one population of particles with identical three perpendicular rotational axes. This indicates that Si-NPs are ball-shaped, as also observed by TEM. Table 2 summarizes the results obtained. Both particles show, within the experimental error, the same ro which therefore indicates that the dipole orientation of the excited states leading to the observed luminescence does not depend on surface coverage. The value ro = 0.25, clearly indicates a different orientation of the fundamental and excited state dipole moments, also in agreement with the large Stokes shift between the excitation and emission spectrum. A similar value was obtained for CdS/dendrimer NPs.43
Table 2.
Anisotropy at time zero (ro) and rotational correlation times (θ) obtained from frequency-domain experiments performed for air-saturated toluene suspensions of HOSi-NPB and MMASi-NPB.
| ro | θ / ns | |
|---|---|---|
| HOSi-NPB | 0.25 ± 0.02 | 0.62 ± 0.01 |
| MMASi-NPB | 0.26 ± 0.01 | 0.25 ± 0.01 |
The dependence of Θ on the volume (V) for spherical particles, given by the simple hydrodynamic theory of the rotational diffusion is: Θ = η×V / kB×T, where kB is the Boltzmann constant and η = 554.2 μPas is the shear viscosity of toluene at 298 K. From this relation, a mean ratio of 1.1 nm and of 0.8 nm is predicted for HOSi-NPB and MMASi-NPB, respectively. Since mainly HOSi-NPB suspensions show agglomeration, and these suspensions show a large lifetime component contributing around 22 – 12 % to the total emitted light, the larger value observed for the mean radius of this particles is probably due to the contribution of agglomerated particles.
The biphotonic excitation spectrum of HOSi-NPB and MMASi-NPB was also measured to obtain further information on their potential use as luminescence markers in biological systems, as the use of near infrared radiation in a two-photon process is less damaging to the sample. This spectrum provides better discrimination against scattered incident radiation, as well as better definition of the probed volume.45 A blue emission is observed when toluene suspensions of MMASi-NPB and of HOSi-NPB are excited by the pulsed laser in the 750 – 880 nm range in a two-photon process. The corresponding excitation spectra are shown in Figure 8.
Figure 8.
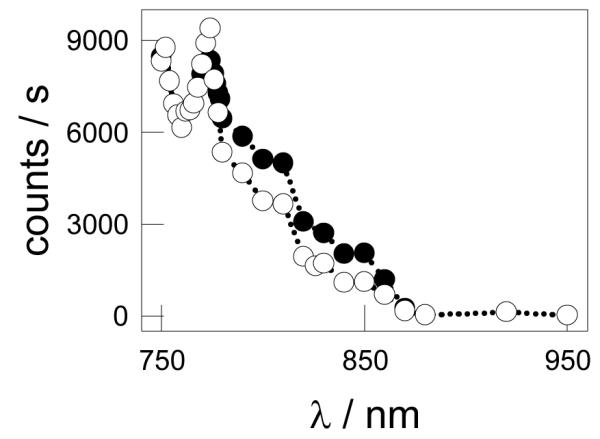
biphotonic excitation spectrum of air-saturated toluene suspensions of HOSi-NPB (●) and MMASi-NPB (엯).
In multiphoton excitation processes, higher intensities are needed to induce excitation, thus the effective excitation volume is restricted to the central portion of the focal spot where the intensity is the highest, allowing fluctuating signals for nanomolar solutions of fluorophores to be detected. Under these conditions, measurements of the photon counts with time, P(t), yield luminescence fluctuations, δP(t), around the mean value that are auto-correlated with time. The luminescence correlation function G(τ) contains the information of amplitude of fluctuations as well as of their persistence, which yield information on size, brightness, and number density.45 For a single species the autocorrelation function at τ =0, G(0), is proportional to the inverse of the average number of the emitting species in the focal volume. Table 3 depicts the results of the analysis of the autocorrelation functions obtained for the different experimental conditions.
Table 3.
PCH and fluorescence correlation obtained for HOSi-NPB and MMASi-NPB under different experimental conditions.
| Excitation wavelength (A) / nm |
Molecular brightness /counts s−1 molecule−1 |
<N> | 1/G(0) | D/ μm2s−1 |
r / nm |
|
|---|---|---|---|---|---|---|
| HOSi-NP | 774.0 (1) | 0.176 | 1.0 | 500 | 172 | 2.3 |
| 1/10 diluted | 774.0 (1) | 0.176 | 0.09 | 22 | 136 | 2.9 |
| MMASi-NP | 750.0 (0.54) | 0.094 | 1.6 | 150 ± 50 | 120 ± 80 | 3.3±1 |
| 800.0 (0.54) | 0.093 | 1.2 | 93.5 | 392.5 | 1.0 | |
| 826.0 (0.54) | 0.028 | 1.2 | 15 ± 0.5 | 245 ± 2 | 1.6 | |
| 840.0 (0.54) | 0.023 | 1.0 | 23.5 | 206 | 1.9 | |
| 860.0 (0.54) | 0.024 | 1.0 | 11 | 246 | 1.6 | |
| Rhodamine 110 | 800 (0.54) | 0.131 | 0.75 | ------ | ------ | ----- |
G(0) is the fluorescence correlation at τ = 0. “A” stands for the absorbance of the filter on the excitation pathway.
The luminescence correlation observed for HOSi-NPB upon 774 nm irradiation may be well fitted to one diffusing species with average diffusion coefficient D = (150 ± 20)×10−12 m2 /s. Experiments with 1:10 diluted suspensions show similar D values but lower 1/G(0) values (see Table 3).
The autocorrelation functions for MMASi-NPB were obtained by exciting at different wavelengths. Except for experiments at 774 nm, all G(τ) curves could be well fitted to one diffusing species (see Figure 9A for a typical curve) with an average diffusion coefficient of (240 ± 40)×10−12 m2 /s in toluene. At 774 nm, correlation curves could only be fitted if two different diffusing species are assumed. Because the different behavior was only observed for 774 nm these data were not used for further calculations.
Figure 9.
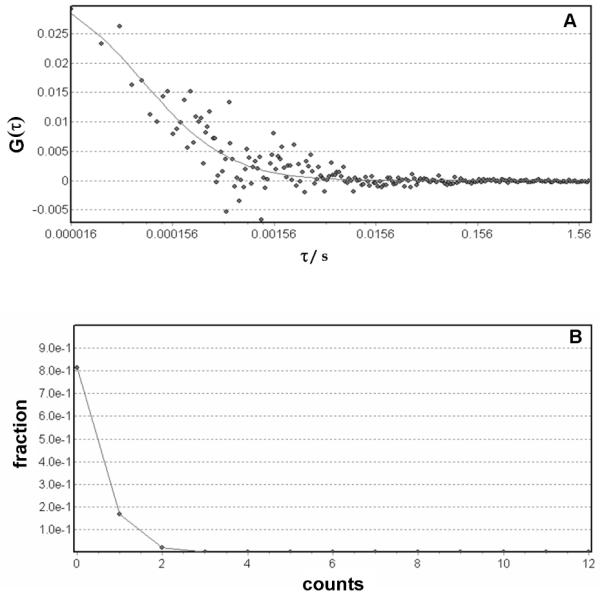
A: Luminescence autocorrelation observed for air-saturated toluene suspensions of MMASi-NPB obtained exciting with light of 826 nm. B: Photon correlation histogram (PCH) obtained from the experiments in figure A.
According to our previous results (vide supra), the particles may be assumed spherical. Therefore, the Stokes – Einstein equation was used for the calculation of the hydrodynamic radius of the particle taking η = 554.2 μPas for the viscosity of toluene at 298 K, see Table 3. An average radius of (1.5 ± 0.2) nm is obtained for MMASi-NPB, in agreement with the value measured by TEM (vide supra). A mean hydrodynamic radius of (2.6 ± 0.3) nm is obtained for HOSi-NPB, higher than that of the derivatized particles. The trend observed for the average radius of HOSi-NPB and MMASi-NPB particles is in agreement with those obtained from the luminescence anisotropy experiments, further supporting the contribution of agglomerated particles in the suspensions of HOSi-NPB used for these experiments.
The analysis of amplitudes of the luminescence fluctuations δP(t) is achieved by the Photon Counting Histogram (PCH) method (frequency of observation vs photon counts), measured within a suitable time window of ~ 8 ms. The deviation of the histogram from the ideal Poisson distribution contains information on the average number of particles in the excitation volume (<N>) and on the molecular brightness (η). Figure 9B shows the histogram obtained for a typical experiment and Table 3 depicts the number density and brightness values obtained in experiments performed under different experimental conditions.
<N> defined as the product of C×Vo×NA (where C is the molar concentration of particles, Vo the excitation volume, and NA Avogadro’s constant) is expected to be independent of the excitation wavelength. The variations observed in experiments with different excitation wavelengths but otherwise identical conditions may be due to a variation in Vo .46
In analogy to the monophotonic brightness (the product of the absorption coefficient and the fluorescence quantum yield), the “brightness” of a fluorophore under two-photon excitation is a quantitative measure of the product σ2×ϕ were σ2 is the two-photon absorption cross-section. Since the excited state from which emission takes place is identical for both one and two-photon excitation, the fluorescence quantum yield may be assumed the same under one- and two-photon excitation.47 Therefore, brightness measurements yield information on the two-photon absorption cross-sections of the NPs.
The measured brightness values are dependent on the intrinsic properties of the fluorophore and design of optics and are not affected by concentration. In fact, under identical set-up excitation and emission conditions, the brightness obtained for suspensions of different HOSi-NPB concentrations are coincident, and the values of <N> are correlated with the suspension concentration, as shown in Table 3. To obtain absolute brightness values, rhodamine 110 was used as a standard and its PCH measured at 800 nm under identical experimental conditions to those used for the NPs. Assuming an absolute brightness of rhodamine 110 at 800 nm of σ2Φ≅ 40 GM (Göppert-Mayer units, 1 GM = 1×10−50 cm4 s /photon),48 the measured brightness of 0.131 counts s−1 molecule−1 is equivalent to 40 GM. Therefore, the brightness of 0.093 counts s−1 molecule−1 measured at 800 nm for MMASi-NPB corresponds to an absolute brightness of 28 GM from which σ2 800nm ≅ 64 GM is obtained taking Φ ≅ 0.44 (vide supra), the quantum yield in air-saturated suspensions. The obtained σ2 value is of the order of those reported for organic fluorophores.47,49
Conclusions
The results herein obtained from steady-state and time-resolved measurements (including the anisotropy studies) indicate that room temperature PL of Si-NPs of (3 ± 1) nm diameter and surface composition Si3O6R, synthesized by the electrochemical etching of silicon wafers, is not influenced by the nature of the surface groups for R: C5O2H2, CH3 or OH. However, functionalization with the organic groups lends the particles higher stability in suspension. Moreover, time-resolved anisotropy measurements, FCS and TEM images reveal that the particles are ball-shaped and confirm the monodispersity of the species under study. The short lifetime of 1 ns observed for the decay of the luminescence is consistent with what would be expected from molecular species and therefore supports a direct band gap transition which could result from the rapid trapping of the excitation at the nanocrystal surface. The participation of surface irregularities in the emission originated from the recombination of holes and trapped electrons is further supported by the value of ro and the large Stokes shift. Measured brightness and quantum yields are on the order of those observed for common organic fluorophors. The evidence obtained suggests that the particle size clearly determines the emission and excitation spectral region, as expected from quantum confinement, but the presence and extent of Si-SiO3 species on the silicon networks seem crucial in determining the characteristics of the emission and probably that of the surface configuration, lending the particles a PL behavior similar to those of organic fluorophors.
The PL bands and Stokes shifts reported for Si29H24 nanoclusters were theoretically explained in terms of intrinsic molecular like excited states of the ideal bulklike silicon configuration, and some of the bands were suggested to originate from similar particles with different surface reconstructions.9 Despite that theoretical studies agree in predicting that the replacement of hydrogen atoms with oxygen atoms induce remarkable changes in the spectroscopic properties of the silicon dots, much work is still needed to understand the effect of surface oxidation on surface configuration and on the optical properties of small particles.
Supplementary Material
Acknowledgements
The frequency-domain fluorescence and anisotropy measurements, and fluorescence correlation spectroscopy experiments reported in this paper were performed at the Laboratory for Fluorescence Dynamics (LFD) at the University of California, Irvine (UCI). The LFD is supported jointly by the National Center for Research Resources of the National Institutes of Health (PHS 5 P41-RR003155) and UCI. The authors thank Professor Silvia Braslavsky for her useful comments and discussions related to this work. Drs. Guillermo Benitez and Aldo Rubbert (INIFTA, University of La Plata, Argentina) are thanked for the XPS spectrum and Antonio Arques Sanz (Universidad Politécnica de Valencia, Spain) for obtaining the TEM images. This work has been supported by projects PIP 6301 and 1542/06 from Consejo Nacional de Investigaciones Científicas y Tecnológicas (CONICET), Argentina. M.C.G., M.L.K. and D.B.S. are research members of CONICET. F.R.N., D.O.M. and J.I.A. are research members of Comisión de investigaciones Científicas de la Provincia de Buenos Aires (CICPBA). M.J.L.P. thanks CONICET for a studentship.
Abbreviations
- ATR-IR
Attenuated total reflection infrared
- FCS
Fluorescence correlation spectroscopy
- FTIR
Fourier transformed infrared spectroscopy
- MeSi-NPB
Methanol functionalized blue emitting nanoparticles
- MMA
Methyl 2-methylprop-2-enoate
- MMASi-NPB
Methyl 2-methylprop-2-enoate functionalized nanoparticles
- NPs
Nanoparticles
- PL
Photoluminescence
- PS
Porous silica
- SiO2-NPs
Silica nanoparticles
- Si-NPs
Silicon nanoparticles
- TEM
Transmission electron microscopy
- HOSi-NPB
Underivatized blue-emitting particles
- XPS
X-ray photoelectron spectroscopy
References and Notes
- (1).Rosso-Vasic M, Spruijt E, Van Lagen B, De Cola L, Zuilhof H. Alkyl-functionalized oxide-free silicon nanoparticles: synthesis and optical properties. Small. 2008;4:1835–1841. doi: 10.1002/smll.200800066. [DOI] [PubMed] [Google Scholar]
- (2).Wolkin MV, Jorne J, Fauchet PM, Allan G, Delerue C. Electronic states and luminescence in porous silicon quantum dots: the role of oxygen. Phys. Rev. Lett. 1999;82:197–200. [Google Scholar]
- (3).Belomoin G, Therrien J, Nayfeh M. Oxide and hydrogen capped ultrasmall blue luminescent Si nanoparticles. Appl. Phys. Lett. 2000;77:779–781. [Google Scholar]
- (4).Choi J, Wang NS, Reipa V. Photoassisted tuning of silicon nanocrystal photoluminescence. Langmuir. 2007;23:3388–3394. doi: 10.1021/la062906+. [DOI] [PubMed] [Google Scholar]
- (5).Michalet X, Pinaud FF, Bentolila LA, Tsay JM, Doose S, Li JJ, Sundaresan G, Wu AM, Gambhir SS, Weiss S. Quantum dots for live cells, in vivo imaging, and diagnostics. Science. 2005;307:538–544. doi: 10.1126/science.1104274. [DOI] [PMC free article] [PubMed] [Google Scholar]
- (6).Canham L. Gaining light from silicon. Nature. 2000;408:411–412. doi: 10.1038/35044156. [DOI] [PubMed] [Google Scholar]
- (7).Bley RA, Kauzlarich SM, Davis JE, Lee HWH. Characterization of silicon nanoparticles prepared from porous silicon. Chem. Mater. 1996;8:1881–1888. [Google Scholar]
- (8).Rogozhina EV, Eckhoff DA, Gratton E, Braun PV. Carboxyl functionalization of ultrasmall luminescent silicon nanoparticles through thermal hydrosilylation. J. Mater. Chem. 2006;16:1421–1430. [Google Scholar]
- (9).Rao S, Sutin J, Clegg R, Gratton E, Nayfeh MH, Habbal S, Tsolakidis A, Martin R. M.Excited states of tetrahedral single-core Si29 nanoparticles. Phys. Rev .B. 2004;69:20531, 7. [Google Scholar]
- (10).Liu SM. Luminescent silicon nanoparticles formed in solution. J Nanosci Nanotechnol. 2008;8:1110–1125. [PubMed] [Google Scholar]
- (11).Hua F, Erogbogbo F, Swihart MT, Ruckenstein E. Organically capped silicon nanoparticles with blue photoluminescence prepared by hydrosilylation followed by oxidation. Langmuir. 2006;22:4363–4370. doi: 10.1021/la0529106. [DOI] [PubMed] [Google Scholar]
- (12).Sankaran RM, Holunga D, Flagan RC, Giapis KP. Synthesis of blue luminescent Si nanoparticles using atmospheric-pressure microdischarges. Nano Letters. 2005;5:537–541. doi: 10.1021/nl0480060. [DOI] [PubMed] [Google Scholar]
- (13).Zhang X, Neiner D, Wang S, Louie AY, Kauzlarich SM. A new solution route to hydrogen-terminated silicon nanoparticles: synthesis, functionalization and water stability. Nanotechnology. 2007;18:095601, 6. doi: 10.1088/0957-4484/18/9/095601. [DOI] [PMC free article] [PubMed] [Google Scholar]
- (14).Pradhan S, Chen S, Zou J, Kauzlarich SM. Photoconductivity of Langmuir-Blodgett monolayers of silicon nanoparticles. J. Phys. Chem. C. 2008;112:13292–13298. [Google Scholar]
- (15).Kanemitsu Y. Efficient light emission from crystalline and amorphous silicon nanostructures. Journal of Luminescence. 2002;100:209–217. [Google Scholar]
- (16).Mitas L, Therrien J, Twesten R, Belomoin G, Nayfeh MH. Effect of surface reconstruction on the structural prototypes of ultrasmall ultrabright Si29 nanoparticles. Appl. Phys. Lett. 2001;78:1918–1920. [Google Scholar]
- (17).Zhou Z, Brus L, Friesner R. Electronic structure and luminescence of 1.1- and 1.4-nm silicon nanocrystals: Oxide shell versus hydrogen passivation. Nano Letters. 2003;3:163–167. [Google Scholar]
- (18).Yamani Z, Thompson WH, AbuHassan L, Nayfeh MH. Ideal anodization of silicon. Appl. Phys. Lett. 1997;70:3404–3406. [Google Scholar]
- (19).Valenta J, Janda P, Dohnalova K, Nižňansky D, Vácha F, Linnros J. Colloidal suspensions of silicon nanocrystals: from single nanocrystals to photonic structures. Optical Materials. 2005;27:1046–1049. [Google Scholar]
- (20).Li X, He Y, Swihart MT. Surface functionalization of silicon nanoparticles produced by laser-driven pyrolysis of silane followed by HF-HNO3 etching. Langmuir. 2004;20:4720–4727. doi: 10.1021/la036219j. [DOI] [PubMed] [Google Scholar]
- (21).Hua F, Erogbogbo F, Swihart MT, Ruckenstein Efficient surface grafting of luminescent silicon quantum dots by photoinitiated hydrosilylation. Langmuir. 2005;21:6054–6062. doi: 10.1021/la0509394. [DOI] [PubMed] [Google Scholar]
- (22).Hamal S, Hirayama F. Actinometric Determination of Absolute Fluorescence Quantum Yields. J. Phys. Chem. 1983;87:83–89. [Google Scholar]
- (23).Scurlock RD, Ogilby PR. Singlet molecular oxygen (1ΔgO2) formation upon irradiation of an oxygen (3∑g −O2)-organic molecule charge –transfer absorption band. J. Phys. Chem. 1989;93:5493–5500. [Google Scholar]
- (24).Mueller JD, Gratton E. High –Pressure Fluorescence Correlation Spectroscopy. Biophys. J. 2003;85:2711–2719. doi: 10.1016/s0006-3495(03)74694-3. [DOI] [PMC free article] [PubMed] [Google Scholar]
- (25).Valeur B. Molecular Fluorescence. Principles and applications. Angew. Chem. Int. Ed. Engl. 2002;41:3063–3064. [Google Scholar]
- (26).San Roman E, Gonzalez MC. Photochemistry of aqueous solutions of triphenyltetrazolium chloride. J. Phys. Chem. 1989;93:3536–3540. [Google Scholar]
- (27).Kravetz VG, Meier C, Konjhodzic D, Lorke A. Infrared properties of silicon nanoparticles. J. Appl. Phys. 2005;97:084306. [Google Scholar]
- (28).Li ZF, Swihart MT, Ruckenstein E. Luminescent silicon nanoparticles capped by conductive polyaniline through the self-assembly method. Langmuir. 2004;20:1963–1971. [Google Scholar]
- (29).Bateman JE, Horrocks BR, Houlton A. Reactions of water and methanol at hydrogen-terminated silicon surfaces studied by transmission FTIR. J. Chem. Soc. 1997;93:2427–2431. [Google Scholar]
- (30).Sweryda-Krawiec B, Cassagneau T, Fendler JH. Modification of silicon nanocrystallites by alcohols. J. Phys. Chem. B. 1999;103:9524–9529. [Google Scholar]
- (31).Kim NY, Laibinis PE. Improved polypyrrole/ silicon junctions by surfacial modification of hydrogen-terminated silicon using organolithium reagents. J. Am. Chem. Soc. 1999;121:7162–7163. [Google Scholar]
- (32).Ruiz AE, Caregnato P, Arce VB, Schiavoni MM, Mora VC, Gonzalez MC, Allegretti PE, Mártire DO. Synthesis and characterization of butoxylated silica nanoparticles. reaction with benzophenone triplet states. J. Phys. Chem. C. 2007;111:7623–7628. [Google Scholar]
- (33).Ma LB, Ji AL, Liu C, Wang YQ, Cao ZX. Low temperature growth of amorphous Si nanoparticles in oxide matrix for efficient visible photoluminescence. J. Vac. Sci. Technol. B. 2004;22:2654–2657. [Google Scholar]
- (34).Sun Q-Y, Louis C. P. M. de Smet, Van Lagen B, Giesbers M, Thne PC, Van Engelenburg J, de Wolf FA, Zuilhof H, Sudhlter EJR. Covalently attached monolayers on crystalline hydrogen-terminated silicon: extremely mild attachment by visible light. J. Am. Chem. Soc. 2005;127:2514–2523. doi: 10.1021/ja045359s. [DOI] [PubMed] [Google Scholar]
- (35).Larson GL, Arkles B, Anderson R. Silicon compounds, register and review. Petrarch Systems. 1987 [Google Scholar]
- (36).Chung TH. Effects of process parameters on the properties of silicon oxide films using plasma enhanced chemical vapor deposition with tetramethoxysilane. Current Applied Physics. 2009;9:598–604. [Google Scholar]
- (37).Jum MA, Feng QY, Shi LH, Xu J. Preliminary study on pyrolysis of polymethylsilsesquioxane by FT-IR and XPS. Chinese Chemical Letters. 2002;13:75–78. [Google Scholar]
- (38).Sorarú GD, Andrea GD, Glisenti A. XPS characterization of gel-derived silicon oxycarbide glasses. Materials Letters. 1996;27:1–5. [Google Scholar]
- (39).Nguyen TP, Lefrant S. XPS study of SiO thin films and SiO-metal interfaces. J. Phys. Condens. Matter l. 1989:5197–5204. [Google Scholar]
- (40).Dobrovolskas D, Mickevičius J, Tamulaitis G, Reipa V. Photoluminescence of Si nanocrystals under selective excitation. J. of Physics and Chemistry of Solids. 2009;70:439–443. [Google Scholar]
- (41).Holmes JD, Ziegler KJ, Doty RC, Pell LE, Johnston KP, Korgel BA. Highly luminescent silicon nanocrystals with discrete optical transitions. J. Am. Chem. Soc. 2001;123:3743–3748. doi: 10.1021/ja002956f. [DOI] [PubMed] [Google Scholar]
- (42).Landes CF, Link S, Mohamed MB, Nikoobakht B, El-Sayed MA. Some properties of spherical and rod-shaped semiconductor and metal nanocrystals. Pure Appl. Chem. 2002;74:1675–1692. [Google Scholar]
- (43).Lakowicz JR, Gryczynski I, Gryczynski Z, Murphy CJ. Luminescence spectral properties of CdS nanoparticles. J. Phys. Chem. B. 1999;103:7613–7620. doi: 10.1021/jp991469n. [DOI] [PMC free article] [PubMed] [Google Scholar]
- (44).Tsybeskov L, Vandeshev JV, Fauchet PM. Blue emission in porous silicon: oxygen-related photoluminescence. Phys. Rev. B. 1994;49:R7821. doi: 10.1103/physrevb.49.7821. [DOI] [PubMed] [Google Scholar]
- (45).Akcakir O, Therrien J, Belomoin G, Barry N, Muller JD, Gratton E, Nayfeh M. Detection of luminescent single ultrasmall silicon nanoparticles using fluctuation correlation spectroscopy. Appl. Phys. Lett. 2000;76:1857–1859. [Google Scholar]
- (46).Chirico G, Bettati S, Mozzarelli A, Chen Y, Mueller JD, Gratton E. Molecular heterogeneity of O-acetylserine sulfhydrylase by two-photon excited fluorescence fluctuation spectroscopy. Biophys. Journal. 2001;80:1973–1985. doi: 10.1016/S0006-3495(01)76167-X. [DOI] [PMC free article] [PubMed] [Google Scholar]
- (47).Lebret V, Raehm L, Durand J, Smaïhi M, Gérardin C, Nerambourg N, Werts MHV, Blanchard-Desce M. Synthesis and characterization of fluorescently doped mesoporous nanoparticles for two-photon excitation. Chem. Mater. 2008;20:2174–2183. [Google Scholar]
- (48).Gratton E. Internet address up to April 2009: http://www.fluorescence-foundation.org/lectures/genova2007/lecture6.pdf.
- (49).Xu C, Webb WW. Measurement of two-photon excitation cross sections of molecular fluorophores with data from 690 to 1050 nm. J. Opt. Soc. Am. B. 1996;13:481–491. [Google Scholar]
Associated Data
This section collects any data citations, data availability statements, or supplementary materials included in this article.


