Abstract
In view of the fact that memory effects associated with instrument calibration hinder the use of many m/z and tuning standards, identification of robust, comprehensive, inexpensive, and memory-free calibration standards are of particular interest to the mass spectrometry community. Glucose and its isomers are known to have a residue mass of 162.05282 Da; therefore, both linear and branched forms of poly-hexose oligosaccharides possess well defined masses making them ideal candidates for mass calibration. Using a wide range of maltooligosaccharides (MOS) derived from commercially available beers, ions with m/z ratios from ~500 Da to 2500 Da or more have been observed using Fourier transform ion cyclotron resonance mass spectrometry (FT-ICR-MS) and time of flight mass spectrometry (TOF-MS). The mixtures of MOS were further characterized using infrared multiphoton dissociation (IRMPD) and nano-liquid chromatography/mass spectrometry (nano-LC/MS). In addition to providing well defined series of positive and negative calibrant ions using either ESI or MALDI, the MOS are not encumbered by memory effects and are thus well suited mass calibration and instrument tuning standards for carbohydrate analysis.
Keywords: mass calibration, electrospray ionization, matrix-assisted laser desorption/ionization, oligosaccharide, porous-graphitized carbon, infrared multiphoton dissociation
INTRODUCTION
Accurate and precise mass-to-charge calibration is the fundamental tenet from which all subsequent mass spectrometry measurements and results are derived. Therefore, it is of great importance that compounds used for calibration are well characterized and produce clearly defined m/z ratios in the range of analytical interest. When possible, internal calibration is preferred over external methods; however, in practice, external calibration is often the only available method. A suitable calibrant behaves chemically in a manner that closely relates to the analyte throughout all stages of an experiment. An isotopically labeled version of the analyte is ideal, though such compounds are not always available and may be prohibitively expensive. To accommodate the needs of the many ionization sources compatible with mass spectrometry, a wide range of calibration methods and standards have been developed.
Perfluorinated organics such as perfluorokerosene (PFK) and Perfluorotributylamine (FC-43) have been used extensively with electron impact (EI) and chemical ionization (CI) and are well suited to the m/z range associated with typical gas chromatographic analysis (<1000 m/z) [1,2]. However, these compounds are often plagued by memory effects that interfere with subsequent analyses. Calibration compounds for fast-atom bombardment (FAB) have also included perfluorinated species: specifically, perfluoroalkylphosphazine (Ultramark 1621) [3], polypropylene glycol (PPG) [4], polyethylene glycol (PEG) [5], poly(ethylene/propylene) oxides [6], and iodide salts [7]. These compounds have an extended mass range (up to ~2000 m/z) but are also encumbered by source contamination following calibration. While iodide salt solutions may be tailored to reduce memory effects, these salts must be clustered with polymeric organics in order to obtain high m/z ratios (i.e. 10,000 m/z) [8]. Unfortunately, these polymeric organics once again introduce the problems associated with calibrant memory effects.
The need for broad mass range, dual polarity, carryover free calibrants has rapidly expanded with the concurrent rise of electrospray ionization (ESI) [9], matrix-assisted laser desorption/ionization (MALDI) [10], and efforts focusing on systems biology using mass spectrometry. Many of the calibration compounds used for FAB have been ported to these newer ionization sources, though their drawbacks have only been slightly mitigated [8–13]. In order to mimic actual samples and minimize memory effects, mixtures of highly purified peptides and proteins have proven extremely effective for higher mass calibration—especially trypsin autolysis peptides [14]. While these standards are adequate for proteomics efforts, the instrumental parameters necessary for their observation are often varied and highly specific. For example, instrumental operating conditions used for calibration using water clusters can be drastically different than those necessary for analysis (e.g. low temperature source conditions are often necessary to observed water clustering) [15]. Being no less important than proteomics, the areas of glycomics and glycoproteomics also require appropriate standards for mass calibration and instrument tuning. In contrast to peptides and proteins, carbohydrates are usually observed as singly charged species using ESI and MALDI in both positive and negative modes and often require different operating conditions. Despite being one of the most ubiquitous classes of organic compounds on earth, naturally occurring and synthetic glycan standards are often difficult to prepare and are exceedingly expensive, thus reducing their utility as everyday mass and tuning calibrants. Our efforts to identify suitable carbohydrate standards for mass calibration and instrumental tuning have identified a commonly available source of highly specific carbohydrates in beer.
Prior to fermentation the primary sources of carbohydrates in wort include starch, pentosan, β-glucan, and cell wall fragments; however, once fermentation begins these carbohydrates are enzymatically digested to form maltooligosaccharides (MOS) in beer with degrees of polymerization (DP) ranging from 3–40 units [16,17]. Carbohydrates with DPs of 3 or less are most often metabolized to form the primary products of fermentation, ethyl alcohol and carbon dioxide, with the remaining carbohydrates residing in solution [17,18]. Using a wide variety of analytical approaches such as capillary electrophoresis [19], liquid chromatography [16,20], fluorescence assisted carbohydrate electrophoresis [21], high performance anion exchange chromatography, nuclear magnetic resonance spectroscopy [16,22], and mass spectrometry, it has been long established that the soluble fraction of beer carbohydrates are comprised of a broad array of hexose polysaccharides. Because glucose and its isomers possess the same residue mass (theoretical monoisotopic mass: 162.05282 Da), by extension polymeric molecules built from these monomers have well defined masses and are prime selections for mass calibration.
Using a number of commercially available beers as sources of MOS, this report outlines the general instrumental operating parameters necessary to utilize the MOS derived from beer as mass calibrants and tuning standards for carbohydrate mass spectrometry. The MOS found in beer may be observed in both ion polarities using either ESI or MALDI, and span a broad mass range (m/z 500–2500 or greater) that could not otherwise be achieved due to the commercial inavailability of pure, higher order MOS. Moreover, beer MOS are easily obtained, relatively inexpensive, consistently distributed across the mass scale, and do not suffer from memory effects common with many polymeric or clustering mass calibrants.
MATERIALS AND METHODS
Chemicals and Materials
Twelve commercially available beers served as sources of the MOS used in this study. Prior to dilution each beer sample was degassed (either by bath sonication or sparging with nitrogen gas until no noticable carbonation remained) and centrifuged (maximum speed in a standard analytical centrifuge for several minutes), and the supernatant was decanted to remove any particulates remaining from the brewing process. For infusion experiments and flow injection analysis using nano-ESI (~200 nL/min), each ale or lager beer was diluted 2500 times (unless otherwise specified) in a 50:50 water:acetonitrile solution containing 0.1% formic acid. For MALDI analysis, each sample was diluted 100 times in 50:50 water:acetonitrile. An enriched MOS preparation was also isolated from beer using solid-phase extraction with porous graphitized carbon (PGC; Thermo HyperSep HyperCarb) [23]. A 100 µL aliquot of degassed beer supernatant was loaded onto the cartridge and washed with three cartridge volumes of deionized water. The oligosaccharides were eluted with 1 mL 50:50 acetonitrile:water and further diluted as described above for ESI and MALDI analysis. To enhance the abundance of the sodiated molecular ions in positive mode ESI, PGC purified MOS mixtures were treated with 10 µM NaCl.
Chromatography and Flow-Injection Analysis
When performing nano-liquid chromatography (nano-LC), each sample was diluted using the initial gradient conditions described below. Nano-LC was performed at 250 nL/min using a 10 cm custom packed PGC stationary phase within a fused silica capillary column (75 µm I.D.×365 µm O.D., Polymicro Technology, Phoenix AZ) [24]. The linear gradient using degassed 18 MΩ water (Solvent A) and acetonitrile (Solvent B), both with 0.1% formic acid, was delivered using an Eksigent 1D nano-LC pump (Livermore, CA). The gradient profile was as follows: 0 min, 98% A; 10 min, 98% A; 50 min; 60% A; 70 min, 20% A; 80 min 20% A. Flow-injection analysis was performed with 50% A at a flow rate of 500 nL/min.
Electrospray Ionization Mass Spectrometry
For analysis by Fourier transform ion cyclotron resonance mass spectrometry (FT-ICR-MS), a Picoview nano-ESI stage (New Objective, Woburn, MA) was held at ±1800–2400 V and used to electrospray the beer solutions into a 9.4 Tesla instrument equipped with external ion accumulation and mass filtration (IonSpec QFT, Irvine, CA). Prior to entering the vacuum stage of the mass spectrometer the electrosprayed ions passed through a sample cone with a 390 micron aperture and traversed a Z-spray (off-axis) ion source (Waters, UK). In addition to the sample cone potential (±60–115 V) the other key component of this ion source was the cone extractor held at ±15 V. Once through the atmospheric pressure interface, ions were externally accumulated in the hexapole (operated at 980 kHz, 200 V base-to-peak amplitude) for up to four seconds prior to injection to the ICR cell via a quadrupole ion guide (operated at 980 kHz, 275 V base-to-peak amplitude). After identifying candidate m/z values for tandem MS, the FT-ICR control software was used to trigger stored-waveform inverse Fourier transform (SWIFT) isolation prior to pulsing a 10.6 µm CO2 laser (Parallax Laser Inc., Waltham, MA) used for infrared multiphoton dissociation (IRMPD). In order to accommodate the disperse ion cloud, the laser beam was expanded to 0.5 cm using an adjustable beam expander (Synrad Laser, Mukilteo, WA) and was directed towards the center of the ICR cell through a BaF2 window (Bicron Corp., Newbury, OH). Product ion formation was optimized by varying the IRMPD laser pulse from 500 ms to 2000 ms. All of the mass spectra shown correspond to the fast Fourier transformation of a 1.024 s transient signal acquired using an ADC rate of 1MHz. The transform was performed after applying a Blackman window for apodization and appending a one order zero fill.
Analysis by time of flight mass spectrometry (TOF-MS) was accomplished using an Agilent Technologies 6200 Series HPLC-Chip/TOF-MS (Santa Clara, CA). MOS samples were delivered by a syringe pump at a flow rate of 300 nL/min. The sample flow was interfaced to the nano-ESI ion source using an infusion-only chip. The ESI capillary potential was held at 1800 V, while the fragmentor potential was held at 425 V and the skimmer potential was held at 160 V. Mass analysis was performed by orthogonal acceleration reflectron TOF in positive ion mode with an acquisition rate of ~1 scan per second.
Matrix-Assisted Laser Desorption/Ionization Mass Spectrometry
MOS samples were co-spotted with the appropriate matrix to produce either positive or negative ions using MALDI. For the positive mode, a matrix solution containing 50 µg/µL 2,5-dihydroxybenzoic acid (DHB) and 5 µM NaCl was prepared in 50:50 acetonitrile:water, and 1 µL of this mixture was co-spotted with 1 µL of the analyte solution. For the negative mode, spots were prepared essentially according to Suzuki et al. [25] using harmine (7-methoxy-1-methyl-9H-pyrido[3,4-b]indole, Sigma Aldrich, St. Louis, MO) as the matrix (prepared at a concentration of 5 µg/µL in 50:50 acetonitrile:water) with a co-matrix of NH4Cl (prepared at a concentration of 100 mM, aqueous). Each 1 µL sample spot was treated with 1 µL of the harmine solution and 1 µL of the NH4Cl solution. All MALDI spots were prepared on a stainless steel sample target and were vacuum dried. MALDI-MS was performed with 7.0 Tesla, external source FT-ICR instrument (IonSpec Pro MALDI). Ions from five to 25 laser pulses (Nd:YAG, 355 nm) were accumulated in a hexapole (operated at 925 kHz, 200 V base-to-peak amplitude) and collisionally cooled using a controlled leak of nitrogen into the hexapole chamber. Ions were then injected into the ICR cell via a quadrupole ion guide (operated at 925 kHz, 500 V base-to-peak amplitude). Detection parameters were essentially the same as those specified for ESI-FT-ICR analysis.
RESULTS AND DISCUSSION
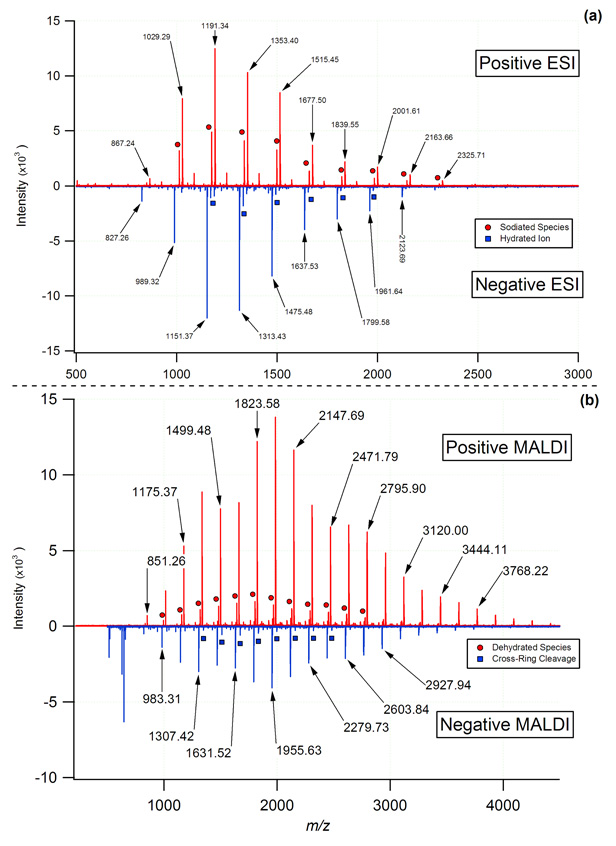
Of the twelve beers examined in this study, representative MOS spectra acquired using both nano-ESI and MALDI ionization sources in both polarities are shown in Figure 1. These spectra demonstrate the evenly spaced (Δm/z 162.05282) yet wide range of m/z values observed for the MOS in beer. It should be noted that each of the nano-ESI beer spectra shown (Figure 1a) were acquired for samples diluted 2500 fold and required only minimal flushing to eliminate the MOS from the system. Given the availability and lack of carry over effects associated with MOS, the observed signal-to-noise ratio could be adjusted by simply altering the MOS dilution factor or by changing the ion accumulation time. In order to assess the relative purity of each beer sample and remove any possible interferants, a carbohydrate enrichment step was performed using solid-phase extraction (SPE) with PGC as described above. Comparison of the enriched fraction to the diluted beer sample indicated that no marked benefit was afforded by the SPE enrichment procedure. Consequently, the commercial beer samples were then used without additional purification.
Figure 1.
Comparison of the commonly observed positively and negatively charged MOS found in beer generated using ESI and MALDI with mass analysis by FT-ICR-MS. While the positive mode ESI was dominated by sodium (circles) and potassium adducts (most abundant series), the carbohydrates observed in the negative mode were primarily observed as deprotonated [M-H]− species and to a very small extent a hydrated series (squares). For MALDI analysis, [M+Na]+ ions were the most abundant series observed, whereas in the negative mode the major series corresponded to products of two sequential cross-ring cleavages (the two most abundant MOS series).
A well known feature of carbohydrates is their strong affinity for alkali earth metals, particularly sodium and potassium [26]. The MOS ions observed in this study were no exception to this trend, with the two most prominent species observed by positive ion nano-ESI being sodium [M+Na]+ and potassium [M+K]+ adducts (Figure 1a, upper trace). For the beer samples examined, small variations in the relative abundance of the two adducts were observed, and were attributed to the varying mineral content of the water used in the brewing process. Lower abundance MOS series were also observed in the positive ESI mode; however, their restricted m/z range limited their use as a calibration series. The MOS ions produced by positive mode MALDI were almost exclusively observed as the [M+Na]+ adducts due to the doping of the sample spots with NaCl (Figure 1b, upper trace). A previous report examining beer MOS reported DP up to 40 (6500.1234 Da, monoisotopic neutral mass) [16,27]. In the present work, the largest MOS observed using nano-ESI corresponded to a DP of 21 (3421.1198 Da, monoisotopic neutral mass), and the largest observed by MALDI corresponded to a DP of 27 (4393.4367 Da). The enhanced m/z range observed using MALDI as compared to ESI was attributed to the absence of an atmospheric pressure interface and differences in the ion transfer optics. No doubt MOS with higher DP are present in beer; however, their low abundance and ion band pass limitations hindered the observation of higher order MOS (i.e., DP > 27). A list of theoretical m/z values and core accurate masses used in the calculation of MOS m/z are reported in Table 1.
Table 1.
Theoretical Monoisotopic Masses of Beer Maltooligosaccharides
| Species | Formula | Mass (Da) | ||||
|---|---|---|---|---|---|---|
| Hexose residue | C6H10O5 | 162.0528 | ||||
| Water | H2O | 18.0106 | ||||
| Sodium ion | Na+ | 22.9892 | ||||
| Potassium ion | K+ | 38.9632 | ||||
| Proton | H+ | 1.0073 | ||||
| Cross-ring loss R1 | C4H8O4 | 120.0423 | ||||
| Cross-ring loss R2 | CH2O | 30.0106 | ||||
| MOS DP | [M+Na]+ | [M+K]+ | [M-H]− | [M-R1-H]− | [M-R2-H2O-H]− | [M-R1-R2-H2O-H]− |
| 3 | 527.1582 | 543.1322 | 503.1617 | 383.1195 | 455.1406 | 335.0984 |
| 4 | 689.2111 | 705.1850 | 665.2146 | 545.1723 | 617.1934 | 497.1512 |
| 5 | 851.2639 | 867.2378 | 827.2674 | 707.2251 | 779.2463 | 659.2040 |
| 6 | 1013.3167 | 1029.2906 | 989.3202 | 869.2779 | 941.2991 | 821.2568 |
| 7 | 1175.3695 | 1191.3435 | 1151.3730 | 1031.3308 | 1103.3519 | 983.3096 |
| 8 | 1337.4223 | 1353.3963 | 1313.4258 | 1193.3836 | 1265.4047 | 1145.3625 |
| 9 | 1499.4752 | 1515.4491 | 1475.4787 | 1355.4364 | 1427.4575 | 1307.4153 |
| 10 | 1661.5280 | 1677.5019 | 1637.5315 | 1517.4892 | 1589.5104 | 1469.4681 |
| 11 | 1823.5808 | 1839.5547 | 1799.5843 | 1679.5420 | 1751.5632 | 1631.5209 |
| 12 | 1985.6336 | 2001.6076 | 1961.6371 | 1841.5949 | 1913.6160 | 1793.5737 |
| 13 | 2147.6864 | 2163.6604 | 2123.6899 | 2003.6477 | 2075.6688 | 1955.6266 |
| 14 | 2309.7393 | 2325.7132 | 2285.7428 | 2165.7005 | 2237.7216 | 2117.6794 |
| 15 | 2471.7921 | 2487.7660 | 2447.7956 | 2327.7533 | 2399.7745 | 2279.7322 |
| 16 | 2633.8449 | 2649.8188 | 2609.8484 | 2489.8061 | 2561.8273 | 2441.7850 |
| 17 | 2795.8977 | 2811.8717 | 2771.9012 | 2651.8590 | 2723.8801 | 2603.8378 |
| 18 | 2957.9505 | 2973.9245 | 2933.9540 | 2813.9118 | 2885.9329 | 2765.8907 |
| 19 | 3120.0034 | 3135.9773 | 3096.0069 | 2975.9646 | 3047.9857 | 2927.9435 |
| 20 | 3282.0562 | 3298.0301 | 3258.0597 | 3138.0174 | 3210.0386 | 3089.9963 |
| 21 | 3444.1090 | 3460.0829 | 3420.1125 | 3300.0702 | 3372.0914 | 3252.0491 |
| 22 | 3606.1618 | 3622.1358 | 3582.1653 | 3462.1231 | 3534.1442 | 3414.1019 |
| 23 | 3768.2146 | 3784.1886 | 3744.2181 | 3624.1759 | 3696.1970 | 3576.1548 |
| 24 | 3930.2675 | 3946.2414 | 3906.2710 | 3786.2287 | 3858.2498 | 3738.2076 |
| 25 | 4092.3203 | 4108.2942 | 4068.3238 | 3948.2815 | 4020.3027 | 3900.2604 |
| 26 | 4254.3731 | 4270.3470 | 4230.3766 | 4110.3343 | 4182.3555 | 4062.3132 |
| 27 | 4416.4259 | 4432.3999 | 4392.4294 | 4272.3872 | 4344.4083 | 4224.3660 |
| 28 | 4578.4787 | 4594.4527 | 4554.4822 | 4434.4400 | 4506.4611 | 4386.4189 |
| 29 | 4740.5316 | 4756.5055 | 4716.5351 | 4596.4928 | 4668.5139 | 4548.4717 |
| 30 | 4902.5844 | 4918.5583 | 4878.5879 | 4758.5456 | 4830.5668 | 4710.5245 |
While the positive mode spectra of electrosprayed beer carbohydrates were dominated by sodium and potassium adducts, the MOS species in the negative mode were most commonly deprotonated [M-H]−, as seen in the lower trace of Figure 1a. Compared to the results obtained for the other ionization and source configurations, the signal intensity of the negatively charged MOS using MALDI with the harmine / NH4Cl matrix was significantly less. Comparison of the relative intensities of the major ion peaks in the positive and negative mode reflect an approximate difference in sensitivity of approximately three fold. In order to compensate for the lower sensitivity of negative mode MALDI for MOS analysis, ions were accumulated from 25 laser shots as opposed to five shots for positive mode MALDI. While still useful for instrument tuning and calibration, the observation of intact MOS ions in the negative mode using MALDI was not attainable due to the relative instability of these compounds in negative mode. Previous studies of negatively charged non-reducing neutral oligosaccharides have indicated that the chloride [M+Cl]− adducts formed with the use of harmine / NH4Cl matrix readily decay to form deprotonated [M-H]− ions [28,29]. These deprotonated ions are subject to further in-source and post-source decay mechanisms, including cross-ring cleavage. Our experiments provide further confirmation of this behavior, as the negatively charged beer MOS ions generated by MALDI corresponded to two series of cross-ring cleavage products. The first of these series was equivalent to a deprotonated molecular ion that has lost 48.0211 Da (that is, [M-CH2O-H2O-H]−) and was consistent with the observations of Yamagaki et al [29]. This series was represented by the minor signals shown in the lower trace of Figure 1b. The second series corresponded to a further degradation of ions from the first series, with the additional loss of 120.0423 Da to produce [M-C4H8O4-CH2O-H2O-H]− fragments. These double-cleavage products constitute the major series of signals seen in the lower trace of Figure 1b.
Using the nomenclature of Domon and Costello [30], the post-source decay ions can be described as products of successive fragmentations of the X and A types. Calibrating the spectrum on the minor series of fragments, the masses of the major ion series were found to agree with these assignments to within ~ 3 ppm root mean square mass error, thus supporting the hypothesis the ions are related via cross-ring fragmentation. While the negatively charged MOS ions produced by MALDI are prone to significant fragmentation due to the inherent instability of these species, their usefulness as mass calibrants is not diminished since the elemental composition of the observed ions remains known.
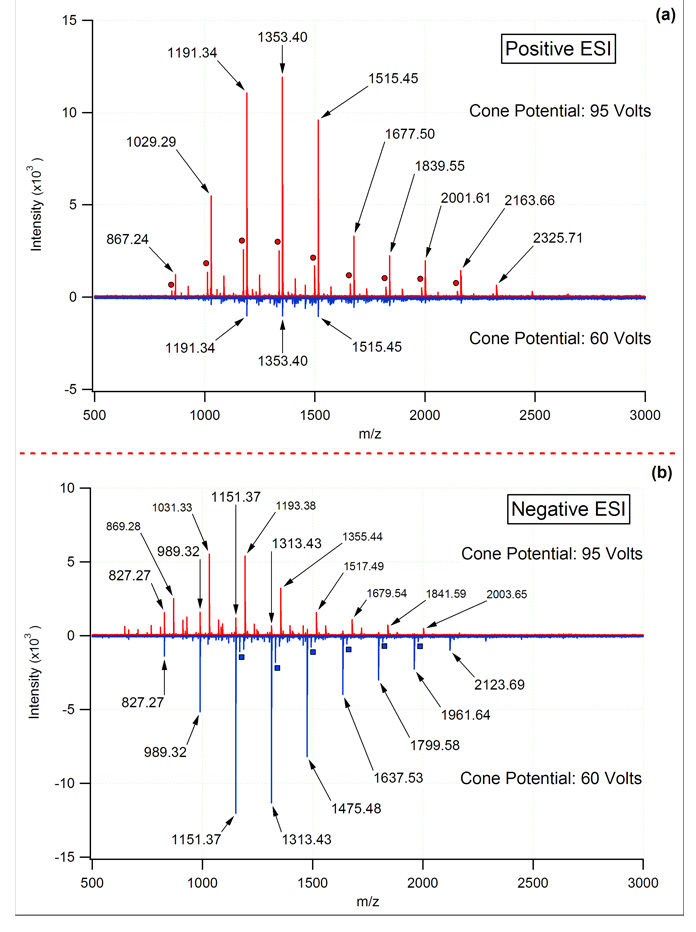
The propensity of the negatively charged MOS ions to fragment was also found to be an important factor in ESI. When probing peptides and related systems, increasing the sample cone potential typically leads to in-source fragmentation (sometimes referred to nozzle-skimmer dissociation), whereas MOS tend to remain intact under the same conditions in the positive mode. This behavior is illustrated in the uppermost plot of Figure 2. At cone potentials below 75 V, significant losses of carbohydrate signal were experienced in the positive mode, while higher cone potentials produced signals ~10 times more intense. Interestingly, high cone potentials in the negative mode also produced an abundance of signal. However, the primary carbohydrate series did not correspond to an intact molecular ion. Rather, this series was the result of in-source fragmentation corresponding to the loss of 120.0423 Da (C4H8O4) from the deprotonated species to yield [M- C4H8O4-H]− as reported by Yamagaki and Nakanishi [31]. These ions correspond to deprotonated 0,2X or 2,4A fragments of the MOS ions. Lowering the cone potential to 60 V virtually eliminated the in-source fragmentation and allowed the deprotonated [M-H]− ions of the MOS to dominate (Figure 2, lower trace). Overall, the signal for beer MOS was maximized using a high cone potential (~95 V) in the positive mode, and a lower cone potential (~60 V) in the negative mode. While the possibility of in-source fragmentation at higher cone potentials cannot be entirely eliminated, this occurrence seems less likely when considering all data obtained for each MOS sample in both the positive and negative modes. As Figure 2 illustrates, softening the environment of the atmospheric pressure interface in the negative mode allowed for intact molecular ions to be observed. Using these same source parameters in the positive mode failed to produce the protonated species or appreciable amounts of metal adducted carbohydrate ions. Because it was unlikely that higher cone potentials induced the formation of alkali earth adducts, cone potentials above ~75 V were evidently necessary to adequately desolvate the sodium and potassium adducts of MOS prior to mass analysis. Previous work examining the conformation of metal coordinated carbohydrates has demonstrated the ability of the metal ions to coordinate with multiple oxygen atoms simultaneously [26,32]. This serves to provide an explanation for the absence of in-source fragmentation in positive-mode ESI of MOS alkali metal adducts.
Figure 2.
Influence of ESI cone voltage on the relative abundance and observed MOS ions in both the positive and negative modes with mass analysis by FT-ICR-MS. In the positive mode the type of adduct observed was relatively unchanged with cone potential; however, total ion abundances were highly dependent upon this value. Higher cone potentials in the negative mode induced fragmentation (labeled in smaller font), whereas lower cone potentials yielded the deprotonated species. For the MOS sample shown, the positive mode was dominated by potassiated adduct, with a smaller series corresponding to the sodiated adducts (circles). Additional series were observed; however, the relative abundance of these series limits their utility as calibrants.
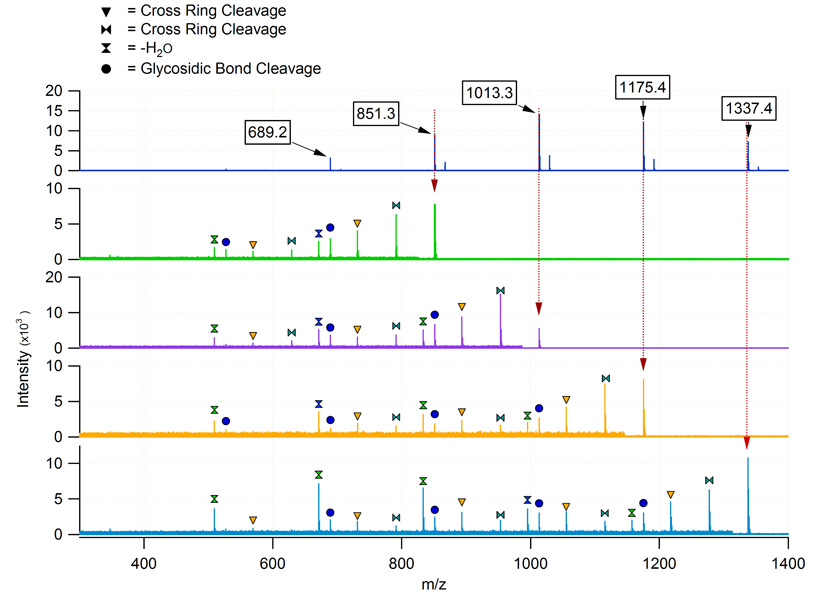
While in-source fragmentation was not observed for the metal-coordinated MOS produced in positive mode ESI, detailed tandem mass spectrometry experiments were possible using IRMPD. As shown in Figure 3, the fragments observed for MOS corresponded to loss of water, glyosidic bond cleavage, and two subsequent cross ring cleavages. For carbohydrates in particular, IRMPD typically provides a wealth of information that may be used to confirm oligosaccharide composition. However, these compositional assignments do not preclude the possibility of isomerism. It is believed that MOS derived from beer are primarily comprised of linear carbohydrates, although nano-LC separation using PGC as the stationary phase illustrates the possibility of isomers.
Figure 3.
ESI-FT-ICR MS/MS with IRMPD of selected beer MOS. The vertical dotted lines provide a visual guide to the parent ion masses. The remaining peaks resulted from the IRMPD of the precursor ions and represented either the loss of water or cross-ring cleavage (see legend). The m/z region of each spectrum below the parent ion has been magnified for clarity.
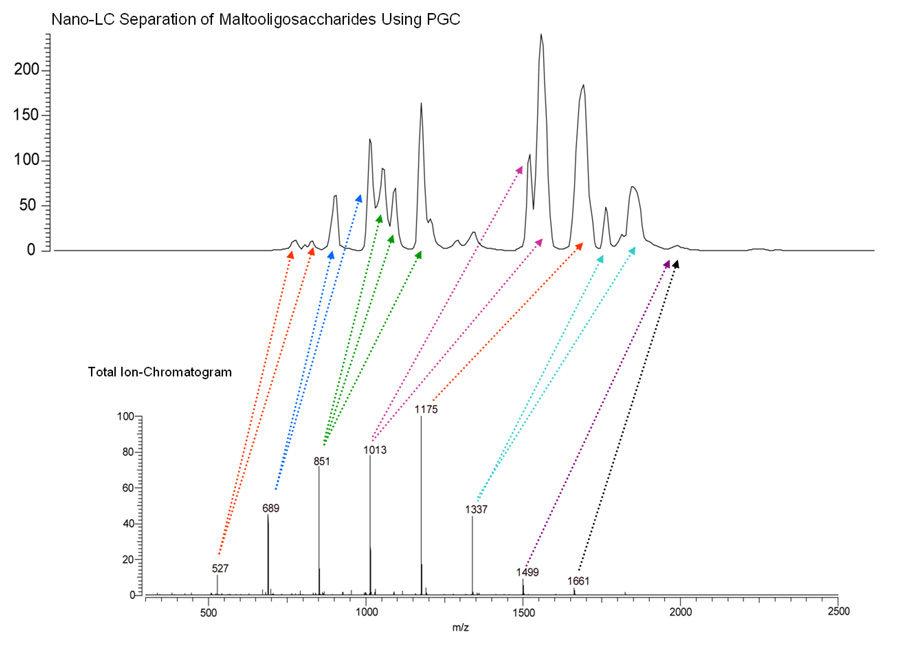
Figure 4 shows the annotated nano-LC chromatogram of beer-derived MOS and corresponding mass spectrum summed across the entire chromatographic run. Interestingly, the chromatogram contains many more peaks than the eight primary m/z ratios found in the summed mass spectrum for the nano-LC experiment. The multiplicity of chromatographic peaks in comparison to the mass spectral signals suggests the presence of isobaric but structurally distinct carbohydrate species in beer. Despite the presence of MOS isomers, the utility of these compounds as mass calibrants remains intact due to the inability of mass spectrometry to resolve truly isobaric ions.
Figure 4.
Annotated nano-LC/FT-ICR-MS separation of MOS derived from beer. Using PGC as the stationary phase, singular m/z values within multiple nano-LC elution peaks were often observed indicating the presence of isomeric carbohydrates.
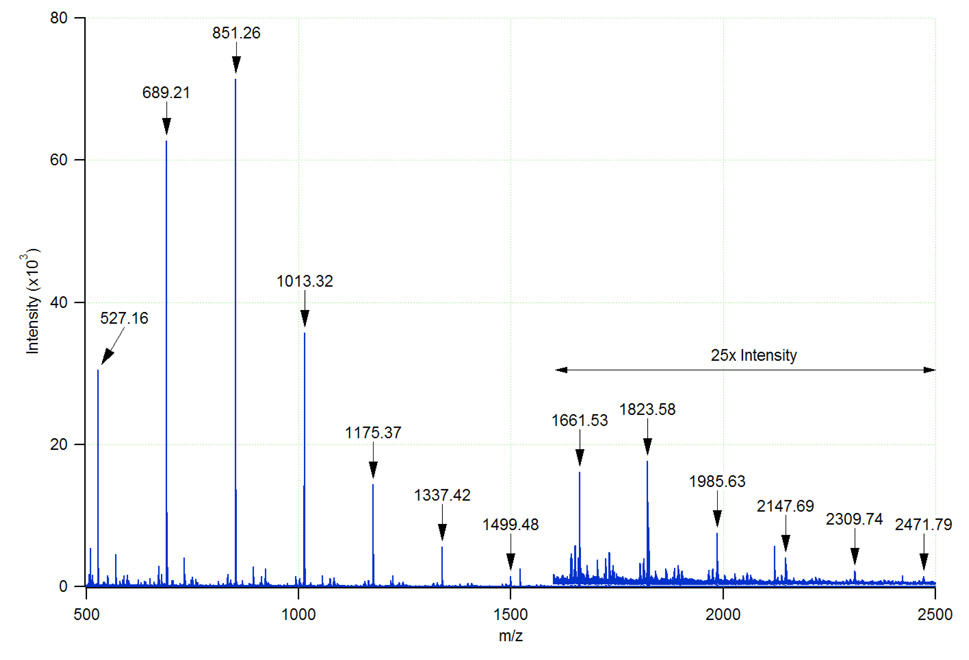
While the MOS found in samples of dilute beer are readily detected by FT-ICR-MS, the ability to produce and detect these ions is not unique to that particular mass analyzer. As demonstrated in Figure 5, the MOS are readily observed as sodium adducts in positive ion mode ESI-TOF-MS. Thus, MOS series are useful not only due to dual polarity accessibility in both ESI and MALDI, but also provide calibration and tuning standards well suited to the optimization of various types of mass spectrometers for carbohydrate analysis. It should be noted that in order to increase to detect these ions with good signal to noise, the source conditions (voltages) were altered from those typically used for proteomics.
Figure 5.
Positive ion mode ESI-TOF-MS analysis of PGC purified beer MOS with an effective dilution factor of 100. Above m/z 1600, the intensity scale has been expanded by a factor of 25 for clarity. The major MOS series corresponds to [M+Na]+ ions.
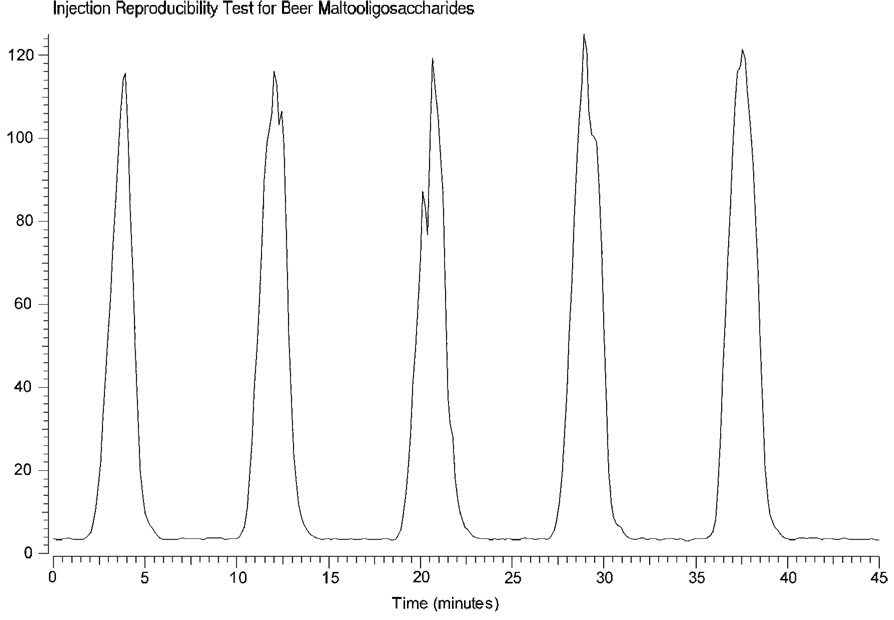
In addition to their ease of use, compatibility with ESI and MALDI, and fairly comprehensive mass range in either polarity, perhaps the most attractive feature of beer MOS is their lack of memory effects. Figure 6 highlights the lack of carryover associated with the use of beer MOS as tuning standards for mass spectrometry. Five 1 µL injections were performed at 8 min intervals with a flow rate of 500 nL/min. Under these conditions and with the flow rate held constant, the total ion signal returned to baseline in a matter of moments following injection. No special effort was made to flush the MOS from the system. At no time during the course of this study were the electrospray emitters replaced due to contamination with MOS. It should also be noted that through refrigeration the integrity of the stock solution was maintained for periods lasting many months.
Figure 6.
Infusion of beer MOS using ESI-FT-ICR-MS. The plot of total ion intensity observed over time illustrates the reproducible nature of five 1 µL beer maltooligosaccharide injections and the lack of carryover between samples.
CONCLUSIONS
Using nano-ESI and MALDI as ionization sources with FT-ICR-MS and TOF-MS as mass analyzers, beer MOS have successfully been used as mass calibrants and tuning standards in both the positive and negative ion modes. Since the MOS are derived from beer, the mass calibration and tuning range is not limited by the commercial inavailability of pure MOS with sufficiently high DPs. Relatively high cone voltages in positive mode nano-ESI favored the production of sodium and potassium adducts, whereas the same settings in the negative mode induced cross-ring cleavage. This in-source fragmentation was alleviated by lowering the cone potential to produce the deprotonated molecular ions of beer MOS. These source conditions are typical for oligosaccharide anlysis using nano-ESI in our research group. With ionization by MALDI and using DHB as the matrix, sample spots doped with NaCl almost exclusively produced MOS ions as sodium adducts in the positive ion mode. When operating in negative mode MALDI and using harmine / NH4Cl as the matrix, the MOS were observed primarily as internal fragments resulting from sequential cross ring cleavages at both termini, but remained useful as mass and tuning standards since the elemental composition of the fragments could be deduced.
While MOS content varied slightly with the selected beer, the overall composition and more importantly the m/z ratios observed remained constant. The stringent level of quality control for these products results in highly reproducible MOS distributions for any given brand. In addition to being amenable to dual polarity ionization using both ESI and MALDI, beer MOS are easily enriched, cost effective, readily available, amenable for carbohydrate anlaysis, and relatively comprehensive calibrants (m/z 500–2500 and above) that do not suffer from memory effects that hinder many traditional mass and tuning standards.
ACKNOWLEDGEMENTS
The authors would like to thank Agilent Technologies for the use of the 6200 Series HPLC-Chip/TOF-MS. The following funding sources are also acknowledged: Dairy Management Incorporated, California Dairy Research Foundation (06 LEC-01-NH), University of California Discovery Grant (05GEB01NHB), and the National Institutes of Health (GM 49077).
REFERENCES
- 1.Lawrence DL. Accurate mass measurement of positive ions produced by ammonia chemical ionization. Rapid Commun. Mass Spectrom. 1990;4:546–549. [Google Scholar]
- 2.Jonscher KR, Yates JR., III Mixture analysis using a quadrupole mass filter/quadrupole ion trap mass spectrometer. Anal. Chem. 1996;68:659–667. doi: 10.1021/ac950978s. [DOI] [PubMed] [Google Scholar]
- 3.Jiang L, Moini M. Ultramark 1621 as a reference compound for positive and negative ion fast-atom bombardment high-resolution mass spectrometry. J. Am. Soc. Mass Spectrom. 1992;3:842–846. doi: 10.1016/1044-0305(92)80007-8. [DOI] [PubMed] [Google Scholar]
- 4.Lattimer RP. Fast atom bombardment mass spectrometry of polyglycols. Int. J. Mass Spectrom. Ion Proc. 1984;55:221–232. [Google Scholar]
- 5.Goad LJ, Prescott MC, Rose ME. Poly(ethyleneglyol) as a calibrant and solvent for fast atom bombardment mass spectrometry: application to carbohydrates. Org. Mass Spectrom. 1984;19:101–104. [Google Scholar]
- 6.Lattimer RP. Tandem mass spectrometry of lithium-attachment ions from polyglycols. J. Am. Soc. Mass Spectrom. 1992;3:225–234. doi: 10.1016/1044-0305(92)87006-K. [DOI] [PubMed] [Google Scholar]
- 7.Vekey K. Calibration in positive and negative ion fast atom bombardment using salt mixtures. Org. Mass Spectrom. 1989;24:183–185. [Google Scholar]
- 8.Konig S, Fales HM. Calibration of mass ranges up to m/z 10,000 in electrospray mass spectrometers. J. Am. Soc. Mass Spectrom. 1999;10:273–276. [Google Scholar]
- 9.Fenn JB, Mann M, Meng CK, Wong SF, Whitehouse CM. Electrospray ionization for mass spectrometry of large biomolecules. Science. 1989;246:64–71. doi: 10.1126/science.2675315. [DOI] [PubMed] [Google Scholar]
- 10.Tanaka K, Waki H, Ido Y, Akita S, Yoshida Y, Yohida T. Protein and polymer analyses up to m/z 100 000 by laser ionization time-of-flight mass spectrometry. Rapid Commun. Mass Spectrom. 1988;2:151–153. [Google Scholar]
- 11.Moini M. Ultramark 1621 as a calibration/reference compound for mass spectrometry. II. Positive- and negative-ion electrospray ionization. Rapid Commun. Mass Spectrom. 1994;8:711–714. [Google Scholar]
- 12.Cody RB, Tamura J, Musselman BD. Electrospray ionization magnetic sector mass spectrometry: calibration, resolution, and accurate mass measurements. Anal. Chem. 1992;64:1561–1570. [Google Scholar]
- 13.McEwen CN, Larsen BS. Accurate mass measurement of proteins using electrospray ionization on a magnetic sector instrument. Rapid Commun. Mass Spectrom. 1992;6:173–178. [Google Scholar]
- 14.Harris WA, Janecki DJ, Reilly JP. Use of matrix clusters and trypsin autolysis fragments as mass calibrants in matrix-assisted laser desorption/ionization time-of-flight mass spectrometry. Rapid Commun. Mass Spectrom. 2002;16:1714–1722. doi: 10.1002/rcm.775. [DOI] [PubMed] [Google Scholar]
- 15.Konig S, Fales HM. Formation and decomposition of water clusters as observed in a triple quadrupole mass spectrometer. J. Am. Soc. Mass Spectrom. 1998;9:814–822. [Google Scholar]
- 16.Vinogradov E, Bock K. Structural determination of some new oligosaccharides and analysis of the branching pattern of isomaltooligosaccharides from beer. Carbohydrate Res. 1998;309:57–64. doi: 10.1016/s0008-6215(98)00119-0. [DOI] [PubMed] [Google Scholar]
- 17.Mauri P, Minoggio M, Simonetti P, Gardana C, Pietta P. Analysis of saccharides in beer samples by flow injetion with electrospray mass spectrometry. Rapid Commun. Mass Spectrom. 2002;16:743–748. doi: 10.1002/rcm.632. [DOI] [PubMed] [Google Scholar]
- 18.Araujo AS, da Rocha LL, Tomazela DM, Sawaya ACHF, Almeida RR, Catharino RR, Eberlin MN. Eberlin, Electrospray ionization mass spectrometry fingerprinting of beer. Analyst. 2005;130:884–889. doi: 10.1039/b415252b. [DOI] [PubMed] [Google Scholar]
- 19.Cortacero-Ramirez S, Segura-Carretero A, Cruces-Blanco C, Hernainz-Bermudez de Castro M, Fernandez-Gutierrez A. Analysis of carbohydrates in beverages by capillary electrophoresis with precolumn derivitization and UV detection. Food Chem. 2004;87:471–476. [Google Scholar]
- 20.Nogueira LC, Silva F, Ferreira IMPLVO, Trugo LC. Separation and quantification of beer carbohydrates by high-performance liquid chromatography with evaporative light scattering detection. J. Chromatogr. A. 2005;1065:207–210. doi: 10.1016/j.chroma.2004.12.074. [DOI] [PubMed] [Google Scholar]
- 21.Bock K, Dreyer T, Mueller-Loennies S, Molskov-Bech L. Evaluation of new analytical techniques for the optimization of brewing processes. Proc. Inst. Brew. 1996;24:234–238. [Google Scholar]
- 22.Duarte IF, Spraul M, Godejohann M, Braumann U, Spraul M, Gil AM. Application of NMR spectroscopy and LC-NMR/MS to the identification of carbohydrates in beer. J. Ag. Food Chem. 2003;51:4847–4852. doi: 10.1021/jf030097j. [DOI] [PubMed] [Google Scholar]
- 23.Packer NH, Lawson MA, Jardine DR, Redmond JW. A general approach to desalting oligosaccharides released form glycoproteins. Glycoconj. J. 1998;15:737–747. doi: 10.1023/a:1006983125913. [DOI] [PubMed] [Google Scholar]
- 24.Davies MJ, Smith KD, Carruthers RA, Chai W, Lawson AM, Hounsell EF. Use of a porous graphitized carbon column for the highperformance liquid chromatography of oligosaccharides, alditols and glycopeptides with subsequent mass spectrometry analysis. J. Chromatogr. 1993;646:317–326. doi: 10.1016/0021-9673(93)83344-r. [DOI] [PubMed] [Google Scholar]
- 25.Suzuki H, Yamagaki T, Tachibana K. Optimization of matrix and amount of ammonium chloride additive for effective ionization of neutral oligosaccharides as chloride ion adducts in negative-mode MALDI-TOF mass spectrometry. J. Mass Spectrom. Soc. Japan. 2005;53:227–229. [Google Scholar]
- 26.Cancilla MT, Penn SG, Carroll JA, Lebrilla CB. Coordination of alkali metals to oligosaccharides dictates fragmentation behavior in matrix assisted laser desorption ionization/Fourier transform mass spectrometry. J. Am. Chem. Soc. 1996;118:6736–6745. [Google Scholar]
- 27.Cataldi TRI, Campa C, de Benedetto GE. Carbohydrate analysis by high-performance anion-exchange chromatography with pulsed amperometric detection: the potential is still growing. Fresenius J. Anal. Chem. 2000;368:739–758. doi: 10.1007/s002160000588. [DOI] [PubMed] [Google Scholar]
- 28.Cole RB, Zhu J. Chloride anion attachment in negative ion electrospray ionization mass spectrometry. Rapid Commun. Mass Spectrom. 1999;13:607–611. [Google Scholar]
- 29.Yamagaki T, Suzuki H, Tachibana K. In-source and postsource decay in negative-ion matrix-assisted laser desorption/ionization time-of-flight mass spectrometry of neutral oligosaccharides. Anal. Chem. 2005;77:1701–1707. doi: 10.1021/ac040150i. [DOI] [PubMed] [Google Scholar]
- 30.Domon B, Costello CE. A systematic nomenclature for carbohydrate fragmentations in FAB-MS/MS spectra of glycoconjugates. Glycoconj. J. 1988;5:397–409. [Google Scholar]
- 31.Yamagaki T, Nakanishi H. Negative-mode matrix-assisted laser desorption/ionization mass spectrometry of maltoheptaose and cyclomaltooligosaccharides. J. Mass Spectrom. Soc. Japan. 2002;50:204–207. [Google Scholar]
- 32.Hofmeister GE, Zhou Z, Leary JA. linkage position determination in lithium-cationized disaccharides: tandem mass spectrometry and semiempirical calculations. J. Am. Chem. Soc. 1991;113:5964–5970. [Google Scholar]


