WHY IS CONDITIONAL SURVIVAL IMPORTANT?
Five-year relative survival statistics are often used to measure cancer control across jurisdictions, and international comparisons such as the concord or eurocare studies1,2 often point to substantial survival differences across participating countries. Such comparisons may generate specific additional studies by groups of participating countries to examine potential reasons for their own relative results, such as the recent International Cancer Benchmarking Project3 that involved the participation of four provincial cancer registries from Canada.
Survival statistics are also of great interest to clinicians providing direct care to patients, and patients understandably wish to be provided with some estimate of prognosis. However, most survival data are just an estimate of projected survival at the time of diagnosis. In reality, a patient’s relative probability of survival for another 5 years changes—and generally improves—throughout the cancer experience4. Recently published Canadian conditional survival data for a wide range of cancer diagnoses show that the prognosis did, in fact, improve over time from cancer diagnosis for all studied cancers except chronic lymphocytic leukemia5.
Conditional relative survival is a statistical method that attempts to describe more fully the patient survival experience. It expresses the probability of a patient surviving a given time into the future (often 5 years) at various points during the cancer experience, relative to the expected survival of the general population of the same age and sex. The purpose of the present short indicator report is to look at conditional survival for 3 major cancers in Canada and to promote familiarity with this statistic and its utility in clinical practice.
METHODS: HOW WERE THE STATISTICS CALCULATED?
The analyses are based on Canadian Cancer Registry data for cancer patients diagnosed between 2004 and 2006, ages 15–74 at diagnosis, for 9 provinces and 3 territories. Period survival analysis techniques were used so that the more recent diagnosis years could be included even though the full 5-year follow-up data may not be available in all cases5. Data from the province of Quebec were excluded from the analysis primarily because of issues associated with correctly ascertaining the vital status of cases5. A more detailed discussion of methods can be found in the recent Canadian overview5, and specific notes about the analysis are found in the Systems Performance Report6.
FINDINGS AND INTERPRETATION
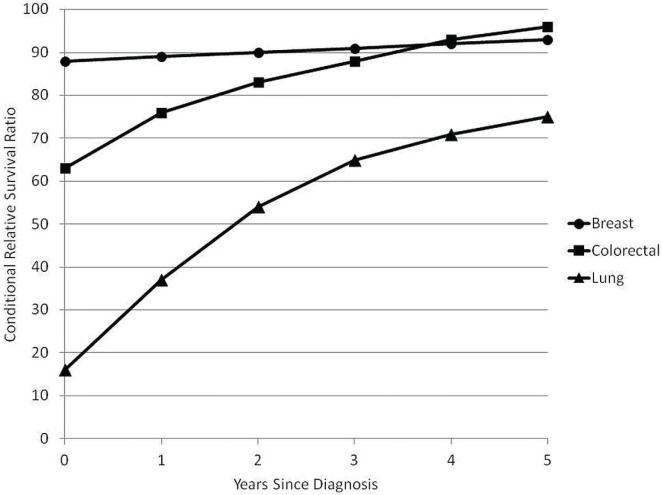
Figure 1 shows the 5-year conditional relative survival graphs for female breast, colorectal, and lung cancer. The point on the y axis for each cancer type translates into what we would normally call the 5-year relative survival for each cancer, which is seen to be highest for female breast cancer (at about 88%), intermediate for colorectal cancer (at 63%), and lowest for lung cancer (at 16%). Note that each of these is a relative survival ratio (which is the most commonly used population-based survival statistic in recent years). In other words, they estimate the chance that a newly-diagnosed cancer patient will survive 5 years compared with the general population of a similar age and of the same sex and province of residence as the patient. Thus, they estimate the excess mortality for a diagnosis of cancer compared with the general population and can be calculated in the absence of highly reliable cause-of-death data.
FIGURE 1.
Five-year conditional relative survival for breast, colorectal, and lung cancer, Canada, 2004–2006.
As the time from diagnosis lengthens, the estimates include an additional 5 years of survival conditional upon the patients having survived up to that anniversary date. As an illustrative example, substantial improvements in relative survival occur over time for patients who were previously diagnosed with colorectal cancer, such that a patient who is seeking care 2 years after diagnosis can now be told that they have an 83% chance of another 5 years of survival relative to the general population of people of their age and sex living in their province. By the time 5 years have elapsed after diagnosis, colorectal cancer patients can be told that they have nearly the same 5-year survival probability as the general population (96%).
Despite discouraging statistics at the time of diagnosis, lung cancer survival also shows substantial improvement for the relatively fewer patients who survive the first couple of years after their diagnosis. By year 2, the survivors now have a 54% relative survival for the next 5 years. And by year 5, the relative survival for an additional 5 years, while still lower than survival at diagnosis for several other cancers, rises to 75%.
In contrast to lung and colorectal cancers, female breast cancer shows a pattern of an initially very good 5-year prognosis that improves only slightly over time in the conditional relative survival analysis. In fact, at 5 years after diagnosis, the relative probability of living another 5 years is higher for a patient who was previously diagnosed with colorectal cancer than for a woman 5 years after her breast cancer diagnosis.
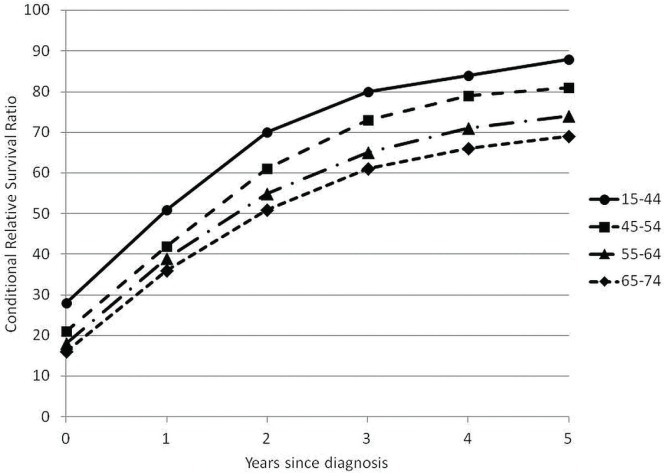
Figure 2 shows conditional relative survival data by age group at diagnosis for lung cancer. The best survival for individuals at time of diagnosis is for people in the youngest age group (15–44 years), an advantage that actually increases over time. A similar pattern is not observed for colorectal cancer (data not shown; see the System Performance Report6), which had a strikingly similar relative survival in Canada for all age groups both at diagnosis and at 5 years after diagnosis.
FIGURE 2.
Five-year conditional relative survival for lung cancer, by age, Canada, 2004–2006.
IMPLICATIONS
For individual patients, conditional relative survival is much more useful—and generally more optimistic—as they move through their cancer experience. Information on other cancers, using similar methods and Canadian data, can be found in Ellison et al.5 (available online at http://www.statcan.gc.ca/pub/82-003-x/2011002/article/11425-eng.pdf).
None of the analyses here take stage at diagnosis into account. At the time of writing, 9 of 10 provinces are collecting collaborative stage data on the 4 most common cancers (beginning in 2010, or earlier for some provinces). As those data become available for analysis, much more relevant survival data will be available in the Canadian context. We look forward to reporting the details in subsequent reports.
The differences in patterns seen across cancer types reflect varying clinical patterns that may bear additional study. The failure of breast cancer survival to reach the same high level as, say, colorectal cancer 5 years after diagnosis has been noted by other authors, with a recent analysis showing excess mortality for young and middle-aged breast cancer patients even 23 years after diagnosis7. Several possible reasons could be put forward, but as further work is done to characterize tumours and prognostic factors, it will be critical to look at conditional relative survival while taking the available prognostic predictors into account so that an understanding can be reached of the residual risk for particular patients and of the patients for whom the risk may be substantially diminished 5 years after diagnosis.
ABOUT THE CANCER SYSTEM PERFORMANCE REPORT
The Cancer System Performance Report is published by the Canadian Partnership Against Cancer and made possible through the dedicated efforts of the pan-Canadian Strategic Advisory and Technical Working Groups for System Performance. Pivotal in the data collection efforts are the staff members from the provincial cancer agencies or their equivalents, the C17 Council, the Canadian Breast Cancer Screening Database, the National Colorectal Cancer Screening Network, and the Pan-Canadian Cervical Screening Initiative. Statistics Canada provided access to data and vetted output.
The 2011 System Performance Report can be viewed at http://www.cancerview.ca/systemperformancereport. Public-use slides of figures in the present communication and the System Performance Report can be downloaded at http://www.cancerview.ca/publicuseslides.
CONFLICT OF INTEREST DISCLOSURES
The authors have no financial conflicts of interest to declare.
REFERENCES
- 1.Coleman MP, Quaresma M, Berrino F, et al. Cancer survival in five continents: a worldwide population-based study (concord) Lancet Oncol. 2008;9:730–56. doi: 10.1016/S1470-2045(08)70179-7. [DOI] [PubMed] [Google Scholar]
- 2.Sant M, Allemani C, Santaquilani M, et al. eurocare-4. Survival of cancer patients diagnosed in 1995–1999. Results and commentary. Eur J Cancer. 2009;45:931–91. doi: 10.1016/j.ejca.2008.11.018. [DOI] [PubMed] [Google Scholar]
- 3.Coleman MP, Forman D, Bryant H, et al. Cancer survival in Australia, Canada, Denmark, Norway, Sweden, and the U.K., 1995–2007 (the International Cancer Benchmarking Partnership): an analysis of population-based cancer registry data. Lancet. 2011;377:127–38. doi: 10.1016/S0140-6736(10)62231-3. [DOI] [PMC free article] [PubMed] [Google Scholar]
- 4.Janssen–Heijnen ML, Houterman S, Lemmens VE, Brenner H, Steyerberg EW, Coebergh JW. Prognosis for long-term survivors of cancer. Ann Oncol. 2007;18:1408–13. doi: 10.1093/annonc/mdm127. [DOI] [PubMed] [Google Scholar]
- 5.Ellison LF, Bryant H, Lockwood G, Shack L. Conditional survival analyses across cancer sites. Health Rep. 2011;22:21–5. [PubMed] [Google Scholar]
- 6.Canadian Partnership Against Cancer (cpac) Toronto, ON: CPAC; 2011. Home > Quality & Planning > Professionals > System Performance > System Performance Report. [Available online at: http://www.cancerview.ca/systemperformancereport; cited June 1, 2012] [Google Scholar]
- 7.Woods LM, Rachet B, Lambert PC, Coleman MP. “Cure” from breast cancer among two populations of women followed for 23 years after diagnosis. Ann Oncol. 2009;20:1331–6. doi: 10.1093/annonc/mdn791. [DOI] [PubMed] [Google Scholar]


