

Background: Redox machinery was implicated in regulating copper export from cells.
Results: The redox state of Atox1 depends on glutathione balance. In low glutathione, Atox1 becomes essential for cell viability independently of copper levels.
Conclusion: Atox1 and glutathione work together to maintain normal cell growth.
Significance: Interactions of two pathways explain differences between various cells in their metal and redox sensitivity.
Keywords: ATPases, Copper, Copper Transport, Glutathione, Redox Regulation, ATP7B, Atox1, CXXC
Abstract
Cells use the redox properties of copper in numerous physiologic processes, including antioxidant defense, neurotransmitter biosynthesis, and angiogenesis. Copper delivery to the secretory pathway is an essential step in copper utilization and homeostatic maintenance. We demonstrate that the glutathione/glutathione disulfide (GSH/GSSG) pair controls the copper transport pathway by regulating the redox state of a copper chaperone Atox1. GSSG oxidizes copper-coordinating cysteines of Atox1 with the formation of an intramolecular disulfide. GSH alone is sufficient to reduce the disulfide, restoring the ability of Atox1 to bind copper; glutaredoxin 1 facilitates this reaction when GSH is low. In cells, high GSH both reduces Atox1 and is required for cell viability in the absence of Atox1. In turn, Atox1, which has a redox potential similar to that of glutaredoxin, becomes essential for cell survival when GSH levels decrease. Atox1+/+ cells resist short term glutathione depletion, whereas Atox1−/− cells under the same conditions are not viable. We conclude that GSH balance and copper homeostasis are functionally linked and jointly maintain conditions for copper secretion and cell proliferation.
Introduction
The ability of copper to cycle between reduced (Cu+) and oxidized (Cu2+) forms is utilized in numerous physiological processes including respiration, radical defense, neurotransmitter biosynthesis, and angiogenesis. The ease with which Cu2+ induces oxidation of various biological substrates is a likely reason why, in the cytosol, copper is transported as Cu+ bound to specific carriers (copper chaperones) until it reaches its final destination (1). Copper delivery to the secretory pathway is essential for normal cellular homeostasis (2). This process, mediated by the copper chaperone Atox1 and the copper-transporting ATPases (Cu-ATPases) ATP7A/ATP7B, is required for functional maturation of copper-dependent enzymes that function at the plasma membrane and in specialized compartments such as melanosomes (3) or secretory granules (4). The Atox1/Cu-ATPase pair also transfers copper to secreted metalloproteins, which have long range activities in the body, such as ceruloplasmin or blood clotting factors V and VIII (5). In addition to protein metallation, Atox1 and Cu-ATPases maintain copper concentration in tissues by exporting excess copper from cells. Disruption of copper transport to the secretory pathway in Menkes and Wilson diseases or in Atox1−/− mice results in severe multisystem pathologies (6–8).
Atox1 and Cu-ATPases bind Cu+ in a similar and characteristic fashion: via Cys residues of the CXXC motif located in the exposed loop of a ferredoxin-like domain (see Fig. 1A). Atox1 has one such site, whereas human ATP7A and ATP7B have six sites (9) (see Fig. 1B). The CXXC motif is common for redox enzymes including thioredoxin and glutaredoxin, in which it undergoes reversible oxidation exchanging electrons with substrates (10). It was assumed that in the cytosol, the CXXC sites of Atox1 and Cu-ATPases were constitutively reduced and available for copper. However, recent studies suggest that Cu-ATPases are glutathionylated and that glutaredoxins are required to reverse modification and enable copper binding (11).
FIGURE 1.

Cys residues of Atox1 are susceptible to oxidation. A, crystal structure of Atox1 with bound copper (Protein Data Bank (PDB) accession code, 1TL4). The CXXC motif binds one copper ion (large sphere) by coordinating two sulfur atoms (small yellow spheres). Cys-41 and Lys-60 are also shown. The ϵ-nitrogen of Lys-60 is represented by a small blue sphere. B, a graphic depicting the canonical CXXC motifs in human Atox1, the N-terminal metal-binding domain of ATP7B (N-ATP7B), and other reductases. Atox1 has one CXXC site, whereas ATP7B has six sites. TGN, trans-Golgi network. C, Cys residues in Atox1 are oxidized by various oxidants. Cys-targeted labeling increases 966 Da per one reduced Cys residue. The fully labeled band (red) and the singly band (ox) are indicated. The intact theoretical mass is 7667 Da. D, nonreducing SDS-PAGE analysis points to intramolecular disulfide in oxidized Atox1. The majority of oxidized Atox1 runs as a monomer.
Atox1 acts upstream of Cu-ATPases (12), and its redox state would critically contribute to overall copper export. Although the copper binding properties of Atox1 have been intensely investigated (6, 13, 14), the redox characteristics of Atox1 remain unknown. Consequently, we set out to (i) determine the redox properties of Atox1 CXXC motif in vitro and in cells; (ii) identify the main cellular redox system (thioredoxin, GSH/GSSG pair, glutaredoxin) that was sufficient in keeping Atox1 in a functional form; and (iii) examine whether the oxidation state of Atox1 is influenced by changes in cellular redox environment.
We show that in proliferating cells, the CXXC site of Atox1 is mostly reduced and that high glutathione is sufficient to maintain this state. Changes in GSH/GSSG balance alter the redox status of Atox1, indicating that glutathione balance is essential for normal activity of the copper secretion pathway. We also show a cooperative relationship of copper export and glutathione homeostasis in maintaining cell viability. Cells with defect in either Atox1 or the Atox1 target, ATP7B, require high glutathione for their growth. Altogether, our data highlight the tight link of copper export machinery to glutathione-based redox maintenance and a partnership of two pathways in normal cell homeostasis.
EXPERIMENTAL PROCEDURES
Reagents
Reduced and oxidized glutathiones (GSH and GSSG, respectively) were purchased from Sigma. Maleimide derivatives, N-ethylene-maleimide and EZ-Link maleimide-PEG11-biotin, were from Sigma and Thermo Scientific, respectively. Yeast glutathione reductase, purified human glutaredoxin 1, purified Escherichia coli thioredoxin 1, thioredoxin reductase, monoclonal anti-FLAG antibody M13 clone, and polyclonal anti-Grx1 antibody were from Sigma. Polyclonal anti-ceruloplasmin antibody was from Abcam. Polyclonal anti-ATP7B antibody was described previously (15).
Cell Lines
Hek293T cells (HEK293TREx strain) and Caco-2 cells (kindly provided by Dr. Jack Kaplan, University of Illinois, Chicago, IL) were maintained in minimum Eagle's medium supplemented with penicillin/streptomycin (Invitrogen), nonessential amino acids (Invitrogen), 10% FBS (v/v). Mouse embryonic fibroblast (MEF)2 WT or Atox1−/− cells (kindly provided by Dr. Tohru Fukai, University of Illinois) were also maintained in the same medium. HepG2 cells were maintained in DMEM with 10% FBS on collagen-coated dishes.
Expression and Purification of Recombinant Protein
Purification of Atox1 was previously described (16). Briefly, the intein-chitin-binding domain-Atox1 fusion protein was expressed in E. coli transformed with the pTYB12/Atox1. After isolation of soluble fraction, the expressed protein was purified using chitin resin (New England Biolabs). Purified Atox1 was eluted following the DTT-induced cleavage of intein-chitin-binding domain fragment, dialyzed against PBS-NaCl (50 mm sodium phosphate, pH 7, 150 mm NaCl), and concentrated using an Amicon ultrafiltration device (Millipore, Billerica, MA). Protein purity was assessed by 15% Tricine SDS-PAGE. Protein concentration was determined by Bradford assay using BSA as standard.
Cys-targeted Labeling
All the thiol reagents were freshly prepared each time or stored at −20 °C. Reduced apo-Atox1 was prepared by incubation with 1 mm tris(2-carboxyethyl)phosphine (TCEP) and 1 mm copper chelator, bathocuproine disulfonate (BCS) for 1 h followed by removal of TCEP and BCS by three cycles of concentration-dilution (10× dilution for each cycle). PBS-NaCl was used as dilution buffer. After treatment with various oxidants or the GSH/GSSG pair, typically 2 μg of protein was precipitated with 10% (w/v) trichloroacetic acid (TCA) followed by centrifugation at 10,000 × g for 30 min. The protein pellet was washed with ice-cold acetone, quickly dried in a fume hood (<5 min), and dissolved in 20 μl of Laemmli sample buffer containing 4 m urea. The proteins were labeled with 2 mm EZ-Link maleimide-PEG11-miotin at room temperature for 3 h. The reaction was quenched by adding 1 μl of 500 mm cysteine. After adding 1 μl of 500 mm DTT, the labeled samples were resolved on 15% Tricine SDS-PAGE, and protein bands were stained with Coomassie Brilliant Blue G-250. Incorporation of EZ-Link maleimide-PEG11-biotin was identified by a mobility shift of labeled protein. Protein quantification in bands was done by densitometry using ImageJ (National Institutes of Health). In some experiments, Cys-targeted labeling was performed using 0.3 mm 7-diethylamino-3-(4-maleimidylphenyl)-4-methylcoumarin instead of EZ-Link. In this case, labeled protein was quantitated by UV-excited fluorescence, which was then normalized to band intensity on a Coomassie Brilliant Blue-stained gel. Gel images were taken using Alpha Innotech IS-2200 (Alpha Innotech).
To test the abilities of various reduction sources to reduce the Cys residues in Atox1, oxidized Atox1 (0.1 mg/ml) was reacted either with 1 mm TCEP, 10 mm GSH, 10 mm GSH plus 0.005 mg/ml Grx1 or with 1 mm NADPH plus 0.005 mg/ml Trx1 and 0.005 mg/ml thioredoxin reductase (TrxR). Incubation time was limited to 10 min so that the reduction by GSH itself would not completely reduce the protein. The redox status of the Cys residues in Atox1 was assessed by Cys-targeted labeling using 0.3 mm 7-diethylamino-3-(4-maleimidylphenyl)-4-methylcoumarin instead of EZ-Link. Labeled Cys was quantitated by UV-excited fluorescence, which was then normalized to band intensity on Coomassie Brilliant Blue-stained gel.
Measurement of Standard Redox Potential E0
Reduced apo-Atox1 at 0.1 mg/ml in PBS-NaCl was incubated with a mixture of GSH and GSSG present at different ratios. Concentrations of [GSH] and [GSSG] were chosen so as to fit the following equation: [GSH] + 2×[GSSG] = 10 mm. Incubation time was 3 h except where indicated. The reaction was quenched by adding 10% (w/v) TCA followed by Cys-targeted labeling as described above. The ratio of reduced to total Cys residues was plotted against the redox potential of the GSH/GSSG pair and fit to the following Nernst equation
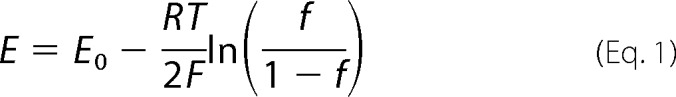 |
where f is the fraction of reduced Cys normalized to fully reduced state (labeled in the presence of 1 mm TCEP). E is the redox potential of the GSH/GSSG pair included in the buffer. E0 is the standard redox potential of the redox-sensitive Cys residues in the protein. R, T, and F are the gas constant, temperature, and the Faraday constant, respectively. Using E0 as a variant parameter, the best fit curve was searched, and the corresponding E0 was obtained. Redox potential of GSH/GSSG pair was calculated using the following equation
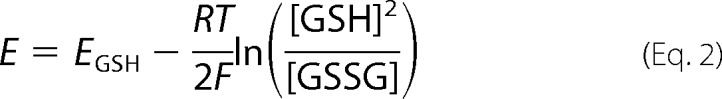 |
where EGSH is the standard redox potential of GSH/GSSG pair (−0.24 V (17)).
Generation and Expression of FLAG-tagged Atox1
The pTYB12/Atox1 construct (16) was used to amplify the Atox1 cDNA (Met-1–Glu-68) and add the N-terminal sequence MDYKDDDDKIG (FLAG tag). The DNA fragment was inserted into either the pCDNA3.1 or the pCDNA5 vector (Invitrogen) using the KpnI and NotI sites, resulting in pCDNA3.1/Atox1 or pCDNA5/Atox1, respectively. The primer sequences are shown in supplemental Fig. 1. HEK293T cells cultured on a 6-well plate were transfected with 4 μg of pCDNA5/Atox1 using 6 μl of TurboFect (Fermentas). For culture on a 100-mm dish, 16 μg of pCDNA5/Atox1 and 24 μl of TurboFect were used. Transient expression was immediately induced by adding 500 ng/ml doxycycline hyclate. Cells were harvested 16 h after transfection. Protein expression was confirmed by Western blotting using the anti-FLAG antibody.
The Redox Status of Atox1 in Cells
Typically, confluent cells cultured on a 100-mm dish were harvested and washed with PBS. The cells were resuspended in 250 μl of 10 mm MOPS, pH 7, supplemented with Complete protease inhibitor mixture tablets (Roche Applied Science). After 10 min of incubation on ice, cells were homogenized by a Dounce homogenizer. After adding 250 μl of buffer containing 50 mm MOPS, pH 7.0, 0.5 m sucrose, 0.3 m KCl, 6 mm MgCl2, the cells were again homogenized. The lysate was cleared by centrifugations at 20,000 × g, for 10 min. Supernatant was recovered, and <500 μg of soluble proteins were precipitated by adding 10% TCA. After acetone wash and air-dry, the protein pellet was dissolved in 100 μl of Laemmli sample buffer containing 4 m urea. Cys-targeted labeling was performed following the procedure described above except that 5 mm EZ-Link maleimide-PEG11-biotin was used. Labeled proteins were then analyzed by Western blotting using the anti-FLAG antibody.
To verify that the redox status of Cys residues was not modified during sample preparation, N-ethylmaleimide) blocking assay was performed. Before harvesting, cells were treated with 10 mm N-ethylmaleimide for 30 min to block reduced Cys residues in cells. Cytosolic proteins were then isolated, pelleted, and subjected to second labeling in the presence of 0.5 mm TCEP by 5 mm EZ-Link maleimide-PEG11-biotin. Cys residues were successfully blocked by N-ethylmaleimide and resistant to the second labeling, indicating that the Cys residues were initially reduced in cells and not modified during sample preparation.
Cytosolic Glutathione and Glutathione Reductase Activity
Cytosolic GSH levels were determined using a published protocol (18). Briefly, the soluble fraction was isolated as described above for Cys-directed labeling. To estimate total glutathione, 20-μl aliquots of diluted samples (10× in 100 mm potassium phosphate buffer, pH 7.5) and GSH standards (0–30 μm) were reacted with 0.23 mg/ml 5,5′-dithio-bis(2-nitrobenzoic acid), 0.91 units/ml glutathione reductase, 0.16 mm NADPH in the buffer including 100 mm potassium phosphate buffer, pH 7.5, and 5 mm EDTA. Reaction was initiated by adding NADPH (total volume 200 μl) at 25 °C and followed by monitoring absorbance at 412 nm for up to 30 min. In parallel, protein concentration was determined by bicinchoninic acid assay and used for normalizing glutathione concentration (nmol/mg of cytosolic protein). For measuring cytosolic glutathione reductase activity, glutathione reductase was excluded from the reaction mixture. A calibration curve was obtained by dilution series, and all the measurements were performed within the linear range.
Analysis of Apo- and Holo-ceruloplasmin (CP)
The levels of apo- and holo-ceruloplasmin were determined as described previously (19). Briefly, HepG2 cells at 50–60% confluency were washed three times with a serum-free medium, and 1 ml of serum-free medium was added per 60-mm dish. For treatments, either 0.5 mm BCS, 100 μm buthionine sulfoximine (BSO) or 10 μm bis(2-chloroethyl)-N-nitroso-urea (BCNU) was included into the medium. Secreted CP was collected from the growth medium after a 16-h incubation (20). Specifically, the cultured conditioned medium was concentrated 20 times using a 50,000 molecular weight cut-off (Millipore) ultrafiltration unit, and protein concentration was determined by the Bradford assay. Equal amounts of proteins (typically 5 μg) were then treated with 1% sodium dodecyl sulfate followed by the addition of 2× sample buffer (40 mm Tris-HCl, pH 6.8, 20% glycerol, 0.1% Coomassie Brilliant Blue G-250) and separated by a Blue Native-PAGE. CP was detected by Western blotting using anti-CP antibody. The serum samples from the wild-type and Atp7B−/− mice were used as controls for apo- and holo-CP, respectively (19).
Cell Viability
MEF WT or Atox1−/− cells were plated on 96-well plates to have 30,000 cells/well and 100 μl. Plating density was optimized so that the maximal BSO effect was obtained. Six hours after plating, 100 μl of culture medium containing various concentrations of BSO, BCS, or CuCl2 were added. Reagents were dissolved in water in stock solutions (100 mm BSO, 200 mm BCS, and 100 mm CuCl2). After 48 h of incubation, cell viability was assessed using the CellTiter 96 AQueous MTS reagent (Promega). One hour after adding MTS (3-(4,5-dimethylthiazol-2-yl)-5-(3-carboxymethoxy-phenyl)-2-(4-sulfophenyl)-2H-tetrazolium) reagent to cells, the reaction was quenched by 2.5% (w/v) SDS. The formazan product was measured by absorbance at 550 nm. The value for WT in normal culture condition was taken as 100% viability. The plots were fitted to the following Hill equation
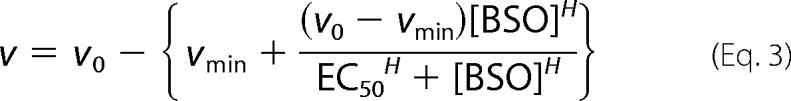 |
where v is viability, v0 is viability in the absence of BSO, vmin is minimum viability (typically vmin = 0), [BSO] is concentration of BSO, and EC50 is half-maximal effective concentration. The Hill coefficient is given as H, which varied depending on conditions (1.5 < H < 3.8). HepG2 cells were similarly analyzed except that cells were plated on collagen-coated plates at a cell density of either 10,000 cells/well or 15,000 cells/well, incubated for 1 day prior to treatment with BSO, and cultured for 4 days before the MTS assay.
To visually assess cell viability, cells were stained with propidium iodide. For these experiments, MEF WT or Atox1−/− cells were plated on 24-well plates to have 3 × 10⁵ cells/well and 500 μl. Six hours after plating, 500 μl of culture medium containing 0.6 mm BSO were added. After 48 h of incubation, cells were stained with 1 μg/ml propidium iodide for 10 min, which enters dead cells only (21). Phase contrast and propidium iodide fluorescence images were taken using a fluorescence microscope (IX51, Olympus) equipped with a CCD camera RETIGA 2000R (QIMAGING). For data analysis and image processing, ImageJ was used. For image taking and processing, the same conditions were used for all the samples. HepG2 cells were similarly analyzed except that cells were plated at a cell density of 105 cells/well, incubated for 1 day prior to treatment with 1 mm BSO, and cultured for 4 days before propidium iodide staining.
Knockdown of ATP7B in HepG2
To design ATP7B-specific shRNA, we selected two sequences of the type AA(N18–19) (where N indicates any nucleotide) from the open reading frame of the ATP7B mRNA (NM_000053). Another shRNA was designed using the BLOCK-iT RNAi designer (Invitrogen). Oligonucleotide DNA sets and corresponding target sequences are summarized in supplemental Figs. 1 and 2, respectively. Lentiviral vectors expressing the short hairpin RNA (shRNA) was prepared using BLOCK-It Lentiviral RNAi Expression System (Invitrogen) following the manufacturer's protocol. The lentivirus vector carrying human lamin A/C shRNA and nontargeted shRNA (for sequence 5-ACTACCGTTGTTATAGGTGT-3′) were used as positive and negative RNAi controls, respectively. Replication-incompetent lentivirus was packaged in the HEK293FT cells. Viral supernatant was harvested 48 h after transfection and stored at −80 °C. HepG2 cells plated on 6-well plate were transduced with lentivirus and selected by culturing with 10 μg/ml blasticidin. Nontransduced cells were killed within 7 days. The surviving cells were respread and selected typically through three passages. The transduced cells were maintained in the presence of 5 μg/ml blasticidin, and aliquots were stored in liquid nitrogen for further use.
RESULTS
The CXXC Motif of Atox1 Is Easily Oxidized, Forming a Disulfide
Atox1 has three Cys residues. (Cys-12 and Cys-15 in the CXXC motif and Cys-41, Fig. 1A). The properties of known CXXC motifs vary greatly (10, 22) due to different amino acid residues in the X1X2 position in CX1X2C. Consequently, we first tested the susceptibility of Atox1 cysteines to several biologically relevant oxidants. The reduced Cys residues were identified by labeling with a maleimide-PEG11-biotin, which adds 922 Da to a protein mass. Labeling of a fully reduced Atox1 yielded an expected ∼3-kDa shift in apparent molecular mass. Treatment with H2O2, Cu2+, GSSG, or even aerobic exposure decreased labeling pointing to Cys oxidation (Fig. 1C). Two out of three Cys residues were susceptible to oxidation, whereas one Cys residue was labeled in all conditions. DTT restored the labeling Cys to the initial level (supplemental Fig. 3), indicating that oxidation was associated with a formation of a disulfide.
In vitro, copper or cisplatin can induce formation of an Atox1 dimer (23). Thus, it was possible that oxidation may also lead to protein dimerization. To examine whether the disulfide was intramolecular or intermolecular, the oxidized Atox1 was analyzed by a nonreducing SDS-PAGE (Fig. 1D). A majority of the protein runs as a monomer consistent with the formation of an intramolecular disulfide. A minor but measurable fraction of Atox1 was present as an S–S-linked dimer. The distances between Cys residues in Atox1 (Fig. 1A; 3.90, 19.7, and 17.7 Å for Cys-12–Cys-15, Cys-12–Cys-41, and Cys-15–Cys-41, respectively (14)) would only allow an intramolecular disulfide between Cys-12 and Cys-15 in the CXXC motif. Consequently, we concluded that Cys-12 and Cys-15 were easily oxidized, whereas Cys-41 was not, and that the intramolecular disulfide within the copper-binding CXXC motif was the major form of disulfide pairing in Atox1. We examined the possibility of Atox1 glutathionylation, but no glutathionylated products were detected by mass spectrometric analysis under different conditions (10 mm GSH or 5 mm GSSG; supplemental Fig. 4).
The Redox State of Atox1 Is Modulated by the GSH/GSSG Pair and Grx1
High sensitivity of Atox1 to oxidation suggested that cells maintaining the CXXC motif in the reduced state may require one of the cellular redox systems. Previous studies pointed to a significant role of glutathione in copper homeostasis (11, 24–26). Thus, we hypothesized that the redox status of Atox1 could be maintained by the GSH/GSSG pair and consequently examined a direct disulfide exchange between Atox1 and the GSH/GSSG pair. Incubation of oxidized Atox1 with 10 mm GSH resulted in a complete reduction of Cys residues (t½ = 17.7 min, Fig. 2A). Typically, redox equilibration with bulk glutathione is achieved within several hours (27). The reduction rates observed for Atox1 indicated that Atox1 was a better than average substrate for glutathione.
FIGURE 2.

Analyses of redox equilibration between the GSH/GSSG pair and the CXXC site in Atox1. A, GSH-dependent reduction of Atox1. The Cys residues in Atox1 were initially oxidized by 0.1 mm GSSG. Following the addition of 10 mm GSH, their redox status was monitored by Cys-targeted labeling. The plots were fit to single exponential with t½ of 17.7 min. B, high concentration of GSH (10 mm) reduces the Cys residues in oxidized Atox1, whereas the thioredoxin and thioredoxin reductase (TrxR) system does not. Grx1 slightly facilitates reduction. The base signal observed for the untreated condition (0.47) can be attributed to labeling at Cys-41. CBB, Coomassie Brilliant Blue; CPM, 7-diethylamino-3-(4-maleimidylphenyl)-4-methylcoumarin. C, reduction of Atox1 (0.1 mg/ml) by low concentration of GSH (1 mm) is dependent on Grx1. The reduction was done in the absence or presence of 0.005 mg/ml Grx1. Two bands corresponding to the reduced (red) and oxidized (ox) Atox1 are indicated. D, densitometric analysis of the gel shown in C. The plots were fit to single exponentials with t½ of 123.8 min (GSH alone) and 2.9 min (GSH+Grx1).
A nonenzymatic reduction of a CXXC motif with glutathione is uncommon in a physiological context (28). Consequently, we also explored an enzyme-based reduction using glutaredoxin (Grx) or thioredoxin (Trx), the main reducing enzymes in cells. The Trx system did not reduce Atox1 (Fig. 2B). The addition of Grx1 at a 1:20 ratio to Atox1 at 10 mm GSH only slightly enhanced reduction. However, in low GSH (1 mm), we observed a strong requirement for Grx1. Specifically, the nonenzymatic reduction of Atox1by 1 mm GSH was very slow (t½ = 123.75 min), whereas the addition of Grx1 (1:20 ratio to Atox1) facilitated reduction by ∼30-fold (t½ = 2.89 min; Fig. 2, C and D). Thus, the Atox1 redox status is under control of the GSH/GSSG pair. Grx1 catalyzes this redox equilibration, and specific contribution of Grx1 to the Atox1 redox maintenance depends on the glutathione levels, which vary in different cell types.
In cells, the GSH/GSSG ratio as well as the total levels of glutathione may change, particularly during cell differentiation and polarization (29), serum depletion (30), or apoptosis (31), from −258 mV up to −165 mV (32). To better understand the potential effect of such changes on Atox1, we determined the standard redox potential of its CXXC site (Fig. 3, A and B, and supplemental Fig. 5). As a control, we used Grx1, which also contains the CXXC motif and undergoes reversible reduction/oxidation depending on the cytosolic GSH/GSSG ratio (22). The standard redox potential of Atox1 (E0 = −229 ± 4.5 mV) was in between that of GSH/GSSG pair (E0 = −240 mV) and Grx1 (E0 = −220 mV). This value and the Grx1-facilitated redox equilibration with the GSH/GSSG pair suggested that the CXXC site of Atox1 was able to undergo reversible reduction/oxidation under physiologically relevant conditions.
FIGURE 3.

Measurement of standard redox potentials of the CXXC site in Atox1 and GSH site in Grx1. A, Atox1 and Grx1 were incubated in the presence of the GSH/GSSG pair with various redox potentials. Similar to Atox1, Cys-targeted labeling of Grx1 produced two specific bands corresponding to the reduced (red) and oxidized (ox) forms. B, plots for the densitometric analysis of the gels shown in A. The plots were fit to Nernst equations with standard redox potentials (E0) of −233 mV (Atox1, red) and −220 mV (Grx1, green). For comparison, the plot for the N-terminal metal-binding domain of ATP7B (N-ATP7B) is also represented (E0 = −178 mV, blue). Data for N-ATP7B were obtained as described in supplemental Fig. 6. Curves from three independent experiments for Atox1 were shown in supplemental Fig. 5 and gave E0 = −229 ± 4.5 mV.
We also determined the E0 of the N-terminal metal-binding domain of ATP7B (N-ATP7B), which has 18 Cys residues including six CXXC motifs (supplemental Fig. 6). Despite structural similarity of metal-binding domains to Atox1, the average E0 of N-ATP7B was significantly higher (−178 mV), and the analysis of the proteolyzed N-ATP7B did not reveal large differences between the six metal-binding sites (data not shown). These results suggested that the CXXC site of Atox1 could be specifically tuned for regulation by changes in the GSH/GSSG ratio.
The Redox Status of Atox1 in Cells
A cytosolic redox potential in the proliferating stage is in the range of −258 to −220 mV (HT29, fibroblasts, HL-60, murine hybridoma cells (Ref. 32)). Our data on Atox1 redox potential suggested that in cells, Atox1 was mostly reduced, but could be oxidized if GSH/GSSG balance was disrupted. To test these predictions, we first determined the redox status of Atox1 in cells under normal growth conditions. HEK293T cells were transfected with a plasmid expressing FLAG-Atox1, and cell lysate was subjected to a Cys-directed labeling followed by molecular shift assay. Under standard growth conditions, Atox1 appeared fully reduced (Fig. 4A) as evident from comparison with a control GSH-pretreated Atox1 (Fig. 4B).
FIGURE 4.

The cellular GSH/GSSG pair regulates the redox status of Atox1. A, Atox1 is mostly reduced in cells. The redox (red) status of FLAG-Atox1 in HEK293T cells was assessed by ex vivo Cys-targeted labeling. Two bands corresponding to the reduced (red) and oxidized (ox) Atox1 are indicated. The intact mass of FLAG-Atox1 is 8698 Da. When cells were pretreated with N-ethylmaleimide (NEM), Cys residues were blocked (see “Experimental Procedures”). WB, Western blot. B, the redox status of Atox1 expressed in HEK293T cells is reversibly modulated by the GSH/GSSG pair. The cytosolic fraction was treated with either 10 mm GSH or 1 mm GSSG for 3 h prior to Cys-targeted labeling. red, reduced; ox, oxidized. C, cytosolic glutathione reductase (GR) activity in HEK293T cells is inhibited by BCNU treatment. Results (means ± S.D.; n = 3) are expressed as the percentage of control. D, BCNU treatment caused oxidation of Atox1. Cells were treated with either vehicle or 0.5 mm BCNU for 30 min. Where indicated, cytosolic fraction was treated with either 10 mm DTT or 1 mm GSSG for 3 h prior to Cys-targeted labeling. E, neither elevated copper nor low copper in culture medium affected BCNU-induced oxidation of Atox1. Prior to BCNU treatment, cells had been incubated in the presence of copper or BCS for 1 day. F, changes in cellular glutathione level did not affect the redox status of Atox1. Cells were treated with 1 mm BSO and/or 20 μm CuCl2 for 16 h as indicated. The effect of BSO treatment on cellular glutathione level is summarized in Table 1. G, detection of apo- and holo-CP. Serum specimens from 6-week-old WT and ATP7B−/− mice were analyzed. Proteins were separated on Blue Native-PAGE followed by Western blotting using anti-CP antibody. The positions of apo-and holo-CP were indicated. H, CP analysis in conditioned culture medium (CCM) obtained from HepG2 cells. Cells were treated with various inhibitors as indicated: 0.5 mm BCS, 100 μm BSO, or 10 μm BCNU.
To examine the effect of GSH/GSSG misbalance on the redox state of Atox1, cells were treated with 0.5 mm BCNU. BCNU is the best known inhibitor of human glutathione reductase. Treatment with BCNU is expected to shift the GSH/GSSG equilibrium toward more oxidizing conditions (33). We verified that in HEK293T cells, incubation with 0.5 mm BCNU for 30 min yielded ∼90% inhibition of cytosolic glutathione reductase (Fig. 4C). Under these conditions, Atox1 was oxidized, as indicated by the decrease in Cys labeling (Fig. 4D). DTT pretreatment reversed the effect, confirming that the loss of labeling was due to oxidation and not due to irreversible Cys modification. Oxidation was independent of copper levels in the culture medium (Fig. 4E), indicating that copper levels were not the primary factor in regulating the Atox1 redox status.
Although BCNU did not directly react with glutathione (supplemental Fig. 7), treatment with BCNU did decrease total glutathione levels (Table 1), Thus, the observed oxidation of Atox1 could be attributed to either oxidative shift in the GSH/GSSG ratio or the decrease of total glutathione. To discriminate between these two possibilities, glutathione levels were decreased using BSO, an inhibitor of γ-glutamylcysteine synthetase. When glutathione level was lowered to 57% of control (Table 1), Atox1 remained fully reduced (Fig. 4F), demonstrating Atox1 resistance to a decrease in total glutathione. (Further optimization of BSO treatment allowed an 87% decrease of glutathione, but Atox1 remained reduced (supplemental Fig. 8).) We conclude that the redox status of Atox1 depends on GSH/GSSG balance rather than the total cellular glutathione level.
TABLE 1.
GSH concentration in HEK293T and MEF cells treated with BCNU or BSO
| Cell lines | Genotype | Treatmenta | GSH per cytosolic protein |
|---|---|---|---|
| nmol/mg | |||
| HEK293T | WT | 0.5 mm BCNU, 30 min | 10.0 ± 0.4 |
| HEK293T | WT | 1.3 ± 0.1 | |
| HEK293T | WT | 1 mm BSO, 16 h | 12.7 ± 1.1 |
| HEK293T | WT | 7.3 ± 0.9 | |
| MEF | WT | 0.1 mm BSO, 16 h | 22.7 ± 2.2 |
| MEF | WT | 2.9 ± 0.1 | |
| MEF | Atox1−/− | 0.1 mm BSO, 16 h | 17.5 ± 3.6 |
| MEF | Atox1−/− | 3.6 ± 1.0 |
a HEK293T cells were treated with either vehicle (water or DMSO), BSO, or BCNU, at the time of ∼80% confluency. Confluent MEF cells were treated with either vehicle or BSO for 16 h. Data are from three replicate samples of independent cultures ± S.D.
Atox1 Oxidation Disrupts Copper Delivery to the Secretory Pathway
In cells, Atox1 facilitates copper transport into the trans-Golgi network and thus enables the biosynthetic maturation of secreted copper-dependent enzymes, such as ceruloplasmin (12). We hypothesized that oxidation of Atox1 would impair the delivery of copper to the secretory pathway and result in the secretion of copper-dependent enzymes in an apo-form. To test this hypothesis, we examined the copper binding status of secreted CP following different treatments of HepG2 cells. (These cells were previously reported to secrete CP (20).) Serum samples from the control and Atp7b−/− mice were used as controls to verify the migration of the holo- and apo-CP forms, respectively (19) (Fig. 4G).
Under basal conditions, HepG2 cells produced more holo-CP than apo-CP (Fig. 4G), whereas cells treated with the copper chelator BCS secreted mostly apo-CP, as expected (Fig. 4, G and H). Decrease in total glutathione, due to either BSO or BCNU treatment, lowered the total CP levels, in agreement with a previous study (20); however, the effects of BSO and BCNU on the amounts of holo-CP differed. Treatment with BSO, which does not produce Atox1 oxidation (see above), had no effect on holo-CP, whereas BCNU decreased the amount of holo-CP (Fig. 4G). For BCNU treatment, we could not use the fully oxidizing conditions (0.5 mm or even 100 μm) for 16 h (time necessary to collect CP from the medium) due to significant cytotoxicity. Cells were treated with 10 μm BCNU, which did not affect cell viability. Even under these mild conditions, the fraction of holo-CP was significantly decreased (from 58% ± 1.8 to 43% ± 3.2; Fig. 4,G and H), suggesting the decreased delivery of copper to the secretory pathway.
Atox1 Is Required for Cell Viability in Low Glutathione
The similarity of the Atox1 redox potential to that of Grx1 and a GSH/GSSG pair as well as the ability of Atox1 to maintain the reduced state upon glutathione depletion suggested that Atox1 might play a previously unanticipated homeostatic role when glutathione levels were low. This hypothesis was tested using Atox1+/+ (WT) and Atox1−/− cells. In a regular growth medium, the proliferation rate of both cell lines was similar (supplemental Fig. 9). Glutathione depletion by BSO had little effect on viability/proliferation of the WT cells, which were resistant to up to 1 mm BSO (Fig. 5A). In marked contrast, the Atox1−/− cells were highly sensitive to BSO (EC50 = 42 μm, 100% loss of viability at a saturating concentration of 0.3 mm).
FIGURE 5.

Copper misbalance markedly increases cell sensitivity to glutathione depletion. A, comparison of WT MEFs and Atox1−/− cells. Cells were treated with various concentrations of BSO for 48 h, and cell viability was assessed by MTS assay. Results of independent experiments (means ± S.D.; n = 3) are expressed as the percentage of the value for WT in the absence of BSO. Similar experiments were also performed in the presence of either 20 μm CuCl2 (elevated copper) or 0.2 mm BCS (low copper). B, comparison of HepG2 cells and HepG2 cells with ATP7B-knockdown (clone name KD7). Stable knockdown of ATP7B was achieved by using shRNA as shown in supplemental Fig. 11. Sensitivity to BSO was examined in the presence of 0.1 mm CuCl2 (elevated copper) or 0.5 mm BCS (low copper) as well as basal condition. Fitting curves represent Equation 3 with EC50 values summarized in Table 2.
High sensitivity of Atox1−/− cells to BSO indicated that Atox1 was critical for cell survival under conditions of glutathione limitation. This conclusion was further supported by the fact the BSO-resistant WT cells were sensitive to BCNU, which affects both the Atox1 redox status and the glutathione levels (supplemental Fig. 10B). Total glutathione was similar in the WT and Atox1−/− cells in either regular medium or following BSO treatment (Table 1), indicating that Atox1 protects cells through the mechanism other than the maintenance of glutathione levels.
The loss of Atox1 decreases copper export via the secretory pathway (6). Thus, elevated intracellular copper could be the major reason for decreased viability of Atox1−/− cells in low glutathione. Therefore, we tested whether copper overload or copper chelation would, respectively, exacerbate or diminish sensitivity of Atox1−/− cells to a decrease in glutathione. Unexpectedly, both treatments further sensitized cells to glutathione depletion (Fig. 5B; EC50 values are summarized in Table 2), suggesting that normal copper levels were important for cell survival when glutathione was low. It was also apparent that the loss of Atox1 markedly increased sensitivity to glutathione depletion under all conditions. To better understand the role of Atox1, we investigated whether the down-regulation of copper transporter ATP7B, which functions downstream of Atox1, would resemble the effects of Atox1 inactivation. We developed the ATP7B-deficient HepG2 cells by using shRNA and lentivirus vector. Efficacy of the lentiviral shRNA delivery and RNAi was confirmed by lamin A knockdown (supplemental Fig. 11). Out of three different shRNAs (KD1, KD4, and KD7) the best result was obtained for KD7 with an ∼81% decrease in the ATP7B levels (supplemental Fig. 11B). Similar to Atox1−/− cells, the HepG2 KD7 cells were more sensitive to BSO when compared with the parent cells (Fig. 5B). Either copper elevation or copper depletion further increased sensitivity of cells to low glutathione. Thus, the disruption of normal copper homeostasis makes cells vulnerable to glutathione depletion. We conclude that the copper secretion pathway and glutathione work together to maintain normal cell proliferation.
TABLE 2.
Impact of copper secretion defect on EC50 values for BSO
BSO sensitivities of MEF and HepG2 cells were examined in various conditions of copper levels. Original plot data were shown in Fig. 5.
| Cell lines | Genotype | Treatment | EC50 for BSO |
|---|---|---|---|
| μm | |||
| MEF | WT | Basal | Resistanta |
| MEF | WT | 20 μm copper | 94.2 |
| MEF | WT | 0.2 mm BCS | 50.7 |
| MEF | Atox1−/− | Basal | 42.2 |
| MEF | Atox1−/− | 20 μm copper | 29.7 |
| MEF | Atox1−/− | 0.2 mm BCS | 9.6 |
| HepG2 | WT | Basal | Resistantb |
| HepG2 | WT | 0.1 mm CuCl2 | 63.5 |
| HepG2 | WT | 0.5 mm BCS | 102.8 |
| HepG2 | KD7 | Basal | 116.4 |
| HepG2 | KD7 | 0.1 mm CuCl2 | 26.3 |
| HepG2 | KD7 | 0.5 mm BCS | 12.5 |
a No significant cytotoxicity was detected up to 300 μm.
b No significant cytotoxicity was detected up to 500 μm.
DISCUSSION
Our studies revealed an important association between the Atox1-mediated copper trafficking to the secretory pathway and glutathione homeostasis. The redox state of Atox1 is maintained by equilibration with glutathione and can be influenced by changes in the cellular redox state. In turn, the copper secretion pathway has emerged as an essential factor for cell viability in low glutathione. We conclude that copper export machinery and glutathione metabolism have developed a functional symbiosis to maintain normal cell growth and proliferation. In the proposed model of the symbiotic partnership between copper export machinery and glutathione-based redox maintenance (Fig. 6), the combined effect of the two metabolic pathways determines cell viability where the simultaneous defects cause cell death.
FIGURE 6.

Copper export machinery and glutathione cooperate to maintain mammalian cell viability. The proposed relationship between glutathione balance and copper trafficking to the secretory pathway is shown. The redox integrity of Atox1 is maintained by glutathione by direct and Grx1-dependent equilibration. In turn, copper export machinery (Atox1 and Cu-ATPase ATP7A/B) works together with glutathione to maintain normal cell proliferation potentially through redox homeostasis. Simultaneous disruption of copper export machinery and glutathione metabolism results in cell death. In the Atox1-deficient or ATP7B knockdown cells, copper is accumulated in cytosol, whereas bioavailability to the secretion pathway is limited. In such conditions of copper misbalance, decrease of cellular glutathione level causes cell death.
The Redox Properties of the CXXC Motifs in Copper Export Machinery
Similarly to the CXXC motifs of thioredoxin or glutaredoxin, the CXXC motif of Atox1 undergoes reversible oxidation (Figs. 1 and 2) with the formation of an intramolecular disulfide. In a CX1X2C-based oxidoreductase, the redox activity and substrate specificity are primarily determined by the dipeptide sequence in the X1X2 position as well as surrounding residues interacting with the redox active Cys. These amino acid residues are invariant (i.e. X1X2 sequence Gly-Pro in Trx1 and Pro-Tyr in Grx1) and form highly conserved clusters of residues in vicinity to the CXXC motif. This is also the case with Atox1 and N-ATP7B (supplemental Figs. 12–14), which have X-Gly and X-Ser in X1X2 position, respectively. The conserved cluster in Atox1 is formed by the 12CGGC15 motif and another canonical sequence 57KTGK60. The ϵ-amino nitrogen of Lys-60 is positioned in the vicinity of the thiol group of Cys-15 (Fig. 1A) and modulates its pKa (34) and hence the copper dissociation constant (13). The pKa shift in Cys-15 (from 5.5 to 7.0), as well as the presence of Gly in the X2 position, may significantly affect the standard redox potential (E0) of the Cys-12–Cys-15 pair in Atox1. Unlike Atox1, the metal-binding domains of N-ATP7B have Phe (instead of Lys) in the equivalent position. These features may explain why E0 of Atox1 (−229 mV) is markedly different from N-ATP7B (−178 mV).
Considering that the rates of redox reaction largely depend on E0 (27), it is likely that in cells, Atox1 may act a glutathione-dependent reductase, although specific substrate(s) for the other half-reaction, if any, remain to be identified. From this point of view, it is interesting that Atox1 was initially identified as an antioxidant factor compensating for the loss of superoxide dismutase 1 (SOD1) function in yeast, hence its name (35). Similarly, in mammalian neuronal cells, overexpression of Atox1 improved cellular defense against hydrogen peroxide (36).
Even when glutathione levels are low, the redox status of Atox1 is maintained (presumably with the help of Grx1), but it can be altered depending on the GSH/GSSG ratio. Given the pivotal role of Atox1 in copper excretion, the redox modulation of Atox1 is likely to affect the overall copper distribution and homeostasis in cells. Interestingly, reversible Cys oxidation has been implicated in the function of other copper chaperones. COX17, SCO1, and SCO2 in mitochondria couple an electron transfer to copper exchange (37, 38), whereas Cu/Zn-SOD maturation involves Cys oxidation by its copper chaperone CCS (39). This common theme shared by copper chaperones may at least partially explain why copper homeostasis is influenced by the cellular redox environment.
Symbiotic Link between Copper Export Machinery and Glutathione-based Redox Maintenance
We have found that Atox1 contributes to the survival of cells when GSH levels are low (Fig. 5). Cell proliferation in low glutathione requires both Atox1 and ATP7B, indicating that copper trafficking through the secretion pathway plays a crucial role in cell proliferation under these conditions. An analogous link between copper and glutathione was also observed in bacteria (40), suggesting an early emergence of this molecular symbiosis in evolution. Why do the Atox1−/− cells lose viability in low glutathione? Similar consequences of Atox1 and ATP7B knockdowns indicate that cell viability requires the delivery of copper to the secretory pathway. The disruption in this process would have several metabolic consequences: (i) the loss of functional maturation of oxidoreductases in the secretory pathway, (ii) copper overload in inappropriate cellular compartments such as the nucleus (41) and cytosol (42); and (iii) potential induction (43) and sequestration of bioavailable copper by metallothioneins (44).
Glutathione depletion weakens the cellular defense to oxidative stress. Copper elevation is likely to facilitate oxidative reactions and thus have further negative impact, decreasing cell viability. It is less apparent why in low copper the Atox1−/− cells remain highly sensitive to glutathione depletion. One scenario could be that copper sequestration decreases the amount of copper available for SOD1 (an important protector against reactive oxygen species), and the redox activity of the Atox1 CXXC site helps to offset this loss. This and other alternative possibilities require further testing. The detailed analysis of a copper-bound status and/or the redox state of various components of a copper-handling machinery under different redox conditions is likely to be very informative.
Altogether, our findings illustrate the need for a tight control of cellular copper levels to maintain cell viability in low glutathione. Given a well known variation in cellular levels of glutathione (for example, between hepatocytes and neurons), it is tempting to speculate that different redox/copper sensitivities of different cell types are determined by the combined effect of copper and glutathione metabolisms.
Acknowledgments
We thank Dr. Abigael Muchenditsi for help with ceruloplasmin assay, Dr. Eri Furukawa for technical assistance, and Dr. Tatiana Boronina for help with mass spectrometric analysis. We acknowledge Prof. John Mieyal and Dr. Xing-Huang Gao for helpful scientific discussion.
This work was supported, in whole or in part, by National Institutes of Health Grant R01 DK071865 (to S. L.).

This article contains supplemental Figs. 1–14.
- MEF
- mouse embryonic fibroblast
- BCNU
- bis(2-chloroethyl)-N-nitroso-urea
- BCS
- bathocuproine disulfonate
- BSO
- buthionine sulfoximine
- MTS
- (3-(4,5-dimethylthiazol-2-yl)-5-(3-carboxymethoxyphenyl)-2-(4-sulfophenyl)-2H-tetrazolium
- Tricine
- N-[2-hydroxy-1,1-bis(hydroxymethyl)ethyl]glycine
- TCEP
- tris(2-carboxyethyl)phosphine
- Grx
- glutaredoxin
- Trx
- thioredoxin
- TrxR
- thioredoxin reductase
- CP
- ceruloplasmin
- KD
- knockdown
- DMSO
- dimethyl sulfoxide.
REFERENCES
- 1. Culotta V. C., Lin S. J., Schmidt P., Klomp L. W., Casareno R. L., Gitlin J. (1999) Intracellular pathways of copper trafficking in yeast and humans. Adv. Exp. Med. Biol. 448, 247–254 [DOI] [PubMed] [Google Scholar]
- 2. Lutsenko S., Gupta A., Burkhead J. L., Zuzel V. (2008) Cellular multitasking: the dual role of human Cu-ATPases in cofactor delivery and intracellular copper balance. Arch. Biochem. Biophys. 476, 22–32 [DOI] [PMC free article] [PubMed] [Google Scholar]
- 3. Setty S. R., Tenza D., Sviderskaya E. V., Bennett D. C., Raposo G., Marks M. S. (2008) Cell-specific ATP7A transport sustains copper-dependent tyrosinase activity in melanosomes. Nature 454, 1142–1146 [DOI] [PMC free article] [PubMed] [Google Scholar]
- 4. Steveson T. C., Ciccotosto G. D., Ma X. M., Mueller G. P., Mains R. E., Eipper B. A. (2003) Menkes protein contributes to the function of peptidylglycine α-amidating monooxygenase. Endocrinology 144, 188–200 [DOI] [PubMed] [Google Scholar]
- 5. Walker F. J., Fay P. J. (1990) Characterization of an interaction between protein C and ceruloplasmin. J. Biol. Chem. 265, 1834–1836 [PubMed] [Google Scholar]
- 6. Hamza I., Faisst A., Prohaska J., Chen J., Gruss P., Gitlin J. D. (2001) The metallochaperone Atox1 plays a critical role in perinatal copper homeostasis. Proc. Natl. Acad. Sci. U.S.A. 98, 6848–6852 [DOI] [PMC free article] [PubMed] [Google Scholar]
- 7. Huster D., Lutsenko S. (2007) Wilson disease: not just a copper disorder. Analysis of a Wilson disease model demonstrates the link between copper and lipid metabolism. Mol. Biosyst. 3, 816–824 [DOI] [PubMed] [Google Scholar]
- 8. Kaler S. G. (2011) ATP7A-related copper transport diseases: emerging concepts and future trends. Nat. Rev. Neurol. 7, 15–29 [DOI] [PMC free article] [PubMed] [Google Scholar]
- 9. Barry A. N., Shinde U., Lutsenko S. (2010) Structural organization of human copper-transporting ATPases: learning from building blocks. J. Biol. Inorg. Chem. 15, 47–59 [DOI] [PubMed] [Google Scholar]
- 10. Berndt C., Lillig C. H., Holmgren A. (2008) Thioredoxins and glutaredoxins as facilitators of protein folding. Biochim. Biophys. Acta. 1783, 641–650 [DOI] [PubMed] [Google Scholar]
- 11. Singleton W. C., McInnes K. T., Cater M. A., Winnall W. R., McKirdy R., Yu Y., Taylor P. E., Ke B. X., Richardson D. R., Mercer J. F., La Fontaine S. (2010) Role of glutaredoxin 1 and glutathione in regulating the activity of the copper-transporting P-type ATPases, ATP7A and ATP7B. J. Biol. Chem. 285, 27111–27121 [DOI] [PMC free article] [PubMed] [Google Scholar]
- 12. Pufahl R. A., Singer C. P., Peariso K. L., Lin S. J., Schmidt P. J., Fahrni C. J., Culotta V. C., Penner-Hahn J. E., O'Halloran T. V. (1997) Metal ion chaperone function of the soluble Cu(I) receptor Atx1. Science 278, 853–856 [DOI] [PubMed] [Google Scholar]
- 13. Hussain F., Olson J. S., Wittung-Stafshede P. (2008) Conserved residues modulate copper release in human copper chaperone Atox1. Proc. Natl. Acad. Sci. U.S.A. 105, 11158–11163 [DOI] [PMC free article] [PubMed] [Google Scholar]
- 14. Anastassopoulou I., Banci L., Bertini I., Cantini F., Katsari E., Rosato A. (2004) Solution structure of the apo- and copper(I)-loaded human metallochaperone HAH1. Biochemistry 43, 13046–13053 [DOI] [PubMed] [Google Scholar]
- 15. Gupta A., Bhattacharjee A., Dmitriev O. Y., Nokhrin S., Braiterman L., Hubbard A. L., Lutsenko S. (2011) Cellular copper levels determine the phenotype of the Arg-875 variant of ATP7B/Wilson disease protein. Proc. Natl. Acad. Sci. U.S.A. 108, 5390–5395 [DOI] [PMC free article] [PubMed] [Google Scholar]
- 16. LeShane E. S., Shinde U., Walker J. M., Barry A. N., Blackburn N. J., Ralle M., Lutsenko S. (2010) Interactions between copper-binding sites determine the redox status and conformation of the regulatory N-terminal domain of ATP7B. J. Biol. Chem. 285, 6327–6336 [DOI] [PMC free article] [PubMed] [Google Scholar]
- 17. Gilbert H. F. (1995) Thiol/disulfide exchange equilibria and disulfide bond stability. Methods Enzymol. 251, 8–28 [DOI] [PubMed] [Google Scholar]
- 18. Rahman I., Kode A., Biswas S. K. (2006) Assay for quantitative determination of glutathione and glutathione disulfide levels using enzymatic recycling method. Nat. Protoc. 1, 3159–3165 [DOI] [PubMed] [Google Scholar]
- 19. Huster D., Finegold M. J., Morgan C. T., Burkhead J. L., Nixon R., Vanderwerf S. M., Gilliam C. T., Lutsenko S. (2006) Consequences of copper accumulation in the livers of the Atp7b−/− (Wilson disease gene) knockout mice. Am. J. Pathol. 168, 423–434 [DOI] [PMC free article] [PubMed] [Google Scholar]
- 20. Tapryal N., Mukhopadhyay C., Mishra M. K., Das D., Biswas S., Mukhopadhyay C. K. (2010) Glutathione synthesis inhibitor butathione sulfoximine regulates ceruloplasmin by dual but opposite mechanism: implication in hepatic iron overload. Free. Radic. Biol. Med. 48, 1492–1500 [DOI] [PubMed] [Google Scholar]
- 21. Lizard G., Fournel S., Genestier L., Dhedin N., Chaput C., Flacher M., Mutin M., Panaye G., Revillard J. P. (1995) Kinetics of plasma membrane and mitochondrial alterations in cells undergoing apoptosis. Cytometry 21, 275–283 [DOI] [PubMed] [Google Scholar]
- 22. Aslund F., Berndt K. D., Holmgren A. (1997) Redox potentials of glutaredoxins and other thiol-disulfide oxidoreductases of the thioredoxin superfamily determined by direct protein-protein redox equilibria. J. Biol. Chem. 272, 30780–30786 [DOI] [PubMed] [Google Scholar]
- 23. Boal A. K., Rosenzweig A. C. (2009) Crystal structures of cisplatin bound to a human copper chaperone. J. Am. Chem. Soc. 131, 14196–14197 [DOI] [PMC free article] [PubMed] [Google Scholar]
- 24. Freedman J. H., Ciriolo M. R., Peisach J. (1989) The role of glutathione in copper metabolism and toxicity. J. Biol. Chem. 264, 5598–5605 [PubMed] [Google Scholar]
- 25. Ogra Y., Miyayama T., Anan Y. (2010) Effect of glutathione depletion on removal of copper from LEC rat livers by tetrathiomolybdate. J. Inorg. Biochem. 104, 858–862 [DOI] [PubMed] [Google Scholar]
- 26. Leitch J. M., Jensen L. T., Bouldin S. D., Outten C. E., Hart P. J., Culotta V. C. (2009) Activation of Cu,Zn-superoxide dismutase in the absence of oxygen and the copper chaperone CCS. J. Biol. Chem. 284, 21863–21871 [DOI] [PMC free article] [PubMed] [Google Scholar]
- 27. Mössner E., Huber-Wunderlich M., Rietsch A., Beckwith J., Glockshuber R., Aslund F. (1999) Importance of redox potential for the in vivo function of the cytoplasmic disulfide reductant thioredoxin from Escherichia coli. J. Biol. Chem. 274, 25254–25259 [DOI] [PubMed] [Google Scholar]
- 28. Lillig C. H., Berndt C., Holmgren A. (2008) Glutaredoxin systems. Biochim. Biophys. Acta. 1780, 1304–1317 [DOI] [PubMed] [Google Scholar]
- 29. Nkabyo Y. S., Ziegler T. R., Gu L. H., Watson W. H., Jones D. P. (2002) Glutathione and thioredoxin redox during differentiation in human colon epithelial (Caco-2) cells. Am. J. Physiol. Gastrointest. Liver Physiol. 283, G1352–1359 [DOI] [PubMed] [Google Scholar]
- 30. Satoh T., Sakai N., Enokido Y., Uchiyama Y., Hatanaka H. (1996) Survival factor-insensitive generation of reactive oxygen species induced by serum deprivation in neuronal cells. Brain Res. 733, 9–14 [DOI] [PubMed] [Google Scholar]
- 31. Filomeni G., Ciriolo M. R. (2006) Redox control of apoptosis: an update. Antioxid Redox Signal 8, 2187–2192 [DOI] [PubMed] [Google Scholar]
- 32. Kirlin W. G., Cai J., Thompson S. A., Diaz D., Kavanagh T. J., Jones D. P. (1999) Glutathione redox potential in response to differentiation and enzyme inducers. Free. Radic. Biol. Med. 27, 1208–1218 [DOI] [PubMed] [Google Scholar]
- 33. Mitozo P. A., de Souza L. F., Loch-Neckel G., Flesch S., Maris A. F., Figueiredo C. P., Dos Santos A. R., Farina M., Dafre A. L. (2011) A study of the relative importance of the peroxiredoxin-, catalase-, and glutathione-dependent systems in neural peroxide metabolism. Free. Radic. Biol. Med. 51, 69–77 [DOI] [PubMed] [Google Scholar]
- 34. Badarau A., Dennison C. (2011) Copper trafficking mechanism of CXXC-containing domains: insight from the pH dependence of their Cu(I) affinities. J. Am. Chem. Soc. 133, 2983–2988 [DOI] [PubMed] [Google Scholar]
- 35. Lin S. J., Culotta V. C. (1995) The ATX1 gene of Saccharomyces cerevisiae encodes a small metal homeostasis factor that protects cells against reactive oxygen toxicity. Proc. Natl. Acad. Sci. U.S.A. 92, 3784–3788 [DOI] [PMC free article] [PubMed] [Google Scholar]
- 36. Kelner G. S., Lee M., Clark M. E., Maciejewski D., McGrath D., Rabizadeh S., Lyons T., Bredesen D., Jenner P., Maki R. A. (2000) The copper transport protein Atox1 promotes neuronal survival. J. Biol. Chem. 275, 580–584 [DOI] [PubMed] [Google Scholar]
- 37. Banci L., Bertini I., Ciofi-Baffoni S., Hadjiloi T., Martinelli M., Palumaa P. (2008) Mitochondrial copper(I) transfer from Cox17 to Sco1 is coupled to electron transfer. Proc. Natl. Acad. Sci. U.S.A. 105, 6803–6808 [DOI] [PMC free article] [PubMed] [Google Scholar]
- 38. Leary S. C., Sasarman F., Nishimura T., Shoubridge E. A. (2009) Human SCO2 is required for the synthesis of CO II and as a thiol-disulphide oxidoreductase for SCO1. Hum. Mol. Genet. 18, 2230–2240 [DOI] [PubMed] [Google Scholar]
- 39. Furukawa Y., Torres A. S., O'Halloran T. V. (2004) Oxygen-induced maturation of SOD1: a key role for disulfide formation by the copper chaperone CCS. EMBO J. 23, 2872–2881 [DOI] [PMC free article] [PubMed] [Google Scholar]
- 40. Helbig K., Bleuel C., Krauss G. J., Nies D. H. (2008) Glutathione and transition metal homeostasis in Escherichia coli. J. Bacteriol. 190, 5431–5438 [DOI] [PMC free article] [PubMed] [Google Scholar]
- 41. Burkhead J. L., Ralle M., Wilmarth P., David L., Lutsenko S. (2011) Elevated copper remodels hepatic RNA processing machinery in the mouse model of Wilson disease. J. Mol. Biol. 406, 44–58 [DOI] [PMC free article] [PubMed] [Google Scholar]
- 42. Miyayama T., Suzuki K. T., Ogra Y. (2009) Copper accumulation and compartmentalization in mouse fibroblast lacking metallothionein and copper chaperone, Atox1. Toxicol. Appl. Pharmacol. 237, 205–213 [DOI] [PubMed] [Google Scholar]
- 43. Suzuki K. T., Someya A., Komada Y., Ogra Y. (2002) Roles of metallothionein in copper homeostasis: responses to copper-deficient diets in mice. J. Inorg. Biochem. 88, 173–182 [DOI] [PubMed] [Google Scholar]
- 44. Nartey N. O., Frei J. V., Cherian M. G. (1987) Hepatic copper and metallothionein distribution in Wilson disease (hepatolenticular degeneration). Lab. Invest. 57, 397–401 [PubMed] [Google Scholar]