

Background: Conformational changes in the EIC domain of enzyme I upon ligand binding are thought to regulate the phosphotransfer system by modulating the monomer/dimer equilibrium.
Results: Binding of phosphoenolpyruvate shifts a preexisting conformational equilibrium in EIC.
Conclusion: Conformational selection provides a direct structural link between ligand binding and dimer affinity.
Significance: Isolated EIC is an optimal system for investigating dynamic processes regulating EI.
Keywords: Biophysics, NMR, Phosphorylation Enzymes, Protein Structure, Signal Transduction, Conformational Dynamics, Conformational Selection, Enzyme I, Phosphoenolpyruvate:Sugar Phosphotransferase System, Relaxation Dispersion
Abstract
The bacterial phosphotransferase system (PTS) is a signal transduction pathway that couples phosphoryl transfer to active sugar transport across the cell membrane. The PTS is initiated by the binding of phosphoenolpyruvate (PEP) to the C-terminal domain (EIC) of enzyme I (EI), a highly conserved protein that is common to all sugar branches of the PTS. EIC exists in a dynamic monomer/dimer equilibrium that is modulated by ligand binding and is thought to regulate the overall PTS. Isolation of EIC has proven challenging, and conformational dynamics within the EIC domain during the catalytic cycle are still largely unknown. Here, we present a robust protocol for expression and purification of recombinant EIC from Escherichia coli and show that isolated EIC is capable of hydrolyzing PEP. NMR analysis and residual dipolar coupling measurements indicate that the isolated EIC domain in solution adopts a stable tertiary fold and quaternary structure that is consistent with previously reported crystallographic data. NMR relaxation dispersion measurements indicate that residues around the PEP binding site and in the β3α3 turn (residues 333–366), which is located at the dimer interface, undergo a rapid transition on the sub-millisecond time scale (with an exchange rate constant of ∼1500 s−1) between major open (∼97%) and minor closed (∼3%) conformations. Upon PEP binding, the β3α3 turn is effectively locked in the closed state by the formation of salt bridges between the phosphate group of PEP and the side chains of Lys340 and Arg358, thereby stabilizing the dimer.
Introduction
Enzyme I (EI)2 is the first protein in the bacterial phosphoenolpyruvate:sugar phosphotransferase system (PTS), a signal transduction pathway that couples phosphoryl transfer through a series of bimolecular protein-protein complexes to sugar transport across the membrane (1, 2). The PTS is also involved in the regulation of diverse cellular processes, including transcription, chemotaxis, and glycolysis (2). There are four sugar-specific branches of the PTS, but all require EI to initiate the phosphoryl transfer cascade. EI is autophosphorylated by phosphoenolpyruvate (PEP) and subsequently donates the phosphoryl group to the histidine phosphocarrier protein HPr (3, 4). EI and HPr are common to all branches of the PTS. Thereafter, the phosphoryl group is transferred from HPr to the sugar-specific enzymes II and ultimately onto the incoming sugar. It has been shown recently that, under conditions of nitrogen limitation, EI is inhibited by α-ketoglutarate (5), the carbon substrate for ammonia assimilation, thereby providing a regulatory link between central carbon and nitrogen metabolism in bacteria. EI is ubiquitous in bacteria and does not have any eukaryotic counterparts. Thus, given the central role of EI in the control and regulation of bacterial metabolism, it is no surprise that EI has been described as an ideal pharmaceutical target for the identification of novel and highly specific antimicrobials (6).
The functional form of EI is a ∼128-kDa dimer of identical subunits (7) comprising two structurally and functionally distinct domains (8, 9). The N-terminal phosphoryl-transfer domain (EIN, residues 1–249) contains the site of phosphorylation (His189) and the binding site for HPr (8, 10, 11). The C-terminal domain (EIC, residues 261–575) is responsible for dimerization and contains the binding site for PEP (12–14). The EIN and EIC domains are connected to one another (15–18) by a long helical linker.
The isolated EIN domain can transfer a phosphoryl group to HPr but only intact dimeric EI can be autophosphorylated by PEP (8, 9, 13, 19–21). It has therefore been suggested that the monomer/dimer equilibrium for the EIC domain plays a central role in the regulation of the overall PTS (22). Indeed, the interaction of EI with the physiological ligands for the EIC domain, Mg2+ and PEP, decreases the equilibrium dissociation constant for dimerization (KD) by ∼30-fold (from 4.8 to 0.15 μm (14, 22). Given the intracellular EI concentration of ∼10 μm subunits (23), binding of Mg2+ and PEP to EI results in a significant shift in the monomer/dimer equilibrium and a concomitant substantial increase in the cellular population of dimeric EI (from ∼60 to 90%).
There is now a wealth of structural studies on EI. The isolated EIN domain from Escherichia coli has been solved in its free form by crystallography (10) and NMR (11) as well as in its phosphorylated state (24) and bound to HPr (25) by NMR. In all three cases, the structure of the EIN domain and the relative orientation of the α and α/β subdomains remain unchanged. There are three crystal structures of intact EI, two of free EI from Staphylococcus carnosus (26) and Staphylococcus aureus (16), and one of a trapped phosphorylated intermediate of E. coli EI bound to the inhibitor oxalate (15). In addition, there are two solution structures of E. coli EI, free and bound to HPr, determined by the combined use of NMR and x-ray scattering (17, 18). The EI structures reveal large rigid body conformational transitions involving domain reorientation of EIN relative to EIC, as well as reorientation of the two subdomains of EIN relative to each other. These large-scale conformational changes permit transfer of the phosphoryl group from PEP bound to the EIC domain to His189 located on EIN in the conformation found in the trapped phosphorylated intermediate (15), and subsequent transfer of the phosphoryl group on His189 to HPr in the conformation found in the structures of free EI and the EI-HPr complex where the structure of the EIN domain is identical to that of the isolated EIN domain (17). In addition, crystal structures of the isolated EIC domain from Thermoanaerobacter tengcongensis in the free form (27) and in complexes with PEP and pyruvate (28) have been obtained. Although the structure of the EIC domain is the same in intact EI and the isolated EIC domain, spectroscopic and kinetic investigations have suggested that in solution the EIC domain may be present as an ensemble of different conformations that are not apparent in the crystal structures (14).
The recombinant E. coli EIC domain has been reported to be proteolytically unstable and difficult to isolate (14, 29). Here, we present a robust protocol for expression and purification of recombinant E. coli EIC. We show that the purified protein adopts a single, stable fold in solution and is able to hydrolyze PEP into pyruvate and inorganic phosphate. Using relaxation dispersion NMR spectroscopy (30, 31), we demonstrate the existence of a rapid local conformational transition on the submillisecond time scale between two states, a major open state and a minor closed state, involving residues in the vicinity of the active site. Chemical shift analysis indicates that the conformation of the minor species is similar to that of the PEP-bound state, indicating that PEP binding likely proceeds via conformational selection. Furthermore, in combination with the available crystal structures, the data provide a rationale for understanding dimer stabilization by PEP. The data presented here suggest that EIC represents a good model system for studying the combined effects of substrate binding and conformational dynamics on enzymatic regulation.
EXPERIMENTAL PROCEDURES
Protein Expression and Purification
Intact EI (residues 1–575) and the EIN domain (residues 1–249) were expressed and purified as described previously (17, 24). The EIC domain (residues 261–575) was cloned into a pET11a vector (Novagen) without tags. The plasmid was introduced into E. coli strain BL21star(DE3) (Invitrogen), and the transformed bacteria were plated onto an LB-agar plate containing ampicillin (100 μg/ml) for selection. Cells were grown at 37 °C in either Luria Bertani (LB) or minimal medium (with 15NH4Cl and 13C6-glucose as the sole nitrogen and carbon sources, respectively) in H2O or D2O, respectively. At A600 ∼ 0.4 (for LB cultures) or A600 ∼ 0.8 (for cultures in minimal medium), the temperature was reduced to 20 °C, and expression was induced with 1 mm isopropyl-d-thiogalactopyranoside. Cells were harvested by centrifugation after 16 h of induction, and the pellet was resuspended in 20 ml of 20 mm Tris, pH 8.0, 2 mm dithiothreitol (DTT), 1 mm ethylenediaminetetraacetic acid (EDTA), and 1 mm phenylmethylsulfonyl fluoride (PMSF). The suspension was lysed using a microfluidizer and centrifuged at 70,000 × g for 40 min. The supernatant was filtered and loaded onto a DEAE anion exchange column (20 ml; GE Healthcare), and the protein was eluted with a 400 ml gradient of 1 m NaCl. The fractions containing the protein were confirmed by SDS-PAGE and purified by gel filtration on a Superdex-75 column (GE Healthcare) equilibrated with 20 mm Tris, pH 7.4, 200 mm NaCl, 2 mm DTT, and 1 mm EDTA. Relevant fractions were loaded on a monoQ anion exchange column (GE Healthcare), and the protein was eluted with a 400-ml gradient from 150 mm to 400 mm NaCl.
NMR Spectroscopy
All of the NMR samples were prepared in 20 mm Tris buffer, pH 7.4, 100 mm NaCl, 4 mm MgCl2, 1 mm EDTA, 2 mm DTT, and 90% H2O/10% D2O (v/v). The protein concentration (in subunits) was 300–400 μm unless stated otherwise.
NMR spectra were recorded at 37 °C on Bruker 900 and 600 MHz spectrometers equipped with either a z-shielded gradient triple resonance cryoprobe or, for 31P NMR, an x,y,z-shielded gradient quadruple resonance probe. Spectra were processed using NMRPipe (32) and analyzed using the program SPARKY.
Sequential 1H/15N/13C backbone assignment of the EIC domain was carried out using transverse relaxation optimized (TROSY) versions (33, 34) of conventional three-dimensional triple resonance correlation experiments (HNCO, HNCA, HNCACB, HN(CO)CA, and HN(CO)CACB) (35). The 1H/15N/13C backbone chemical shifts have been deposited in the BioMagResBank (accession no. 18392) (36). Assignment of the 1HN-15N correlations for the EIC-PEP complex was performed by titration experiments, following the change in 1H-15N cross-peak positions as a function of added PEP in 1H-15N TROSY spectra. Weighted combined 1H/15N chemical shift perturbations (ΔH/N) resulting from the addition of 10 mm PEP were calculated using the following equation (37): ΔH/N = ((ΔδHWH)2 + (ΔδNWN)2)½, where WH and WN are weighing factors for the 1HN and 15N amide shifts, respectively (WH = 1, WN = 0.154), and ΔδH and ΔδN are the 1HN and 15N chemical shift differences in ppm, respectively, between free and bound states.
Backbone amide 1DNH residual dipolar couplings (RDCs) were measured by taking the difference in 1JNH scalar couplings in aligned and isotropic media (38). The alignment media employed was phage pf1 (14 mg/ml for EIC and 18 mg/ml for the EIC-PEP complex; ASLA Biotech) (39, 40), and 1JNH couplings were measured using the ARTSY (amide RDCs by TROSY spectroscopy) pulse scheme (41). Singular value decomposition (SVD) analysis of RDCs was carried out using Xplor-NIH (42).
Relaxation dispersion experiments were conducted using a pulse sequence that measures the exchange contribution for the TROSY component of the 15N magnetization (43). Off-resonance effects and pulse imperfections were minimized using a four-pulse phase scheme (44). Carr-Purcell-Meinboom-Gill (CPMG) experiments were performed at 600 and 900 MHz with a fixed relaxation delay but a changing number of refocusing pulses to achieve different effective CPMG fields (45). The transverse relaxation periods were set to 40 and 20 ms at 600 and 900 MHz, respectively. The effective CPMG fields employed were 100, 200, 300, 400, 500, 600, 700, 800, 900, 1000 Hz at 600 MHz, and 200, 400, 600, 800, and 1000 Hz at 900 MHz. The resulting relaxation dispersion curves were fit to a two-state exchange process using Equation 1 (46, 47),
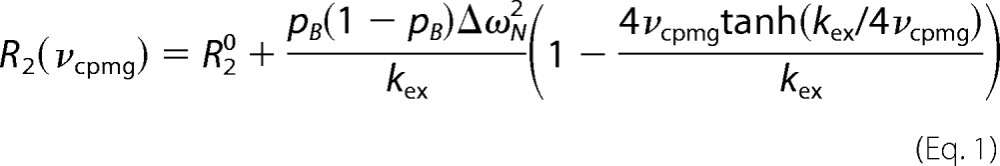 |
where R20 is the transverse 15N R2 in the absence of exchange; pB is the relative population of the minor populated state; ΔωN is the 15N chemical shift difference between the two states; kex is the exchange rate constant (given by the sum of the forward and backward rate constants kAB and kBA for the transitions from the major species A to the minor species B and back; and νcpmg is the CPMG field defined as ½τcp, where τcp is the spacing between the centers of successive 180° refocusing pulses in the CPMG pulse sequence (45).
Activity Assay
Enzymatic activity of EI and EIC for the hydrolysis of PEP to inorganic phosphate and pyruvate were assayed spectrophotometrically at 37 °C using the EnzChek phosphate assay kit (Invitrogen) and a Nanodrop 2000 spectrophotometer. The reaction mixtures were prepared as follows: 25 μl of 20× reaction buffer from the kit (1.0 m Tris-HCl, 20 mm MgCl2, pH 7.5, 2 mm sodium azide), 7.9 μl of 5 m NaCl, x μl PEP, y μl enzyme, 362.1 - x - y μl doubly distilled H2O. The mixtures were preincubated at 37 °C for 10 min prior to the addition of either EI or EIC at a final concentration of ∼5 μm. For the following 4 h, 39.5-μl aliquots of the reaction mixture were taken at regular intervals and incubated for 10 min with 10 μl of 1 mm 2-amino-6-mercapto-7-methylpurine riboside (MESG) and 0.5 μl of 10 units/ml purine nucleoside phosphorylase. In the presence of purine nucleoside phosphorylase, MESG quantitatively reacts with inorganic phosphate to generate ribose 1-phosphate and 2-amino-6-mercapto-7-methylpurine. Enzymatic conversion of MESG results in a spectrophotometric shift in maximum absorbance from 330 nm for MESG to 360 nm for 2-amino-6-mercapto-7-methylpurine.
Enzymatic assays for EI and EIC were run in duplicate, and the obtained A360 values were converted to μmol units using a calibration curve generated from the standard solution of inorganic phosphate provided by the kit. Initial velocities were determined from the linear portion of the progress curves and were fit using the Michaelis-Menten equation.
RESULTS AND DISCUSSION
Expression and Isolation of Recombinant E. coli EIC
Expression of recombinant E. coli EIC (residues 261–575), without addition of any affinity or solubility tag, is described in the “Experimental Procedures.” Purification of EIC from the cell lysate was carried out using a three-step chromatography protocol: weak anion exchange, size exclusion, and a final purification step with a strong anion exchanger (for details, see “Experimental Procedures”). Although the first anion exchange step allowed separation of EIC from most of the nucleic acid and protein contaminants, size exclusion chromatography was the key for successful purification of a stable EIC sample. EIC elutes from a Superdex 75 size exclusion column as two partially resolved peaks that have retention volumes of ∼125 ml and ∼150 ml, referred to as species 1 and 2, respectively, in Fig. 1A.
FIGURE 1.

Isolation and purification of E. coli EIC. A, size exclusion chromatography elution profile. B and C, chromatograms of the final anion exchange step obtained for species 1 and 2, respectively. The salt gradient is shown in red. D and E, 600 MHz 1H-15N TROSY correlation spectra obtained for EIC from species 1 and 2, respectively. Buffer conditions are as described under “Experimental Procedures.” F, selected regions of the 1H-15N TROSY spectrum showing the overlap of EI (blue) and EIC (red) cross-peaks. The cross-peaks for the isolated EIN domain are displayed in green for completeness. NMR spectra for the isolated EIN and EIC domains were acquired at 600 MHz. The full-length EI spectrum was acquired at 900 MHz. mAU, milli absorbance unit.
The final anion exchange step on species 1 reveals the presence of at least four similarly populated EIC isoforms, eluting between 250–350 mm NaCl (Fig. 1B), and the 1H-15N TROSY correlation spectrum obtained on a combined sample of these isoforms shows very poor cross-peak dispersion (Fig. 1D). These data indicate that EIC from species 1 is largely unfolded.
In contrast the anion exchange profile for species 2 is dominated by a major peak eluting at ∼300 mm NaCl (Fig. 1C), and the 1H-15N TROSY spectrum acquired for this species is highly dispersed (Fig. 1E), indicative of a stably folded protein. EIC purified from species 2 (note that a slower salt gradient centered at 300 mm NaCl was needed to completely remove contaminations arising from species 1; see “Experimental Procedures”) is >90% pure (as determined by SDS-PAGE) and is stable for >3 weeks at 37 °C in the presence of 4 mm Mg2+. Moreover, mutation of Met469, which is localized at the dimer interface, to the unnatural amino acid p-acetyl-l-phenylalanine (a construct not used in the present study) results in large chemical shift perturbations in the 1HN/15N cross-peaks of opposing residues in the other subunit (48), and the overlay of the EI and EIC 1H-15N correlation spectra shows excellent agreement with only small differences in cross-peak positions (Fig. 1E). These data clearly indicate that, in the presence of 4 mm MgCl2 and 100 mm NaCl, the isolated EIC domain is a dimer with the same fold as that in the full-length EI.
Solution Tertiary Structure of Free E. coli EIC
Crystallographic data show that E. coli EIC is a ∼ 70-kDa dimer exhibiting an (α/β)8-barrel fold with the active site Cys502 located in the β7α7 turn (15). Comparison of the x-ray structures of T. tengcongensis EIC free and bound to PEP indicates that substrate binding causes rearrangements of a few side chains (Arg296, Phe354, Gln458, Arg465, Met466, and Glu504) in the active site but leaves the overall tertiary fold and quaternary structure unperturbed (28). By way of contrast, sedimentation velocity and thermal denaturation experiments have shown that the addition of PEP stabilizes the protein fold and decreases the equilibrium dissociation constant for dimerization (14). PEP binding also results in marked changes in the near UV CD and fluorescence spectra, suggesting that EIC undergoes conformational rearrangements upon PEP binding (14). These spectroscopic techniques, however, only provide averaged information on aromatic side chains, so that one cannot ascertain whether the observed spectral changes reflect global effects or local conformational transitions.
Here, we investigated the effect of PEP on the solution structure E. coli EIC by NMR. 1H, 15N, and 13C backbone resonances of free EIC were assigned for 278 of 316 amino acids. The backbone ψ/φ torsion angles derived from the backbone chemical shifts using the program TALOS+ (49) are in excellent agreement with the x-ray structure of the trapped phosphorylated intermediate of E. coli EI (Fig. 2A) (15). Thus, one can conclude that the tertiary structure of the isolated EIC domain in solution is essentially the same as that in the crystal structure of full-length EI. 1HN/15N cross-peaks for several residues located in the PEP binding site (Val428–Thr432, Gly452–Tyr559, Cys502–Glu504) are not visible in the 1H-15N TROSY spectrum of EIC, indicating that this region of the protein is undergoing a conformational transition on the submillisecond to millisecond time scale (i.e. intermediate exchange on the chemical shift time scale resulting in line-broadening beyond the level of detection).
FIGURE 2.

Structure and dynamics of the free EIC domain. A, Correlation between the backbone φ/ψ torsion angles derived from backbone 1H/15N/13C chemical shifts using the program TALOS+ (49) and those in the crystal structure of the trapped phosphorylated intermediate of intact E. coli EI (15). The data for loop regions (where conformational differences between solution and crystal are to be expected) are depicted as open circles, whereas the data for secondary structure elements are reported as filled circles. The overall correlation coefficient is 0.90, and the correlation coefficient computed using only the data from secondary structure elements is 0.95. deg., degrees. B, structural model for the E. coli EIC-PEP complex. The model was obtained by rigid-body least-square fitting of the backbone atoms of the x-ray structure of the EIC-PEP complex from T. tengcongensis (28) onto the EIC coordinates of the x-ray structure of phosphorylated EI from E. coli (15). The fitting was carried out using residues 261–333 and 367–570, and the Cα rms difference is 1.1 Å. Ribbons of the two identical subunits are depicted in yellow and white. The PEP molecule is displayed as green bonds, and the side chains of Lys340, Arg358, and Arg465 are shown as red bonds. The nitrogen atoms of amide groups exhibiting significant 15N relaxation dispersion, characteristic of dynamics on the submillisecond to millisecond time scale, are shown as blue spheres. The inset provides a close-up of the β3α3 turn. The turn is highlighted in cyan, the carbonyl groups of Ile336 and Lys340 are shown as spheres (gray for carbon, red for oxygen), and the amide groups of residues in this region displaying relaxation dispersion are shown as spheres, blue for nitrogen and white for the associated amide proton. C, close-up view of the EIC dimer interface. The two subunits are colored in white and yellow. The atoms of Leu355, Trp357, and Asn467 are represented as red spheres. D, superposition of the x-ray structures of EIC (15, 16, 26–28), illustrating the conformational variability in the β3α3 turn. The β3α3 turn in the closed conformation seen in the x-ray structure of phosphorylated EI is highlighted in red; in all other cases, the β3α3 turn is in the open conformation and colored in cyan. PEP is displayed as a green bond. The amide groups (blue for N, white for HN) of Gly337 and Ala359, as well as the carbonyl groups (red for O, gray for C′) of Ile336 and Lys340 (red), are shown as spheres on the phosphorylated EI structure. E, examples of typical relaxation dispersion data at 600 MHz (left panel) and 900 MHz (right panel). Data are shown for Glu341 (red) and Ala359 (blue) with the experimental data represented by filled circles and the best-fit curves for a two-site exchange model as solid lines. The optimized values of the kinetic, population, and chemical shift parameters derived from the relaxation dispersion data are provided in Table 1.
Relaxation Dispersion on Free EIC
To characterize the dynamics in the region of the PEP binding site, we carried out CPMG 15N-relaxation dispersion experiments (31) at 600 and 900 MHz. These experiments probe exchange dynamics between species with distinct chemical shifts on a time scale ranging from ∼50 μs to 10 ms. Significant relaxation dispersion was observed for the backbone amides of a number of residues in the vicinity of the PEP binding site: Ile426 and Gly427 at the N-terminal end of strand β5; Arg465 and Asn467 located in the turn/loop (residues 453–477) connecting strand β6 to helix α6; and Gly337, Lys340, Glu341, Leu355, Trp357, Arg358, and Ala359 located in the turn/loop (residues 333–366) connecting strand β3 to helix α3 (Fig. 2B). Three of the residues, Leu355, Trp357, and Asn467, are also located at the dimer interface (Fig. 2C). The 15N-relaxation dispersion curves for all the above residues at both fields (600 and 900 MHz) were fit simultaneously to a two-state model (Equation 1 in “Experimental Procedures”) describing the interconversion of two conformational states, optimizing the values of the exchange rate (kex), the fractional population of the minor state (pB), and the residue-specific 15N chemical shift differences between the two conformational states (ΔωN). An example of the fits is provided in Fig. 2E, and a summary of the results is provided in Table 1. The population of the minor species is ∼3%, and the overall exchange rate (sum of forward and backward rate constants) is ∼1500 s−1. These parameters yield values of the rate constants for the conversion from the major to the minor species and from the minor to the major species of ∼50 and ∼1500 s−1, respectively.
TABLE 1.
Kinetic, population, and chemical shift parameters for conformational exchange between open and closed states of EIC derived from relaxation dispersion experiments
All of the relaxation dispersion curves at two fields (600 and 900 MHz) were fit simultaneously to a two-site exchange model, optimizing the values of two global parameters, the overall exchange rate (kex) and the population of the minor state (pB), and the residue-specific |ΔωN| values, which represent the absolute 15N chemical shift difference between the major and minor states.
| Gly337 | Lys340 | Glu341 | Leu355 | Trp357 | Arg358 | Ala359 | Ile426 | Gly427 | Arg465 | Asn467 | |
|---|---|---|---|---|---|---|---|---|---|---|---|
| Global parameters | |||||||||||
| kex (s−1) | 1520 ± 350 | ||||||||||
| pB (%) | 3 ± 1 | ||||||||||
| kAB (s−1)a | 46 ± 26 | ||||||||||
| kBA (s−1)a | 1474 ± 385 | ||||||||||
| Residue-specific parameters | |||||||||||
| |ΔωN| (ppm)b | 2.0 | 0.6 | 1.0 | 1.1 | 1.0 | 0.7 | 2.0 | 1.9 | 2.0 | 0.8 | 0.8 |
| 15N chemical shift perturbation from PEP titration experiment | |||||||||||
| DdN (ppm)c | 0.9d | 1.3 | 2.3 | 2.2 | 1.3 | ||||||
a The open (major) and closed (minor) states are referred to as A and B. kAB and kBA are the rate constants for the transition from A to B and from B to A, respectively, and are calculated from the values of the optimized parameters kex (kAB + kBA) and pB.
b The error in the values of |ΔωN| is ± 0.1 ppm with the exception of those for Leu355 and Arg465, which are ± 0.2 ppm.
c 15N chemical shift perturbations upon addition of 10 mm PEP are provided for comparison with the values of |ΔωN| obtained from the relaxation dispersion experiments on free EIC.
d The significant difference between |ΔωN| and ΔδN observed for Gly337 can be ascribed to the different conformations adopted by the side chain of Arg358 in free EIC and the EIC-PEP complex. In the crystal structures of free EIC, the guanidino group of Arg358 is located 4–5 Å away from the backbone amide of Gly337. However, in the structural model for the EIC-PEP complex displayed in Fig. 2, the Arg358 side chain directly interacts with PEP and the positively charged guanidino group is located >6 Å away from the backbone amide of Gly337. Because the relaxation dispersion experiments were acquired in the absence of substrate, the effect of this conformational change on the 15N chemical shifts of EIC are observable in the ΔδN values only.
Consistent with the relaxation dispersion results, an overlay of the crystal structures of the EIC domain (15, 16, 26–28) obtained to date (Fig. 2D) shows that the backbone of the Gly337–Tyr344 segment of the β3α3 turn can adopt one of two conformations: an open state observed in the crystal structures of both free EI (from S. aureus and S. carnosus) and the isolated T. tengcongensis EIC domain (free and bound to PEP or pyruvate) (cyan tubes in Fig. 2D); and a closed state found in the crystal structure of the trapped phosphorylated intermediate of E. coli EI (red tube in Fig. 2D). The closed state is stabilized by hydrogen bonds from the backbone amide groups of Gly337 and Ala359 to the backbone carbonyls Lys340 and Ile336, respectively. Both of these hydrogen bonds are absent in the open state found in the crystal structure of S. aureus EI (16), and the Gly337 → Lys340 hydrogen bond is missing in all crystal structures of the open state (16, 26–28). Of note is that among the residues of the β3α3 turn displaying relaxation dispersion, Gly337 and Ala359 show the largest ΔωN values (Table 1), suggesting that the exchange process detected by the relaxation dispersion experiments corresponds to the open/closed transition. The conformational dynamics detected in the β3α3 turn extend all the way to the dimer interface, also affecting Arg465 and Asn467, which directly face the β3α3 turn in the other subunit (Fig. 2, B and C).
Effect of PEP on Spectrum of EIC
Addition of 10 mm PEP to EIC results in substantial changes in the 1H-15N TROSY spectrum (Fig. 3A). However, as we discuss in depth in a subsequent section, we noticed that formation of the EIC-PEP complex also results in degradation of PEP into pyruvate and inorganic phosphate, making the lifetime of the EIC-PEP complex too short (<4 h at 37 °C with 400 μm EIC and 10 mm PEP) to allow acquisition of the three-dimensional triple resonance experiments necessary for sequential backbone resonance assignment. Thus, only those 1H-15N cross-peaks that could be tracked unambiguously in a PEP titration experiment were assigned in the EIC-PEP complex and used for further analysis.
FIGURE 3.

Structure and dynamics of the EIC-PEP complex. A, 600 MHz 1H-15N TROSY correlation spectrum of EIC in the absence (red) and presence (blue) of 10 mm PEP. B, structural model for the EIC-PEP complex (see legend to Fig. 2) showing the extent of 1HN/15N chemical shift perturbation (ΔH/N; see “Experimental Procedures” for details) upon addition of 10 mm PEP to the protein sample. Assigned backbone amides are depicted as spheres and colored according to their ΔH/N values (color scale ranges from blue to red). Amide groups assigned only for free EIC are displayed as gray spheres. The inset shows a close-up of the dimer interface. The amide groups exhibiting ΔH/N values > 0.2 ppm are displayed as spheres. C, selected regions of the 1H-15N TROSY spectrum of EIC showing the effect of increasing concentrations of PEP on cross-peaks originating from residues in the β3α3 turn. The color code is as follows: red, 0 mm PEP; green, 0.2 mm PEP; yellow, 0.4 mm PEP; purple, 1 mm PEP; blue, 10 mm PEP. It should be noted that because PEP is hydrolyzed by EIC (see main text), the listed PEP concentrations are approximate values. D, ΔH/N profile.
The assigned backbone amides for the EIC-PEP complex and the corresponding 1H/15N chemical shift perturbations (ΔH/N) arising from PEP binding are depicted on the EIC structure in Fig. 3B. Although the 1H-15N cross-peaks of residues directly facing PEP were completely broadened out after addition of ligand, large ΔH/N values were still observed for the flanking residues (Ile275, Gly276, Ile426, and Gly427) suggesting that structural rearrangements are occurring at the active site (Fig. 3, B and D). Moreover, the 1H-15N cross-peaks of residues in the β3α3 turn experience extensive line broadening upon addition of PEP (Fig. 3C), indicating that the binding of the substrate affects the conformational dynamics detected in this area.
The perturbations on the 15N chemical shifts (ΔδN) of EIC observed upon PEP binding are in excellent agreement with the |ΔωN| values obtained from the relaxation dispersion measurements on free EIC (Table 1), strongly suggesting that binding of PEP shifts the conformational equilibrium detected in free EIC from the open to the closed state. This is consistent with the model of the E. coli EIC-PEP complex (Fig. 2B), derived from the structures of E. coli phosphorylated EI (15) and the T. tengcongensis EIC-PEP complex (28), which shows that salt bridges between the phosphate group of PEP and the side chains of Lys340 and Arg358 lock the β3α3 turn in the closed conformation, providing further stabilization to the Gly337 → Lys340 and Ala359 → Ile336 backbone hydrogen bonds. These key interactions, together with an additional salt bridge between the phosphoryl group of PEP and the guanadino group of Arg465 (Fig. 2B), also serve to stabilize the backbone conformation of Leu355, Trp357, and Asn467 in the closed state observed in the x-ray structure of phosphorylated EI. Because Leu355, Trp357, and Asn467 are involved in several intersubunit contacts (Fig. 2C), the above observations explain the lower dimerization KD measured for EI in the presence of PEP (22), as well as the large ΔH/N perturbations induced by PEP for Glu351, Asn352, Gly356, and Trp357 in the β3α3 turn, and for Arg465, Asp468, Ile470, and Asn475 at the dimer interface (Fig. 3, B and C). In addition, the β3α3 turn is rich in aromatic residues (Tyr344, Phe347, Phe354, and Trp357), so that conformational rearrangements in this region are fully consistent with the changes observed in the CD and fluorescence spectra of EIC upon PEP binding (14).
Effect of PEP on Quaternary Structure of EIC
To assess whether the local conformational changes in the β3α3 turn observed in EIC upon PEP binding affect the subunit orientation in the EIC dimer, backbone amide (1DNH) RDCs for well resolved 1H-15N cross-peaks were measured on samples of weakly aligned EIC and the EIC-PEP complex in a dilute liquid crystalline medium of phage pf1 (39). To avoid structural noise from flexible regions, only the backbone amides from secondary structure elements were included in the analysis. This necessary precaution, together with the fact that a low protein concentration was used in the EIC-PEP sample to limit the rate of PEP hydrolysis, reduced the number the experimental RDCs available for the EIC-PEP complex to 37 (Table 2). However, because 1DNH RDCs provide orientational information on NH bond vectors relative to an external alignment tensor (38, 50), the subunit structure of EIC is known, and one of the principal components of the alignment tensor must lie along the C2 symmetry axis of the dimer (17), this small number of RDCs is sufficient to fully describe the relative orientation of the two symmetry-related subunits (51).
TABLE 2.
SVD analysis of 1DNH RDCs for the monomeric and dimeric forms of EIC and EIC-PEP
The coordinates used for SVD analysis are those of EIC in the crystal structure of phosphorylated EI (15). The RDCs for the EIC-PEP complex were measured on samples containing 100 μm EIC and 50 mm PEP. The stability of the NMR samples used for measuring the RDCs was confirmed by acquiring 1H-15N TROSY spectra immediately before and after the acquisition of the ARTSY experiment.
| Monomer/dimera |
|||||||
|---|---|---|---|---|---|---|---|
| Number of RDCs | Euler angles (°)b |
Dab | ηb | R-factorc | |||
| φ | θ | ψ | |||||
| Hz | % | ||||||
| EIC | 86/172 | 99/93 | 21/20 | 167/172 | 18.8/18.8 | 0.41/0.42 | 18.4/18.6 |
| EIC-PEP | 37/74 | 107/95 | 17/17 | 178/170 | 13.1/13.2 | 0.11/0.09 | 21.6/22.6 |
a The first and second numbers listed give the results of the SVD fits to a single subunit and to the dimer.
b The alignment tensor is described by five parameters: three Euler angles (φ, θ, and ψ), the magnitude of the alignment tensor Da, and the rhombicity η. For a symmetric dimer, one of the axes of the principal components of the alignment tensor coincides with the C2 symmetry axis of the dimer. The fact that the values of the alignment tensor and RDC R-factor are the same for the SVD fits to a monomer and a dimer indicates that the orientation of the two subunits in the dimer in solution is the same as that in the crystal structure.
c The RDC R-factor is given by [〈(Dobs − Dcalc)2〉/(2〈Dobs2〉]½, where Dobs and Dcalc are the observed and calculated RDCs, respectively (52).
Singular value decomposition fitting of the experimental 1DNH RDCs to the coordinates of a single subunit from the phosphorylated EI x-ray structure (15) yields RDCs R-factors (52) of <22% for both EIC and the EIC-PEP complex (Fig. 4 and Table 2), confirming that the tertiary subunit fold of the secondary structure elements is unchanged relative to the crystal structure. The decrease in both the axial component of the alignment tensor, Da, and the rhombicity upon addition of PEP (Table 2) reflects changes in the surface charge distribution arising from the presence of PEP.
FIGURE 4.

RDC analysis of free EIC and the EIC-PEP complex. A, free EIC. B, EIC-PEP complex. The two panels show a comparison of the observed and calculated RDCs obtained by SVD to the coordinates of an individual subunit of EIC (blue open circles) and the EIC dimer (red filled circles). The coordinates of the x-ray structure of phosphorylated EI from E. coli were used (15).
When the RDCs measured for EIC and the EIC-PEP complex are fitted to coordinates of the dimer, the RDC R-factors increase by <1% (reflecting the doubling of the number of RDCs), and only minor variations within experimental error are observed in the Euler angles (Table 2), relative to the fits obtain with an individual subunit. These data demonstrate unambiguously, that although PEP binding results in local conformational changes within the active site and β3α3 turn, the relative subunit orientation within the dimer is unaffected by the substrate and is the same as that observed in the various crystal structures.
Enzymatic Activity of E. coli EIC
During the course of our NMR studies on the EIC-PEP complex, we noticed that the 1H-15N TROSY correlation spectrum for the EIC-PEP complex changes over time and slowly reverts to that of the free protein, indicating that EIC degrades PEP and that the degradation products are no longer able to interact with the protein. This is confirmed by 31P NMR, which shows that a 100 μm EIC sample is able to fully hydrolyze 10 mm PEP into phosphate and pyruvate in <16 h (Fig. 5A). Similar results are obtained with full-length EI (Fig. 5A).
FIGURE 5.

Enzymatic activity of EIC. A, 31P NMR spectra showing hydrolysis of PEP catalyzed by EI and EIC. The blue spectra were acquired on 100 μm samples of EI (left panel) and EIC (right panel) immediately after addition of 10 mm PEP. The red spectra were acquired after 16 h of incubation at 37 °C at which time all the PEP has been hydrolyzed to inorganic phosphate and pyruvate. B, Michaelis-Menten kinetics for EI (blue) and EIC (red) with the substrate PEP. C, schematic diagram showing the possible PEP degradation pathways by EIC (top) and EI (bottom). For each equilibrium, the velocity of the forward reaction is provided. Velocities for the equilibria a, b, c, and f were calculated based on the kcat/Km values reported in Table 3 for EI (b) and EIC (a, c, and f). The velocity for the equilibrium d was calculated based on the second-order rate constant obtained for the EI autophosphorylation reaction at 25 °C (21). The velocity for the equilibrium e was calculated based on the half-life (t½) for the decay of phosphorylated EI to unphosphorylated EI reported by Suh et al. (24). For all conversions, Km was set to 350 μm, and the EI concentration was set to 5 μm.
An enzymatic assay that detects the amount of inorganic phosphate released as a consequence of PEP degradation (see “Experimental Procedures”), reveals that the hydrolysis of PEP by both EI and EIC follows Michaelis-Menten kinetics with Km values of 327 and 374 μm, respectively (Fig. 5B and Table 3). These values agree well with the previously reported Km (∼ 400 μm) for the EI-PEP interaction (20) and indicate that the isolated EIC domain binds PEP with essentially the same affinity as the full-length protein.
TABLE 3.
Michaelis-Menten parameters for the hydrolysis of PEP into inorganic phosphate and pyruvate by EI and EIC
| Km | Vmax | kcat | kcat/Km | |
|---|---|---|---|---|
| μm | μmol s−1 | s−1 | m−1 s−1 | |
| EI | 328 ± 25 | 383 (±6) × 10−8 | 1.9(±1.5) × 10−3 | 5.9 ± 1.7 |
| EIC (species 2)a | 374 ± 30 | 267 (±5) × 10−8 | 1.3(±1.1) × 10−3 | 3.6 ± 1.5 |
| EIC (species 1)b | <3 × 10⁻⁸ |
a EIC purified from species 2 exhibits a well dispersed 1H-15N TROSY correlation spectrum typical of a folded protein (Fig. 1E).
b EIC purified from species 1 exhibits a 1H-15N TROSY correlation spectrum typical of an unfolded, partially folded, or incorrectly folded protein with minimal chemical shift dispersion (Fig. 1D).
Differences, however, are observed for the EI and EIC kinetics, with full-length EI hydrolyzing PEP with ∼1.5 times higher efficiency (reported as kcat/Km in Table 3) than the isolated EIC domain. A schematic diagram for the PEP degradation pathways catalyzed by EI and EIC is shown in Fig. 5C. The autophosphorylation reaction (equilibrium d in Fig. 5C), which initiates the PTS and occurs in only the full-length protein, is ∼6 orders of magnitude faster than the direct hydrolysis of PEP into pyruvate and inorganic phosphate catalyzed by EIC (equilibria a and c in Fig. 5C). Phosphorylated EI, that is rapidly formed after addition of PEP to the full-length protein, can generate inorganic phosphate through two independent pathways that occur with similar velocities (equilibria e and f in Fig. 5C), explaining the higher efficiency of PEP degradation exhibited by the full-length protein relative to EIC. It is also worth noting that no hydrolysis of PEP by EIC purified from species 1 (see “Expression and Isolation of Recombinant E. coli EIC” and Fig. 1, A and B) could be detected by the enzymatic assay (Table 3), further confirming that species 1 is an inactive EIC isoform.
Concluding Remarks
Binding of PEP to the EIC domain of EI initiates the PTS (9) by inducing a series of intra- and interdomain conformational rearrangements (15, 17) that result in phosphorylation of EIN and subsequent transfer of the phosphoryl group to HPr. Although conformational changes in EIC are thought to play an important role in regulation of the overall PTS (14, 22), the conformations adopted by EIC during catalysis are still poorly understood.
We have presented a protocol for the successful expression and purification of recombinant EIC from E. coli. NMR structural characterization shows that in solution EIC adopts the same tertiary fold and dimeric structure as that observed in the various crystal structures of EI (15, 16, 26) and EIC (27, 28). NMR 15N relaxation dispersion data also reveal the existence of conformational exchange on the submillisecond time scale in the region of the PEP binding and at the β3α3 turn. The relaxation dispersion data together with the available crystal structures of EI and EIC suggest that the β3α3 turn in free EIC exists in a dynamic conformational equilibrium between open (major) and closed (minor) states that is shifted toward the closed state upon PEP binding. Conformational selection of the closed state by PEP does not perturb the quaternary structure and relative subunit orientation in the dimer but stabilizes the dimer interface, thereby explaining the lower dimerization KD for EIC in the presence of PEP (14).
We have also shown that the EIC domain, both isolated and in the context of the full-length protein, is able to hydrolyze PEP into pyruvate and inorganic phosphate, further supporting the hypothesis that EIC is not merely a scaffold for PEP binding and a dimerization domain but actually plays an active role in the catalytic function of EI (12). Although this enzymatic activity was not reported in previous investigations on the isolated EIC domain from E. coli (14), our finding is not too surprising since the isolated EIC domain from T. tengcongensis was observed to catalyze a similar reaction at 65 °C (28). Our data also indicate that EI is capable of hydrolyzing PEP even when phosphorylated at His189. However, the PEP degradation rate is ∼6 orders of magnitude slower than the autophosphorylation reaction of EI (21), suggesting that this additional processing of PEP is negligible in the context of the full PTS.
We expect that the stable and active EIC domain expressed and purified here will serve as an excellent model system for biochemical and structural investigations on the complex interplay between substrate binding and conformational dynamics that regulates EI and, more generally, the activity of many enzymes (53).
Acknowledgments
We thank Drs. Nicolas Fawzi, Nicolas Anthis, Yuki Takayama, Sara Pistolesi, Alexander Maltsev, and Nils Lakomek for helpful discussions.
This work was supported by the Intramural Program of the National Institutes of Health, NIDDK, and the Intramural AIDS Targeted Antiviral Program of the Office of the Director of the National Institutes of Health (to G. M. C.).
- EI
- enzyme I (residues 1–575)
- EIN
- N-terminal domain of EI (residues 1–249)
- EIC
- C-terminal domain of EI (residues 261–575)
- PTS
- phosphoenolpyruvate:sugar phosphotransferase system
- PEP
- phosphoenolpyruvate
- HPr
- histidine phosphocarrier protein
- TROSY
- transverse relaxation optimized spectroscopy
- RDC
- residual dipolar coupling
- SVD
- singular value decomposition
- CPMG
- Carr-Purcel-Meinboom-Gill
- 1DNH
- one-bond backbone amide RDC
- MESG
- 2-amino-6-mercapto-7-methylpurine riboside.
REFERENCES
- 1. Meadow N. D., Fox D. K., Roseman S. (1990) The bacterial phosphoenolpyruvate: Glycose phosphotransferase system. Annu. Rev. Biochem. 59, 497–542 [DOI] [PubMed] [Google Scholar]
- 2. Deutscher J., Francke C., Postma P. W. (2006) How phosphotransferase system-related protein phosphorylation regulates carbohydrate metabolism in bacteria. Microbiol. Mol. Biol. Rev. 70, 939–1031 [DOI] [PMC free article] [PubMed] [Google Scholar]
- 3. Weigel N., Waygood E. B., Kukuruzinska M. A., Nakazawa A., Roseman S. (1982) Sugar transport by the bacterial phosphotransferase system. Isolation and characterization of enzyme I from Salmonella typhimurium. J. Biol. Chem. 257, 14461–14469 [PubMed] [Google Scholar]
- 4. Weigel N., Kukuruzinska M. A., Nakazawa A., Waygood E. B., Roseman S. (1982) Sugar transport by the bacterial phosphotransferase system. Phosphoryl transfer reactions catalyzed by enzyme I of Salmonella typhimurium. J. Biol. Chem. 257, 14477–14491 [PubMed] [Google Scholar]
- 5. Doucette C. D., Schwab D. J., Wingreen N. S., Rabinowitz J. D. (2011) α-Ketoglutarate coordinates carbon and nitrogen utilization via enzyme I inhibition. Nature Chem. Biol. 7, 894–901 [DOI] [PMC free article] [PubMed] [Google Scholar]
- 6. Mukhija S., Erni B. (1997) Phage display selection of peptides against enzyme I of the phosphoenolpyruvate-sugar phosphotransferase system (PTS). Mol. Microbiol. 25, 1159–1166 [DOI] [PubMed] [Google Scholar]
- 7. Chauvin F., Brand L., Roseman S. (1994) Sugar transport by the bacterial phosphotransferase system. Characterization of the Escherichia coli enzyme I monomer/dimer transition kinetics by fluorescence anisotropy. J. Biol. Chem. 269, 20270–20274 [PubMed] [Google Scholar]
- 8. Chauvin F., Fomenkov A., Johnson C. R., Roseman S. (1996) The N-terminal domain of Escherichia coli enzyme I of the phosphoenolpyruvate/glycose phosphotransferase system: Molecular cloning and characterization. Proc. Natl. Acad. Sci. U.S.A. 93, 7028–7031 [DOI] [PMC free article] [PubMed] [Google Scholar]
- 9. Chauvin F., Brand L., Roseman S. (1996) Enzyme I: The first protein and potential regulator of the bacterial phosphoenolpyruvate:glycose phosphotransferase system. Res. Microbiol. 147, 471–479 [DOI] [PubMed] [Google Scholar]
- 10. Liao D. I., Silverton E., Seok Y. J., Lee B. R., Peterkofsky A., Davies D. R. (1996) The first step in sugar transport: Crystal structure of the amino terminal domain of enzyme I of the Escherichia coli PEP:sugar phosphotransferase system and a model of the phosphotransfer complex with HPr. Structure 4, 861–872 [DOI] [PubMed] [Google Scholar]
- 11. Garrett D. S., Seok Y. J., Liao D. I., Peterkofsky A., Gronenborn A. M., Clore G. M. (1997) Solution structure of the 30-kDa N-terminal domain of enzyme I of the Escherichia coli phosphoenolpyruvate:sugar phosphotransferase system by multidimensional NMR. Biochemistry 36, 2517–2530 [DOI] [PubMed] [Google Scholar]
- 12. Seok Y. J., Lee B. R., Zhu P. P., Peterkofsky A. (1996) Importance of the carboxyl-terminal domain of enzyme I of the Escherichia coli phosphoenolpyruvate:sugar phosphotransferase system for phosphoryl donor specificity. Proc. Natl. Acad. Sci. U.S.A. 93, 347–351 [DOI] [PMC free article] [PubMed] [Google Scholar]
- 13. Seok Y. J., Zhu P. P., Koo B. M., Peterkofsky A. (1998) Autophosphorylation of enzyme I of the Escherichia coli phosphoenolpyruvate:sugar phosphotransferase system requires dimerization. Biochem. Biophys. Res. Commun. 250, 381–384 [DOI] [PubMed] [Google Scholar]
- 14. Patel H. V., Vyas K. A., Mattoo R. L., Southworth M., Perler F. B., Comb D., Roseman S. (2006) Properties of the C-terminal domain of enzyme I of the Escherichia coli phosphotransferase system. J. Biol. Chem. 281, 17579–17587 [DOI] [PubMed] [Google Scholar]
- 15. Teplyakov A., Lim K., Zhu P. P., Kapadia G., Chen C. C., Schwartz J., Howard A., Reddy P. T., Peterkofsky A., Herzberg O. (2006) Structure of phosphorylated enzyme I, the phosphoenolpyruvate:sugar phosphotransferase system sugar translocation signal protein. Proc. Natl. Acad. Sci. U.S.A. 103, 16218–16223 [DOI] [PMC free article] [PubMed] [Google Scholar]
- 16. Oberholzer A. E., Schneider P., Siebold C., Baumann U., Erni B. (2009) Crystal structure of enzyme I of the phosphoenolpyruvate sugar phosphotransferase system in the dephosphorylated state. J. Biol. Chem. 284, 33169–33176 [DOI] [PMC free article] [PubMed] [Google Scholar]
- 17. Schwieters C. D., Suh J. Y., Grishaev A., Ghirlando R., Takayama Y., Clore G. M. (2010) Solution structure of the 128 kDa enzyme I dimer from Escherichia coli and its 146-kDa complex with HPr using residual dipolar couplings and small- and wide-angle X-ray scattering. J. Am. Chem. Soc. 132, 13026–13045 [DOI] [PMC free article] [PubMed] [Google Scholar]
- 18. Takayama Y., Schwieters C. D., Grishaev A., Ghirlando R., Clore G. M. (2011) Combined use of residual dipolar couplings and solution x-ray scattering to rapidly probe rigid-body conformational transitions in a non-phosphorylatable active-site mutant of the 128-kDa enzyme I dimer. J. Am. Chem. Soc. 133, 424–427 [DOI] [PMC free article] [PubMed] [Google Scholar]
- 19. Waygood E. B., Meadow N. D., Roseman S. (1979) Modified assay procedures for the phosphotransferase system in enteric bacteria. Anal. Biochem. 95, 293–304 [DOI] [PubMed] [Google Scholar]
- 20. Saier M. H., Jr., Schmidt M. R., Lin P. (1980) Phosphoryl exchange reaction catalyzed by enzyme I of the bacterial phosphoenolpyruvate:sugar phosphotransferase system. Kinetic characterization. J. Biol. Chem. 255, 8579–8584 [PubMed] [Google Scholar]
- 21. Meadow N. D., Mattoo R. L., Savtchenko R. S., Roseman S. (2005) Transient state kinetics of enzyme I of the phosphoenolpyruvate:glycose phosphotransferase system of Escherichia coli: equilibrium and second-order rate constants for the phosphotransfer reactions with phosphoenolpyruvate and HPr. Biochemistry 44, 12790–12796 [DOI] [PubMed] [Google Scholar]
- 22. Patel H. V., Vyas K. A., Savtchenko R., Roseman S. (2006) The monomer/dimer transition of enzyme I of the Escherichia coli phosphotransferase system. J. Biol. Chem. 281, 17570–17578 [DOI] [PubMed] [Google Scholar]
- 23. Rohwer J. M., Meadow N. D., Roseman S., Westerhoff H. V., Postma P. W. (2000) Understanding glucose transport by the bacterial phosphoenolpyruvate:glycose phosphotransferase system on the basis of kinetic measurements in vitro. J. Biol. Chem. 275, 34909–34921 [DOI] [PubMed] [Google Scholar]
- 24. Suh J. Y., Cai M., Clore G. M. (2008) Impact of phosphorylation on structure and thermodynamics of the interaction between the N-terminal domain of enzyme I and the histidine phosphocarrier protein of the bacterial phosphotransferase system. J. Biol. Chem. 283, 18980–18989 [DOI] [PMC free article] [PubMed] [Google Scholar]
- 25. Garrett D. S., Seok Y. J., Peterkofsky A., Gronenborn A. M., Clore G. M. (1999) Solution structure of the 40,000 Mr phosphoryl transfer complex between the N-terminal domain of enzyme I and HPr. Nature Struct. Biol. 6, 166–173 [DOI] [PubMed] [Google Scholar]
- 26. Márquez J., Reinelt S., Koch B., Engelmann R., Hengstenberg W., Scheffzek K. (2006) Structure of the full-length enzyme I of the phosphoenolpyruvate-dependent sugar phosphotransferase system. J. Biol. Chem. 281, 32508–32515 [DOI] [PubMed] [Google Scholar]
- 27. Oberholzer A. E., Bumann M., Schneider P., Bächler C., Siebold C., Baumann U., Erni B. (2005) Crystal structure of the phosphoenolpyruvate-binding enzyme I domain from the Thermoanaerobacter tengcongensis PEP:sugar phosphotransferase system (PTS). J. Mol. Biol. 346, 521–532 [DOI] [PubMed] [Google Scholar]
- 28. Navdaeva V., Zurbriggen A., Waltersperger S., Schneider P., Oberholzer A. E., Bähler P., Bächler C., Grieder A., Baumann U., Erni B. (2011) Phosphoenolpyruvate:sugar phosphotransferase system from the hyperthermophilic Thermoanaerobacter tengcongensis. Biochemistry 50, 1184–1193 [DOI] [PubMed] [Google Scholar]
- 29. LiCalsi C., Crocenzi T. S., Freire E., Roseman S. (1991) Sugar transport by the bacterial phosphotransferase system. Structural and thermodynamic domains of enzyme I of Salmonella typhimurium. J. Biol. Chem. 266, 19519–19527 [PubMed] [Google Scholar]
- 30. Palmer A. G., 3rd (2004) NMR characterization of the dynamics of biomacromolecules. Chem. Rev. 104, 3623–3640 [DOI] [PubMed] [Google Scholar]
- 31. Mittermaier A., Kay L. E. (2006) New tools provide new insights in NMR studies of protein dynamics. Science 312, 224–228 [DOI] [PubMed] [Google Scholar]
- 32. Delaglio F., Grzesiek S., Vuister G. W., Zhu G., Pfeifer J., Bax A. (1995) NMRPipe: A multidimensional spectral processing system based on UNIX pipes. J. Biomol. NMR 6, 277–293 [DOI] [PubMed] [Google Scholar]
- 33. Pervushin K., Riek R., Wider G., Wüthrich K. (1997) Attenuated T2 relaxation by mutual cancellation of dipole-dipole coupling and chemical shift anisotropy indicates an avenue to NMR structures of very large biological macromolecules in solution. Proc. Natl. Acad. Sci. U.S.A. 94, 12366–12371 [DOI] [PMC free article] [PubMed] [Google Scholar]
- 34. Tugarinov V., Muhandiram R., Ayed A., Kay L. E. (2002) Four-dimensional NMR spectroscopy of a 723-residue protein: Chemical shift assignments and secondary structure of malate synthase g. J. Am. Chem. Soc. 124, 10025–10035 [DOI] [PubMed] [Google Scholar]
- 35. Clore G. M., Gronenborn A. M. (1998) Determining the structures of large proteins and protein complexes by NMR. Trends Biotechnol. 16, 22–34 [DOI] [PubMed] [Google Scholar]
- 36. Ulrich E. L., Akutsu H., Doreleijers J. F., Harano Y., Ioannidis Y. E., Lin J., Livny M., Mading S., Maziuk D., Miller Z., Nakatani E., Schulte C. F., Tolmie D. E., Kent Wenger R., Yao H., Markley J. (2008) BioMagResBank. Nucleic Acids Res. 36, D402-D408 [DOI] [PMC free article] [PubMed] [Google Scholar]
- 37. Mulder F. A., Schipper D., Bott R., Boelens R. (1999) Altered flexibility in the substrate-binding site of related native and engineered high-alkaline Bacillus subtilisins. J. Mol. Biol. 292, 111–123 [DOI] [PubMed] [Google Scholar]
- 38. Bax A., Kontaxis G., Tjandra N. (2001) Dipolar couplings in macromolecular structure determination. Methods Enzymol. 339, 127–174 [DOI] [PubMed] [Google Scholar]
- 39. Clore G. M., Starich M. R., Gronenborn A. M. (1998) Measurement of residual dipolar couplings of macromolecules aligned in the nematic phase of a colloidal suspension of rod-shaped viruses. J. Am. Chem. Soc. 120, 10571–10572 [Google Scholar]
- 40. Hansen M. R., Mueller L., Pardi A. (1998) Tunable alignment of macromolecules by filamentous phage yields dipolar coupling interactions. Nature Struct. Biol. 5, 1065–1074 [DOI] [PubMed] [Google Scholar]
- 41. Fitzkee N. C., Bax A. (2011) Facile measurement of 1H-15N residual dipolar couplings in larger perdeuterated proteins. J. Biomol. NMR 48, 65–70 [DOI] [PMC free article] [PubMed] [Google Scholar]
- 42. Schwieters C. D., Kuszewski J., Clore G. M. (2006) Using Xplor–NIH for NMR molecular structure determination. Progr. NMR Spectroscopy 48, 47–62 [Google Scholar]
- 43. Loria J. P., Rance M., Palmer A. G., 3rd (1999) A TROSY CPMG sequence for characterizing chemical exchange in large proteins. J. Biomol. NMR 15, 151–155 [DOI] [PubMed] [Google Scholar]
- 44. Yip G. N., Zuiderweg E. R. (2004) A phase cycle scheme that significantly suppresses offset-dependent artifacts in the R2-CPMG 15N relaxation experiment. J. Magn. Reson. 171, 25–36 [DOI] [PubMed] [Google Scholar]
- 45. Mulder F. A., Skrynnikov N. R., Hon B., Dahlquist F. W., Kay L. E. (2001) Measurement of slow (micros-ms) time scale dynamics in protein side chains by 15N relaxation dispersion NMR spectroscopy: Application to Asn and Gln residues in a cavity mutant of T4 lysozyme. J. Am. Chem. Soc. 123, 967–975 [DOI] [PubMed] [Google Scholar]
- 46. Davis D. G., Perlman M. E., London R. E. (1994) Direct measurements of the dissociation-rate constant for inhibitor-enzyme complexes via the T1ρ and T2 (CPMG) methods. J. Magn. Reson. Ser. B 104, 266–275 [DOI] [PubMed] [Google Scholar]
- 47. Millet O., Loria J. P., Kroenke C. D., Pons M., Palmer A. G., III (2000) The static magnetic field dependence of chemical exchange line broadening defines the NMR chemical shift time scale. J. Am. Chem. Soc. 122, 2867–2877 [Google Scholar]
- 48. Venditti V., Fawzi N. L., Clore G. M. (2012) An efficient protocol for incorporation of an unnatural amino acid in perdeuterated recombinant proteins using glucose-based media. J. Biomol. NMR 52, 191–195 [DOI] [PMC free article] [PubMed] [Google Scholar]
- 49. Shen Y., Delaglio F., Cornilescu G., Bax A. (2009) TALOS+: A hybrid method for predicting protein backbone torsion angles from NMR chemical shifts. J. Biomol. NMR 44, 213–223 [DOI] [PMC free article] [PubMed] [Google Scholar]
- 50. Prestegard J. H., al-Hashimi H. M., Tolman J. R. (2000) NMR structures of biomolecules using field oriented media and residual dipolar couplings. Q. Rev. Biophys. 33, 371–424 [DOI] [PubMed] [Google Scholar]
- 51. Clore G. M. (2000) Accurate and rapid docking of protein-protein complexes on the basis of intermolecular nuclear overhauser enhancement data and dipolar couplings by rigid body minimization. Proc. Natl. Acad. Sci. U.S.A. 97, 9021–9025 [DOI] [PMC free article] [PubMed] [Google Scholar]
- 52. Clore G. M., Garrett D. S. (1999) R-factor, free R, and complete cross-validation for dipolar coupling refinement of NMR structures. J. Am. Chem. Soc. 121, 9008–9012 [Google Scholar]
- 53. Ma B., Nussinov R. (2010) Enzyme dynamics point to stepwise conformational selection in catalysis. Curr. Opin. Chem. Biol. 14, 652–659 [DOI] [PMC free article] [PubMed] [Google Scholar]