

Abstract
Objectives/Hypothesis
One limitation with cochlear implants is the difficulty stimulating spatially discrete spiral ganglion cell groups because of electrode interactions. Multipolar electrodes have improved on this some, but also at the cost of much higher device power consumption. Recently, it has been shown that spatially selective stimulation of the auditory nerve is possible with a mid-infrared laser aimed at the spiral ganglion via the round window. However, these neurons must be driven at adequate rates for optical radiation to be useful in cochlear implants. We herein use single-fiber recordings to characterize the responses of auditory neurons to optical radiation.
Study Design
In vivo study using normal-hearing adult gerbils.
Methods
Two diode lasers were used for stimulation of the auditory nerve. They operated between 1.844 μm and 1.873 μm, with pulse durations of 35 μs to 1,000 μs, and at repetition rates up to 1,000 pulses per second (pps). The laser outputs were coupled to a 200-μm-diameter optical fiber placed against the round window membrane and oriented toward the spiral ganglion. The auditory nerve was exposed through a craniotomy, and recordings were taken from single fibers during acoustic and laser stimulation.
Results
Action potentials occurred 2.5 ms to 4.0 ms after the laser pulse. The latency jitter was up to 3 ms. Maximum rates of discharge averaged 97 ± 52.5 action potentials per second. The neurons did not strictly respond to the laser at stimulation rates over 100 pps.
Conclusions
Auditory neurons can be stimulated by a laser beam passing through the round window membrane and driven at rates sufficient for useful auditory information. Optical stimulation and electrical stimulation have different characteristics; which could be selectively exploited in future cochlear implants.
Level of Evidence
Not applicable.
Keywords: Cochlear implant, neuroprosthesis, optical stimulation, spatial selectivity, spiral ganglion cell
INTRODUCTION
Neural prosthetic devices restore or supplement nervous system function lost during disease or injury. Cochlear implants exemplify this, and bypass damaged cochlear hair cells by direct electrical stimulation of the auditory nerve. One goal of cochlear implant technology is to stimulate discrete spiral ganglion cell groups in a way similar to the encoding of small acoustic frequency bands in a normal-hearing ear.1,2 However, the electrical current spreads widely along the scala tympani and across cochlear turns with monopolar stimulation. Multipolar stimulation improves this, but does not fully mitigate issues with electrode interactions,2–4 and is at the cost of much higher device power consumption. This makes spatially discrete electrical stimulation difficult, but it has recently been shown using c-FOS immunohistochemical staining that spatially selective auditory stimulation is possible using mid-infrared laser pulses.5
In previous reports, cochlear compound action potentials (CAPs) were recorded during stimulation with a mid-infrared laser.6–9 These experiments were designed to determine the parameters for safe, sustained stimulation, but CAPs measure the combined responses of multiple neurons within the auditory nerve. It is important to understand how laser stimulation affects individual neurons because although laser stimulation is possible, it is not known if it can transfer information with sufficient temporal resolution for hearing. Single auditory neurons have maximum sustained depolarization rates of 300 to 400 pulses per second (pps),10 so an ideal optical cochlear implant would drive the auditory neurons to these rates, or at least to those characteristic of normal hearing situations. Those rates are sufficient as cochlear implant users are able to understand running speech with electrical stimulation rates of 150 Hz to 500 Hz.11 As it stands, most contemporary cochlear implants use stimulation rates of greater than 1,000 Hz per electrode, partly to convey some temporal characteristics of speech, but also to desynchronize the neural discharge with respect to the electrical pulses. Fewer than half of high-rate stimulating pulses actually generate action potentials. It follows that laser stimulation would be of further benefit (in addition to better spatial resolution) if it induced a less synchronized response than electrical stimulation. For these reasons, the purpose of the present study is to use single-fiber experiments to observe the responses of individual auditory neurons to optical radiation.
MATERIALS AND METHODS
All measurements were made in vivo using adult Mongolian gerbils (Meriones unguiculatus). Care and use of the animals for this study were in accordance with the NIH Guide for the Care and Use of Laboratory Animals, and the Animal Care and Use Committee at Northwestern University approved the protocol.
Animal Surgery and Preparation
The animals were anesthetized with an intraperitoneal injection of sodium pentobarbital of 80 mg/kg body weight. Maintenance doses of 17 mg/kg were given whenever the animal showed increasing arousal, which was assessed every 15 minutes by the paw withdrawal reflex. A tracheotomy was made and secured by inserting PE90 tubing. The core body temperature was maintained at 38°C using a heating pad and a rectal thermometer. After a C-shaped skin incision was made, the soft tissue surrounding the posterior skull was retracted to expose the tympanic bulla. The skull was attached with dental acrylic to a heated head holder for stabilization. An opening was made into the bulla, and this exposed the round window for optical fiber placement. Through the same opening, a perilabyrinthine craniotomy was made with a pick in order to access the auditory nerve for single-fiber recordings.
In preparation for acoustic stimulation, the external auditory canal was transected, and plastic tubing was affixed with dental acrylic to the bony portion. The animal and the surgical platform were placed on a vibration-isolation table in a soundproof booth. A silver wire was hooked on the rim of the round window niche for CAP recording.
Sound System
Acoustic stimuli were presented to monitor cochlear function and to “search” for single auditory fibers. Voltage commands for the acoustic stimuli were generated by custom-written software and a PC I/O computer board (KPCI-3110, Keithley, Cleveland, OH). The signal was presented to a programmable attenuator (8310 Series, Aeroflex/Weinshel, Plainview, NY), and subsequently to a mixer (SM5, Tucker Davis Technologies, Alachua, FL). The acoustic signal was generated by an earphone (DT 770 PRO, Beyerdynamic, Heilbronn, Germany), which was coupled to the ear canal tubing.
Optical Stimulation
Two similar diode lasers were used for optical stimulation. The first was the Aculight ONS Version Alpha (Lockheed Martin Aculight, Bothell, WA), which was replaced with the newer Aculight Renoir, once it was available. Each laser operated at 1.844 μm to 1.873 μm by varying the temperature of the diode. Pulse durations were 30 μs to 1,000 μs, with repetition rates of 1 pps to 13 pps for the ONS Version Alpha, and 1 pps to 1,000 pps for the Renoir (we acquired the Renoir as soon as it was available in order to study higher pulse repetition rates). The laser was coupled to a low-OH 200-μm-diameter optical fiber (FIP series, Polymicro, Phoenix, AZ). The distal bare end of the fiber was mounted to a 3D micromanipulator (3MWH, Narishige, Tokyo, Japan) and placed at the rim of the round window niche, approximately 0.5 mm from the spiral ganglion cells in the basal turn. The optical fiber did not penetrate the round window membrane and was not in direct contact with any part of the cochlea, the animal, or surrounding fluids. The fiber was heated to 36°C with a coil made of heating wire (NI60, Omega, Stamford, CT) to prevent cochlear electrophysiology changes from cooling. Radiant exposures measured at the fiber tip were 10 to 100 mJ/cm2. Both lasers were kept outside of the soundproof booth.
Data Acquisition
Compound Action Potential Curves
CAPs were measured using the round window membrane electrode to establish that the animal had normal hearing. Thresholds are defined as sound levels required for a 20 μV N1/P1 amplitude (A1) between the first minimum (N1) and the first maximum (P1) of the CAP at a given stimulus frequency. They were determined by comparing a threshold criterion (A2 = 20 ± 2 μV) with the peak-to-peak voltage (A1) in a 6-ms time window that began with the onset of the tone burst and contained the CAP. The initial sound level was approximately 95 dB sound pressure level (SPL) at each stimulus frequency, and then decreased to the equation 20*log(A2/A1). The threshold was assigned upon meeting the 20 μV criteria. The acoustic stimuli were 12 ms tone bursts including 1-ms rise and fall times. The responses to 32 consecutive opposite phase tone bursts were averaged to reduce the contribution of cochlear microphonics. Noise was reduced by programmable bandpass filters; the high-pass was set to 300 Hz and the low-pass to 3,000 Hz. The highest frequency was 50 kHz.
If possible, input-output profiles were constructed. For increasing sound levels, the corresponding CAP amplitudes were measured at selected stimulus frequencies. It typically took 15 minutes to determine CAP thresholds for a frequency range of five octaves, at a resolution of six steps per octave.
Single Fiber
To “search” for auditory fibers, acoustic stimuli were 100-ms noise bursts with 1-ms rise and fall times, delivered through the aforementioned speaker and ear coupling tube. Neural activity was recorded using micro-pipettes pulled from 1.5-mm borosilicate glass. Each one had a tip diameter of < 1 μm, was filled with 3 M KCl, and had an impedance larger than 30 MΩ at 1 kHz. The pipettes were mounted to a micromanipulator for precise three-dimensional positioning. The pipette tip was placed through the craniotomy and advanced using an inchworm motor (6000 ULN, Burleigh Instruments, Fishers, NY) until contact was made with an auditory neuron. It was initially advanced in 10-μm steps, but the step size was reduced to 2 μm after identifying and recording from the first auditory neuron. The spontaneous rate of action potentials per second (AP/s) was measured for 10 seconds as soon as stable contact was made with a neuron. Next, the rate of AP/s was determined for different sound levels and frequencies. From these results, we plotted an iso-rate tuning curve, which showed a minimum at the characteristic frequency (CF) of the neuron.
The cochlea was stimulated with square-shaped laser pulses once the characteristic frequency of the auditory nerve fiber was known. As a control, the laser fiber was briefly disconnected from the source at the beginning of each recording. The absence of evoked action potentials helped assure that any subsequent activity was not due to sound or electrical artifact. Neural activity was recorded for different laser radiant exposures, pulse durations, and stimulus repetition rates. Radiation energy was varied from 0 μJ to 125 μJ, and pulse durations were 30, 100, 250, 500, 750, 1,000, 1,500, and 2000 μs. Next, the repetition rate was varied from 5 pps to 1,000 pps while stimulating at a constant energy of 20.7 μJ at a pulse width of 100 μs. Prior to advancing to the next neuron, an additional auditory tuning curve was obtained to verify that the micropipette was still recording from the single fiber, and that no acute damage occurred with the laser stimulation. Data acquisition for each neuron required 2 to 4 hours, limiting the number of recordings possible with each animal.
Data Analysis
Analog recordings were analyzed offline with custom-written software using IGOR Pro® (WaveMetrics, Portland, OR). Each recorded trace was visually inspected to assure that the signal-to-noise ratio was >6 dB. In other words, the amplitude of the action potentials was at least twice the noise level. The timing of the action potentials—called time-prints—were measured and used for subsequent calculations.
Interspike time histograms (interspike interval histograms) were plotted from the times between successive action potentials (Fig. 1A is an example). The histograms were plotted to be 400 bins to 450 bins (0.1 ms width per bin), or 40 ms to 45 ms. They were used to calculate the entrainment index, which describes the ability of a stimulus to evoke a response. The entrainment index is calculated by counting all spikes that occur at an interval equal to the time between successive stimuli (1/stimulation rate), and dividing this number by the number of spikes in the entire interval histogram.
Fig. 1.

(A) An interspike interval histogram and the calculated entrainment index. (B) Entrainment indices for increasing laser pulse repetition rates. The entrainment index decreased quickly for stimulation rates above 100 Hz. (C) There was a small but insignificant increase in the entrainment index with increasing radiation power.
Peri-stimulus histograms (PSTHs)—also called post-stimulus histograms—were plotted using the times between each stimulus and the action potentials that follow (Fig. 2 is an example). The bin width was 0.1 ms. From the PSTHs, we calculated the mean latency (delay time), the latency jitter (for the first spike after the stimulus), and the firing efficiency (FE). The mean latency is the arithmetic mean of all recorded latencies in the time track, and the latency jitter is defined as the standard deviation of these latencies. The FE is another way to describe the ability of an optical pulse to evoke an action potential.12 It is calculated with the equation
Fig. 2.

Post-stimulus histograms at different stimulation rates. The laser settings were 100 μs pulse duration, 1,860 nm wavelength, and 1,102 μJ radiant energy. With stimulation at 200 Hz (A), the action potentials generally occur at 1/stimulation rate intervals, but this was no longer the case for faster stimulation rates (B–F).
in which NAPS denotes the number of action potentials per second; SR the spontaneous activity; (T1 – T0) the latency window; and StimRate the stimulation rate.
The synchronicity of the action potentials is an important aspect of the neural response, and this can be further analyzed by the vector strength. The vector strength is measured by the phase relation between the stimulus and the neural response and was introduced as a means to describe responses to sinusoidal signals. Here, we adopt the approach and define the time between two discrete laser pulses as the stimulus cycle time. Each time between the laser pulse and the action potential is then assigned a “phase relation,” a vector of unit length with a phase angle α. Hereby, one full stimulus cycle corresponds to 360°. Alpha is then calculated by the time at which the action potential occurs after the pulse,
where tAP denotes the time between the laser pulse and the action potential, and tcycle the time between two laser pulses. The components of the vector are then calculated as follows: x = cos(α) and y = sin(α). The n vectors defining the sequence of evoked action potentials are treated as a distribution on a unit cycle, and the average vector can be calculated. The average phase relation between the laser pulse and the occurrence of the action potential is:
where k equals zero or one, depending of the signs of Σyi or Σxi. The average length of the vector has been calculated and graphed and provides the degree of synchronization:
Descriptive statistics were used. Averages and standard deviations were calculated as well.
RESULTS
Acoustic Stimulation
Recordings were made from 403 neurons. The CFs were between 118 Hz and 22 kHz, with most CFs falling between 1 kHz and 10 kHz (Fig. 3A). The contact time between the neuron and the micro-pipette was often limited such that only acoustic recordings could be made. There were 154 single auditory neuron recordings during laser stimulation. Of these, 67 showed laser-evoked responses and had a range of CFs between 450 Hz and 20 kHz (Fig. 3B). Eighty-seven neurons never responded to the laser, and their CFs were between 148 Hz and 10 kHz (Fig. 3C). Most low-frequency neurons (< 1 kHz) did not respond to the laser. The optical fiber was sometimes reoriented during the recording, and neurons that did not initially respond to the laser occasionally did so afterwards. This manipulation, however, often broke the tip of the micro-pipette or its contact with the neuron, ending the recording before any laser-evoked responses could be identified.
Fig. 3.

(A) The characteristic frequencies (CFs) of all recorded neurons. (B) CFs of neurons that responded to the laser pulses, with a range of 450 Hz to 20 kHz. (C) Neurons that did not respond to the laser, with a range of 148 Hz to 10 kHz.
The normal neural response properties to acoustic stimuli were examined and showed a large variation. Many neurons had spontaneous activities close to zero (Fig. 4A). On average, the maximum acoustically driven rate was 158 ± 82 action potentials per second (AP/s, Fig. 4B). However, there were neurons with driven rates below 100 AP/s, and others with driven rates up to 600 AP/s. In the population of fibers selected, the thresholds did not correlate with the CF (Fig. 4C). The sharpness of tuning (Q10dB) of the single neurons increased with increasing CF (Fig. 4D), or frequency selectivity is better at high frequencies. Again, the results showed a large variability.
Fig. 4.

(A) The spontaneous activities of the neurons recorded. The results appear biased toward low spontaneous rates. (B) The maximum acoustically driven rate, which was 100 Hz to 200 Hz for many neurons. (C) The threshold for acoustic stimulation. There was a large variation. (D) Sharpness of tuning, which increased with the CF of the neuron.
Optical Stimulation
Thresholds
Energy-to-rate profiles were plotted as in Fig. 5. The stimulation rates were 13 pps. The number of evoked action potentials increased with the optical energy. The threshold was about 10 μJ for optical pulses longer than 100 μs. The shorter pulses had the lowest thresholds, while the maximum evoked depolarization rate was the same for all pulse durations and had a plateau of ≈ 0.8 times the stimulation rate.
Fig. 5.

Energy to rate profiles at a 13-pps stimulation rate. Two examples are shown. Short pulses required less radiation energy to evoke action potentials than those of longer duration. The maximum response rate did not reach the stimulation rate.
Maximum Rate
The discrepancy between the stimulation rate and the number of evoked action potentials increased at stimulation rates above 100 pps. The neurons usually could not follow the stimulus (Fig. 6). If the evoked responses increased with the stimulation rate, then the individual traces seen in Fig. 6 would follow the dotted line. The laser-evoked response rates were clearly slower than with acoustic stimulation and were close to 400 AP/s for only two neurons. The average maximally sustained driven rate with optical stimulation rate was 97 ± 52.5 AP/s.
Fig. 6.
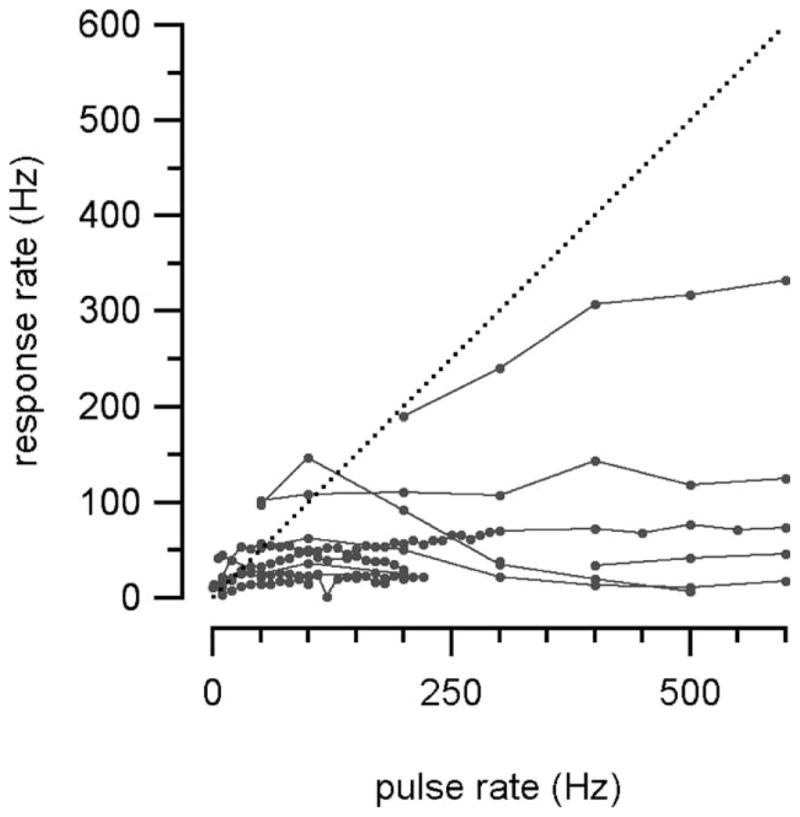
The rate of action potentials increased with the optical stimulation rate. The relationship held to about 50 Hz, but one 300-Hz exception is shown.
Interspike Time Histograms (INTHs)
Interspike time histograms (interspike interval histograms) were plotted and used to calculate the entrainment index (Fig. 1A). The histograms were inspected to determine the number of maxima present. If each and every action potential occurs directly after the laser pulse, then there will only be one maximum. The appearance of several maxima separated by 1/stimulation rate indicates that not every laser pulse evokes an action potential. Inspection of the histograms shows that for stimulus repetition rates below the maximum possible response rate of the neuron, most of the action potentials occur directly after the optical pulse. In contrast, action potentials were not evoked by every pulse at higher stimulation rates. The ability of laser pulses to evoke action potentials was quantified with the entrainment index. It was calculated at different stimulus levels for many neurons at 200 pps and 300 pps. For the selected neurons (Fig. 1B), the entrainment index was about 0.5 for stimulus repetition rates up to 50 pps. The index decreased with increasing stimulus repetition rates and was below 0.2 for stimulus rates >200 pps. Increasing the radiant energy revealed a small but insignificant increase in the entrainment index (Fig. 1C).
Post-stimulus Time Histograms (PSTHs)
Histograms were constructed for different laser stimulation rates. At a 200-pps stimulation rate, the majority of the action potentials occurred in the first time interval between pulses, but this became more random at higher stimulation rates (Fig. 2). Neurons then were unable to exactly follow the stimulus. To further quantify the responses, the PSTHs were used to calculate the latency (delay time), latency jitter, firing efficiency, and vector strength.
The average latency is illustrated in Fig. 7A, and is the average time between the stimulus and the first action potential. The latency depended on the stimulation rate, and was about 4 ms if the stimulation rate was below 50 pps. The longest latency was about 8 ms at around 80 pps stimulation (Fig. 7A). The dotted line in Fig. 7A represents half of the time between successive stimuli. If the action potentials occur randomly, then the average latency will also be half of the time between successive stimuli, which was the case for stimulus rates above 100 pps. The stimulation time intervals at the highest stimulation rates were shorter than the recovery times of the neurons. The greatest jitter (the standard deviation of the latencies) was approximately 3 ms and corresponded to the longest latencies (Fig. 7B).
Fig. 7.

The average latencies (delay times) for action potentials with sustained laser pulses. (A) The dotted line represents half of the stimulation time interval. Random action potentials follow this line, as they do for stimulation rates >100 Hz here. (B) The jitter (standard deviation of the latencies) corresponds to the latencies.
Firing Efficiency
Firing efficiency (FE) is another way (in addition to the entrainment index) to describe the ability of a stimulus to generate an action potential. It was as high as 100% for some neurons at stimulation rates less than 100 pps, but decreased drastically at higher rates (Fig. 8A). The FE was plotted versus the radiant power in Fig. 8B, but there was too much data variation to see any trends. Neurons stimulated at different rates were combined for Fig. 8B, which probably confounded the results.
Fig. 8.

(A) Firing efficiencies at different stimulation rates, which decreased quickly above 100 Hz. (B) Firing efficiencies for increasing radiation powers. The data variation was too large to see any trend.
Vector Strength
If the time between two subsequent optical pulses is considered the time for one stimulus cycle, the time of occurrence for n action potentials can be quantified by the vector strength (VS). It is calculated as described in Materials and Methods. The VS is about 1 for frequencies <50 Hz (Fig. 9A), but decreases drastically for stimulus frequencies >100 pps. There were no clear trends between VS and radiant power (Fig. 9B), but neurons stimulated at different rates were combined for this figure. As was the case with firing efficiency, this method added variability to the data.
Fig. 9.

Vector strength versus stimulation rate and radiant power. (A) The vector strength decreased drastically with increasing stimulation rates. (B) The data variation was too large to see any trend with radiant power changes.
DISCUSSION
Optical Stimulation
There have been efforts to stimulate neurons with visible light as early as 1891.13 Later experiments showed that neural excitation or inhibition is triggered by a range of visible light and infrared irradiation.14 There has been a somewhat erratic progression of optical neural stimulation research since, but this laboratory was the first to optically stimulate the auditory nerve. Our previous CAP experiments were designed to show feasibility, and to determine the parameters for safe, sustained stimulation.6–9 Because the CAP is from multiple neurons, we are limited in what we can deduce about the response characteristics of individual neurons, which is why we used single-fiber recordings for the present study.
The word “optical” is used differently throughout the sciences, so some clarification is necessary to avoid confusion. The Oxford English Dictionary defines “optical” (with supporting etymology from scientific literature) as follows: “Of or relating to light, as the medium of sight, or in relation to its physical properties; of or relating to optics. Also in extended use: of or relating to radiation in the immediately adjacent parts of the electromagnetic spectrum, i.e. the infrared and ultraviolet.”15
The usage in this article agrees with the “extended use” in this definition. It is also consistent with the biomedical engineering literature, where nonvisible wavelengths of light (such as from the mid-infrared laser we used) are termed optical. The laser stimulation references in this article are all good examples of this use. Reference textbooks on optical-tissue interactions such as Optical-Thermal Response of Laser-Irradiated Tissue16 and Tissue Optics: Light Scattering Methods and Instruments for Medical Diagnosis17 also use optical in this manner. In fact, only a minority of the text in these books is devoted to visible light.
The likely mechanism of laser stimulation is a small, transient increase in tissue temperature via energy absorption by water.9,18,19 A photochemical mechanism is unlikely because there is no single wavelength or narrow wavelength band at which nerve stimulation is enhanced, and because infrared photons at 1,860 nm are not energetic enough (0.67 eV) to cause a photochemical reaction.7 At present, it is not known how a transient temperature rise induces neural depolarization, but it is not just a function of the total radiant energy. For example, Fig. 5 shows that short laser pulses require less radiant energy to evoke action potentials than the longer ones do. A similar relationship was found in corresponding CAP experiments.7 Potential mechanisms for laser-induced neural depolarization include thermal activation of an ion channel (i.e., TRPV), thermally induced biophysical membrane changes, pore formation, or an expansion of the membrane that leads to ion flux. Experiments on these mechanisms are underway, but we are not aware of a primary candidate.
It is imperative to know the thermal effects of the laser because tissue damage is unacceptable. Although the radiant energy was measured at the tip of the optical fiber, it differs from what is actually delivered to the target tissue, which depends on target distance, the beam’s orientation, the radiation wavelength, and the properties of the tissue. The instantaneous temperature rise within the cochlea at time t = 0 after a single laser pulse has been estimated as follows:
where μa is the wavelength-dependent absorption coefficient of the material, which would be 31.1 cm−1 at 1.844 μm; H(z) is the radiant exposure at depth, z, into the tissue; ρ is the density, which is 1,030 kg/m3 for most soft tissues; and c is the specific heat of the tissue with a value of 4.1855 J/kgK.20 At 1.844 μm and a radiant energy of 125 μJ, the temperature rise is 0.29 K at the tip of the optical fiber. This, of course, is an oversimplification because it does not include the effects of multiple pulses, thermal relaxation times, and variability in the conduction and convection properties (i.e., blood flow) throughout the cochlea. Measurements are currently being conducted to better understand these variables.
With the present laser parameters, neural damage was not likely. It was possible to stimulate at 400 pps for two hours, with stable thresholds and amplitudes;8 the CAP is a very sensitive marker for the physiologic state of the cochlea.21 Moreover, some recordings from the neurons in the present experiments were stable enough that the auditory tuning curves could be repeated after the laser recordings. This involved about two hours of intermittent laser pulses for each neuron. Meanwhile, cats have been successfully implanted with a prototype laser device (at our institution) to establish the safety of long-term optical stimulation.
Electrical Stimulation
The properties of electrical stimulation of the cochlea warrant review for comparison to auditory and optical stimulation. The discussion will be limited to the context of encoding auditory information for clarity. Of note, electrical stimulation of the gerbil cochlea was not examined in the present experiments. Furthermore, normal-hearing animals were used, while many studies are on deafened animals. For these reasons, comparisons between optical and electrical stimulation should be with caution.
Moxon characterized single-fiber responses of the auditory nerve to current pulses and sinusoids.22–24 This was followed by contributions from van den Honert and Stypulkowski,12,25 Hartmann and colleagues,26 Javel,27 Parkins,28 Dynes and Delgutte,29 Shepherd and Javel,30,31 and Abbas, Miller, and colleagues,10,32–37 among others. This work collectively shows the following for single auditory neurons after electrical stimulus pulses: a short latency of electrically evoked responses at 300 μs to 500 μs, a narrow dynamic range of < 6 dB, and highly synchronized responses at all suprathreshold intensities (across fiber synchrony). Near the electrical stimulation threshold, action potentials occur after a long latency of 500 μs to 800 μs, and with considerable latency variability. As the stimulus intensity is increased, the response latency decreases to 300 μs to 500 μs, with high synchrony to the stimulus (high firing efficiency with little variation in the response latency).12
One interpretation for the change in response latency with increasing stimulus intensities is that action potentials can be initiated at different sites on the spiral ganglion cells.31 When the stimulus is applied directly to the intracranial auditory nerve (axons), the response pattern consists solely of a short-latency, high-synchrony peak. This resembles the response from high-intensity stimulation through the cochlea. It is thought that the site of stimulation sequentially shifts in steps from the unmyelinated portion of the dendrite toward the axon with increasing stimulus intensities.12
Electrical stimulation of a damaged cochlea is different from that of a healthy cochlea. Shepherd and Javel compared electrical responses from normal hearing and deafened cats.38 Neurons degenerated from long-term deafness could still generate and propagate synchronized action potentials. They had a reduced mean response latency that correlated with the amount of dendrite degeneration. Fibers from acutely deafened animals had reduced thresholds compared with normals, while they were elevated in the long-term deafened animals. The acutely or chronically damaged neurons had lower spontaneous activities, as shown by others previously.39 There also was evidence of a reduced ability of single neurons from damaged cochleae to maintain 100% entrainment to current pulse trains at high (> 400 pps) stimulus rates.38 In comparison, given sufficient stimulus intensity, auditory nerve fibers from normal cochlea are capable of 100% entrainment to biphasic current pulses for stimulus rates up to 800 pps.27,38 This may at least partially explain the inability of cochlear implant patients to perceive changes in pitch for rates above 300 pps to 400 pps.38
Further work by Miller et al. showed that neurons from acutely deafened cochlea have a lower electrical threshold and a smaller dynamic range than do those from normal cochlea.36 They thought that this was due to the greater proportion of fibers with high spontaneous rates in normal cochlea, which exist in a partially refractory state, as well as from membrane alterations (i.e., capacitance) due to peripheral dendrite loss. Single fibers from normal cochleae had faster adaptation to pulse trains. There also was less temporal jitter with damaged cochleae, which was previously observed by others.12,26,28,38,40
Electrical stimulation of a healthy cochlea evokes different responses than those evoked by acoustic stimuli. As already mentioned, there is a much narrower dynamic range with electrical stimulation than with acoustic stimulation, but the electrical current also may alter native sound encoding. Although different sound frequencies are represented throughout the cochlea (spectral frequency encoding), there is also evidence of temporal frequency encoding. This is evident in cochlear implant patients where perceived pitch (for stimulation rates below 500 Hz) is a strong function of rate as well as place.41 Rose et al. showed that some auditory neurons can fire with the period of a sound stimulus up to 1.4 kHz, and then are phase-locked at lower multiples of the period up to 5 kHz.42 Although no single neuron is able to fire over about 800 times a second,27 a group of neurons can phase-lock to a 5-kHz stimulus yet not be synchronized with each other. Cumulatively, action potentials are produced in sync with each sound cycle of the stimulus. This ensemble of neurons can accurately encode the frequency. When considering that each neuron may have different characteristics, this in part explains the extended dynamic range of the auditory nerve beyond that of single auditory neurons.43 However, electrical stimulation produces an abnormal amount of synchronization where all neurons in a group are phase-locked to the stimulus and synchronized with each other. Therefore, temporal information is missing with stimulation frequencies higher than the maximum firing rate of the stimulated neurons.
It is reasonable to expect the best representation of sounds to be with the technology that best reproduces the manner in which healthy auditory neurons depolarize with sound stimuli. One such attempt is through desynchronization of adjacent neurons with high-rate electrical stimulation. Another way is by using high-rate (5,000 Hz), sub-threshold electrical conditioning pulses.44 Javel and Shepherd31 showed in long-term deafened cats that increasing the stimulus rate to 800 Hz to 1,000 Hz produced small increases in temporal dispersion and proportionate increases in asymptotic discharge rate and dynamic range. Responses to high-rate stimuli also exhibited discrete latency increases when discharge rates exceeded 300 AP/s to 400 AP/s (perhaps a chronic refractory state).31,34 With the exception of high CF neurons, the increases in temporal dispersion at higher stimulation rates are still not adequate to match the dispersion observed with acoustic stimulation. Thus, it may not be possible to re-create acoustic-like temporal properties by electrical stimulation with sinusoids or pulses with elementary wave shapes. In addition, these high rates of stimulation create another unnatural situation: discharge rates of over 300 AP/s that exceed normal acoustic-elicited responses.31 The effects of high-rate electrical stimulation are not entirely clear, although they are commonly employed in contemporary cochlear-implant processing strategies and have a positive effect for some users.44–47
Optical Response Characteristics
The optical experiments were conducted on animals with normal hearing in order to identify the auditory CF of each neuron. We do not believe that the primary response we are recording is phonic (photomechanical), because the latencies for action potentials evoked by optical radiation are longer than those evoked by acoustic stimuli. The laser CAP recordings also lack a cochlear microphonic.9 Furthermore, we have shown that the auditory nerve can be stimulated with laser pulses in animals acutely deafened with neomycin, and the CAP thresholds were not significantly different between the hearing and deafened animals.6 Subsequent CAP measurements in acute and chronically deaf animals (with histologic confirmation of hair cell loss) also show that mid-infrared laser stimulation does not require hair cells to evoke a neural response.48 Single-fiber experiments in deafened animals are in progress to further confirm the findings from hearing animals.
Temporal Properties
Results obtained with optical stimulation differ from those for acoustic stimulation, or as others have shown for electrical stimulation. For acoustic stimuli, the absolute refractory period (time for which no action potential can be evoked) is slightly less than a millisecond, and it is even shorter for electrical stimulation at about 0.3 ms.12 If the maximum depolarization rate that can be evoked by electrical stimulation is calculated from this 0.3-ms absolute refractory period, then it is conceivable for auditory neurons to follow a 3-kHz electrical stimulus (instantaneous rate). This is markedly different than with laser stimulation, where a similar calculation using the shortest latency we measured (2.5 ms) reveals a maximum possible instantaneous response rate of around 400 Hz. In comparison, our average maximally sustained driven rate with optical stimulation was 97 ± 52.5 AP/s, while our average maximum acoustically driven rate was 158 ± 82 AP/s. Keep in mind that the maximum sustained electrically driven rate is also lower than the maximum instantaneous rate, at about 500 AP/s,27 and is similar to reported maximum sustained acoustically driven rates.21 Although our average maximally sustained optically driven rates are slower than with electrical or acoustic stimulation, they are more characteristic of the rates seen with typical auditory stimulation. Therefore, optically stimulated rates near this level should be adequate to convey auditory information well enough for speech recognition. Notably, 150-Hz to 400-Hz stimulation rates are already used effectively with some cochlear implant processing strategies,11,45,46 but the slower stimulation rates that may be used with optical stimulation would require processing strategy modifications.
It is known that increasing the latency jitter (temporal dispersion) of auditory neuron depolarizations can improve speech perception.33,49 This effect is at least in part related to increased stochastic resonance (a counterintuitive phenomenon in which adding noise to a nonlinear system improves the fidelity of the signals conveyed by that system).33,49 This is one reason behind cochlear implant strategies intended to desynchronize electrically evoked responses. The latency jitter was 2 ms for optical stimulation rates in the 130-pps to 300-pps range (Fig. 7B), which is enormous when compared with the 20-μs to 40-μs latency jitter reported with electrical stimulation (in undeafened animals).30 This high temporal dispersion of neuron depolarizations at relatively low stimulation rates may be advantageous for optical cochlear implant strategies.
Spatial Selectivity and the Irradiated Area
Van den Honert and Stypulkowski estimated spatial selectivity for different electrode configurations using single-fiber mapping of spatial excitation patterns from single animals. They showed that monopolar electrodes excited fibers throughout the cochlea without spatial selectivity. Selective stimulation was possible with bipolar electrodes,25 as has been shown by others using various configurations.50 Similar to their experiments, we have used our data to determine the selectivity of stimulation with optical radiation; however, the number of neurons recorded from a single gerbil was too small to generate a plot like theirs. Here, the results from many animals were combined to estimate the area of the cochlea that can be accessed via the round window (for optical stimulation) by plotting the CFs of the neurons that were stimulated (Fig. 3). This method is limited in assessing the absolute spatial selectivity of the optical stimulus because the optical fiber position and orientation is not identical in each animal. Comparing Figs. 3B and 3C, one sees that low-frequency neurons of less than 1 kHz were predominantly in the nonresponse group. Meanwhile, the broad range of neurons that responded to the laser (450 Hz to 20 kHz CF) corresponds to the basal and lower middle turns of the gerbil cochlea and is more than one would expect if the beam only irradiated a straight path along the basal turn of the cochlea. We speculate that the mid-infrared radiation penetrates the round window membrane, perilymph, and limited cochlear bone, where it is able to stimulate the modiolar axons supplying the middle turn.
The frequency range of the neurons is likely biased. When recording from single fibers, we mostly found CFs around 2 kHz rather than those of higher frequencies. We have no explanation for this phenomenon but can trace it throughout the literature. “High-frequency” neurons were recorded less frequently than “mid-frequency” ones in nearly all the single-fiber papers referenced in this discussion. In addition, there was a bias for us to record neurons with low spontaneous activities (Fig. 4A), mostly because their stimulus and non-stimulus characteristics were easy to separate. Neurons with higher spontaneous rates may have different laser-evoked response rates than the group we studied.
Although our findings regarding the spatial selectivity of optical stimulation are limited in these experiments, we previously showed with c-FOS immunohistochemical staining in gerbils and guinea pigs that it is better with optical stimulation than with monopolar electrical stimulation.5 The entire cochlea was stimulated with a monopolar electrode configuration. In contrast, the laser stimulated a distinct neuron population within the basal and middle turns. Moreover, we have performed tone-on-light masking experiments, as well as inferior colliculus recordings to further compare the spatial selectivities of optical and electrical stimulation.
Future Directions
We believe that the differences between optical and electrical stimulation could be selectively exploited for the next generation of cochlear implants. In these experiments, the laser beam passed through an intact round window membrane, yet we were able to stimulate as far as the middle turn of the cochlea. This provides an opportunity to design a device that is less invasive than electrode arrays. A device that stimulates at least the basal turn of the cochlea without any type of cochleostomy, but that has more spatial selectivity than any type of extra-cochlear electrode. In addition, such spatial selectivity would be optimal here because the high frequencies represented in the basal turn rely on spatial (spectral) encoding of information more so than temporal encoding. This cochlear stimulator—not implant—could use multiple beams, or one scanning beam, and would be ideal for typical patterns of presbycusis and noise-induced hearing loss. The response to traditional hearing amplification should not change since the round window membrane, and cochlea would not be altered. Meanwhile, the large latency jitter seen with optical stimulation may prevent oversynchronization. Of course, many more steps are required between technological conception and maturity. These include proving that similar optical stimulation is possible in humans, establishing technological feasibility, and engineering a device that improves on what already exists.
CONCLUSIONS
In a normal-hearing gerbil model, auditory neurons can be noninvasively stimulated with a laser aimed through the round window membrane, and with neural discharge rates that should be adequate to convey useful auditory information. Auditory neurons respond to laser stimulation differently than to electrical stimulation. This is a promising development for cochlear implantation/stimulation technology.
Acknowledgments
This project has been funded in whole or in part with federal funds from the National Institute on Deafness and Other Communication Disorders, National Institutes of Health, Department of Health and Human Services, under Contract No. HHSN260-2006-00006-C/NIH No. N01-DC-6-0006, by NIH Grants R41 DC008515-01 and F31 DC008246-01, and the Capita Foundation.
C.-P.R. and A.I.M. have patents using laser stimulation technology and are partially funded by Lockheed Martin Aculight.
Footnotes
The views expressed in this presentation are those of the authors and do not reflect the official policy of the Department of Army, Department of Defense, or U.S. Government.
All experiments were performed at Northwestern University.
This work is a Triological Society Candidate Thesis and won the Edmund Prince Fowler Award.
BIBLIOGRAPHY
- 1.Shannon RV. Multichannel electrical stimulation of the auditory nerve in man. I. Basic psychophysics. Hear Res. 1983;11:157–189. doi: 10.1016/0378-5955(83)90077-1. [DOI] [PubMed] [Google Scholar]
- 2.Shannon RV. Multichannel electrical stimulation of the auditory nerve in man. II. Channel interaction. Hear Res. 1983;12:1–16. doi: 10.1016/0378-5955(83)90115-6. [DOI] [PubMed] [Google Scholar]
- 3.Bierer JA, Middlebrooks JC. Cortical responses to cochlear implant stimulation: channel interactions. J Assoc Res Otolaryngol. 2004;5:32–48. doi: 10.1007/s10162-003-3057-7. [DOI] [PMC free article] [PubMed] [Google Scholar]
- 4.Snyder RL, Middlebrooks JC, Bonham BH. Cochlear implant electrode configuration effects on activation threshold and tonotopic selectivity. Hear Res. 2008;235:23–38. doi: 10.1016/j.heares.2007.09.013. [DOI] [PMC free article] [PubMed] [Google Scholar]
- 5.Izzo AD, Su HS, Pathria J, Walsh JT, Jr, Whitlon DS, Richter C-P. Selectivity of neural stimulation in the auditory system: a comparison of optic and electric stimuli. J Biomed Opt. 2007;12:1–7. doi: 10.1117/1.2714296. [DOI] [PubMed] [Google Scholar]
- 6.Richter CP, Bayon R, Izzo AD, et al. Optical stimulation of auditory neurons: effects of acute and chronic deafening. Hear Res. 2008;242:42–51. doi: 10.1016/j.heares.2008.01.011. [DOI] [PMC free article] [PubMed] [Google Scholar]
- 7.Izzo AD, Walsh JT, Jr, Ralph H, et al. Laser stimulation of auditory neurons: effect of shorter pulse duration and penetration depth. Biophys J. 2008;94:3159–3166. doi: 10.1529/biophysj.107.117150. [DOI] [PMC free article] [PubMed] [Google Scholar]
- 8.Izzo AD, Walsh JT, Jr, Jansen ED, et al. Optical parameter variability in laser nerve stimulation: a study of pulse duration, repetition rate, and wavelength. IEEE Trans Biomed Eng. 2007;54(Pt 1):1108–1114. doi: 10.1109/TBME.2007.892925. [DOI] [PMC free article] [PubMed] [Google Scholar]
- 9.Izzo AD, Richter CP, Jansen ED, Walsh JT., Jr Laser stimulation of the auditory nerve. Lasers Surg Med. 2006;38:745–753. doi: 10.1002/lsm.20358. [DOI] [PubMed] [Google Scholar]
- 10.Fu QJ, Shannon RV. Effect of stimulation rate on phoneme recognition by nucleus-22 cochlear implant listeners. J Acoust Soc Am. 2000;107:589–597. doi: 10.1121/1.428325. [DOI] [PubMed] [Google Scholar]
- 11.Sachs MB, Abbas PJ. Rate versus level functions for auditory-nerve fibers in cats: tone-burst stimuli. J Acoust Soc Am. 1974;56:1835–1847. doi: 10.1121/1.1903521. [DOI] [PubMed] [Google Scholar]
- 12.van den Honert C, Stypulkowski PH. Physiological properties of the electrically stimulated auditory nerve. II. Single fiber recordings. Hear Res. 1984;14:225–243. doi: 10.1016/0378-5955(84)90052-2. [DOI] [PubMed] [Google Scholar]
- 13.Arsonval AD. La fibre musculaire est directement excitable par la lumiere. CR Soc Biol. 1891;43:318–320. [Google Scholar]
- 14.Arvanitaki A, Chalazonitis N. Excitatory and inhibitory processes initiated by light and infra-red radiations in single identifiable nerve cells. In: Florey E, editor. Nervous Inhibition. New York: Pergamon Press; 1961. [Google Scholar]
- 15.OED Online “Optical, a”. Oxford University Press; May 24, 2010. Available at: http://dictionary.oed.com. [Google Scholar]
- 16.Welch AJ, van Gemert M, editors. Optical-Thermal Response of Laser-Irradiated Tissue. 2. New York: Springer-Verlag; 2010. [Google Scholar]
- 17.Tuchin VV. Tissue Optics: Light Scattering Methods and Instruments for Medical Diagnosis. 2. Bellingham, WA: SPIE Press; 2007. [Google Scholar]
- 18.Wells J, Kao C, Mariappan K, et al. Optical stimulation of neural tissue in vivo. Optics Lett. 2005;30:504–506. doi: 10.1364/ol.30.000504. [DOI] [PubMed] [Google Scholar]
- 19.Wells J, Kao C, Konrad P, Mahadevan-Jansen A, Jansen ED. Biophysical mechanisms responsible for pulsed low-level laser excitation of neural tissue. Proc SPIE. 2006:6084. [Google Scholar]
- 20.Duck FA. Physical Properties of Tissue. London: Academic Press; 1990. [Google Scholar]
- 21.Ohlemiller KK, Echteler SM. Functional correlates of characteristic frequency in single cochlear nerve fibers of the Mongolian gerbil. J Comp Physiol A. 1990;167:329–338. doi: 10.1007/BF00192568. [DOI] [PubMed] [Google Scholar]
- 22.Moxon EC. Electrical Stimulation of the Cat’s Cochlea: A Study of Discharge Rates in Single Auditory Nerve Fibers [Master] Cambridge, MA: MIT; 1965. [Google Scholar]
- 23.Moxin EC. Neural and Mechanical Responses to Electric Stimulation of the Cat’s Inner Ear. Cambridge, MA: MIT; 1971. [Google Scholar]
- 24.Kiang NY, Moxon EC. Physiological considerations in artificial stimulation of the inner ear. Ann Otol Rhinol Laryngol. 1972;81:714–730. doi: 10.1177/000348947208100513. [DOI] [PubMed] [Google Scholar]
- 25.van den Honert C, Stypulkowski PH. Single fiber mapping of spatial excitation patterns in the electrically stimulated auditory nerve. Hear Res. 1987;29:195–206. doi: 10.1016/0378-5955(87)90167-5. [DOI] [PubMed] [Google Scholar]
- 26.Hartmann R, Topp G, Klinke R. Discharge patterns of cat primary auditory fibers with electrical stimulation of the cochlea. Hear Res. 1984;13:47–62. doi: 10.1016/0378-5955(84)90094-7. [DOI] [PubMed] [Google Scholar]
- 27.Javel E, Tong YC, Shepherd RK, Clark GM. Responses of cat auditory nerve fibers to biphasic electrical current pulses. Ann Otol Rhinol Laryngol. 1987;96(Suppl 128):26–30. [Google Scholar]
- 28.Parkins CW. Temporal response patterns of auditory nerve fibers to electrical stimulation in deafened squirrel monkeys. Hear Res. 1989;41:137–168. doi: 10.1016/0378-5955(89)90007-5. [DOI] [PubMed] [Google Scholar]
- 29.Dynes SB, Delgutte B. Phase-locking of auditory-nerve discharges to sinusoidal electric stimulation of the cochlea. Hear Res. 1992;58:79–90. doi: 10.1016/0378-5955(92)90011-b. [DOI] [PubMed] [Google Scholar]
- 30.Shepherd RK, Javel E. Electrical stimulation of the auditory nerve: II. Effect of stimulus waveshape on single fibre response properties. Hear Res. 1999;130:171–188. doi: 10.1016/s0378-5955(99)00011-8. [DOI] [PubMed] [Google Scholar]
- 31.Javel E, Shepherd RK. Electrical stimulation of the auditory nerve. III. Response initiation sites and temporal fine structure. Hear Res. 2000;140:45–76. doi: 10.1016/s0378-5955(99)00186-0. [DOI] [PubMed] [Google Scholar]
- 32.Miller CA, Abbas PJ, Robinson BK, Rubinstein JT, Matsuoka AJ. Electrically evoked single-fiber action potentials from cat: responses to monopolar, monophasic stimulation. Hear Res. 1999;130:197–218. doi: 10.1016/s0378-5955(99)00012-x. [DOI] [PubMed] [Google Scholar]
- 33.Matsuoka AJ, Rubinstein JT, Abbas PJ, Miller CA. The effects of interpulse interval on stochastic properties of electrical stimulation: models and measurements. IEEE Trans Biomed Eng. 2001;48:416–424. doi: 10.1109/10.915706. [DOI] [PubMed] [Google Scholar]
- 34.Miller CA, Abbas PJ, Robinson BK. Response properties of the refractory auditory nerve fiber. J Assoc Res Otolaryngol. 2001;2:216–232. doi: 10.1007/s101620010083. [DOI] [PMC free article] [PubMed] [Google Scholar]
- 35.Runge-Samuelson CL, Abbas PJ, Rubinstein JT, Miller CA, Robinson BK. Response of the auditory nerve to sinusoidal electrical stimulation: effects of high-rate pulse trains. Hear Res. 2004;194:1–13. doi: 10.1016/j.heares.2004.03.020. [DOI] [PubMed] [Google Scholar]
- 36.Miller CA, Abbas PJ, Robinson BK, Nourski KV, Zhang F, Jeng FC. Electrical excitation of the acoustically sensitive auditory nerve: single-fiber responses to electric pulse trains. J Assoc Res Otolaryngol. 2006;7:195–210. doi: 10.1007/s10162-006-0036-9. [DOI] [PMC free article] [PubMed] [Google Scholar]
- 37.Miller CA, Hu N, Zhang F, Robinson BK, Abbas PJ. Changes across time in the temporal responses of auditory nerve fibers stimulated by electric pulse trains. J Assoc Res Otolaryngol. 2008;9:122–137. doi: 10.1007/s10162-007-0108-5. [DOI] [PMC free article] [PubMed] [Google Scholar]
- 38.Shepherd RK, Javel E. Electrical stimulation of the auditory nerve. I. Correlation of physiological responses with cochlear status. Hear Res. 1997;108:112–144. doi: 10.1016/s0378-5955(97)00046-4. [DOI] [PubMed] [Google Scholar]
- 39.Liberman MC, Kiang NY. Acoustic trauma in cats. Cochlear pathology and auditory-nerve activity. Acta Otolaryngol. 1978;358(Suppl):1–63. [PubMed] [Google Scholar]
- 40.Parkins CW, Colombo J. Auditory-nerve single-neuron thresholds to electrical stimulation from scala tympani electrodes. Hear Res. 1987;31:267–285. doi: 10.1016/0378-5955(87)90196-1. [DOI] [PubMed] [Google Scholar]
- 41.Fearn R, Wolfe J. Relative importance of rate and place: experiments using pitch scaling techniques with cochlear implants recipients. Ann Otol Rhinol Laryngol. 2000;185(Suppl):51–53. doi: 10.1177/0003489400109s1221. [DOI] [PubMed] [Google Scholar]
- 42.Rose JE, Brugge JF, Anderson DJ, Hind JE. Phase-locked response to low-frequency tones in single auditory nerve fibers of the squirrel monkey. J Neurophysiol. 1967;30:769–793. doi: 10.1152/jn.1967.30.4.769. [DOI] [PubMed] [Google Scholar]
- 43.Clark G, Tong YC, Patrick J. Introduction. In: Clark G, editor. Cochlear Implants: Fundamentals and Applications. New York: Springer-Verlag; 2003. pp. 1–14. [Google Scholar]
- 44.Runge-Samuelson CL. Effects of high-rate pulse trains on electrode discrimination in cochlear implant users. Trends Amplif. 2009;13:76–86. doi: 10.1177/1084713809336739. [DOI] [PMC free article] [PubMed] [Google Scholar]
- 45.Vandali AE, Whitford LA, Plant KL, Clark GM. Speech perception as a function of electrical stimulation rate: using the Nucleus 24 cochlear implant system. Ear Hear. 2000;21:608–624. doi: 10.1097/00003446-200012000-00008. [DOI] [PubMed] [Google Scholar]
- 46.Verschuur CA. Effect of stimulation rate on speech perception in adult users of the Med-El CIS speech processing strategy. Int J Audiol. 2005;44:58–63. doi: 10.1080/14992020400022488. [DOI] [PubMed] [Google Scholar]
- 47.Di Lella F, Bacciu A, Pasanisi E, Vincenti V, Guida M, Bacciu S. Main peak interleaved sampling (MPIS) strategy: effect of stimulation rate variations on speech perception in adult cochlear implant recipients using the Digisonic SP cochlear implant. Acta Otolaryngol. 2010;130:102–107. doi: 10.3109/00016480902896113. [DOI] [PubMed] [Google Scholar]
- 48.Richter C-P, Bayon R, Izzo AD, et al. Optical stimulation of auditory neurons: effects of acute and chronic deafening. Hear Res. 2008;242:42–51. doi: 10.1016/j.heares.2008.01.011. [DOI] [PMC free article] [PubMed] [Google Scholar]
- 49.Rubinstein JT, Hong R. Signal coding in cochlear implants: exploiting stochastic effects of electrical stimulation. Ann Otol Rhinol Laryngol. 2003;191(Suppl):14–19. doi: 10.1177/00034894031120s904. [DOI] [PubMed] [Google Scholar]
- 50.Kral A, Hartmann R, Mortazavi D, Klinke R. Spatial resolution of cochlear implants: the electrical field and excitation of auditory afferents. Hear Res. 1998;121:11–28. doi: 10.1016/s0378-5955(98)00061-6. [DOI] [PubMed] [Google Scholar]