

INTRODUCTION
With rapid advances in medical imaging, fetal diagnosis of human CHD is now technically feasible in the first trimester. Although the first human embryologic studies were recorded by Hippocrates in 300–400 BC, present day knowledge of normal human cardiac development in the first trimester is still limited. In 1886, two papers by Dr His described development of the heart based on dissections of young human embryos. Free hand wax models were made that illustrated the external developmental anatomy. These wax plate reconstruction methods were used by many other investigators until the early 1900s1. Subsequently serial histological sections of human embryos have been used to further investigate human cardiac development2–6. Based on analysis of histological sections and scaled reproductions of human embryos, Grant showed a large cushion in the developing heart at 6 6/7 weeks (CS 14) and separate AV valves at 9 1/7 weeks (CS 22)2. At the end of the 8th week (CS 8), separate aortic and pulmonary outflows were observed. Orts-Llorca used three dimensional reconstructions of transverse sections of human embryos to define development of the truncus arteriosus and described completion of septation of the truncus arteriosus in 14–16mm embryos, equivalent to EGA 8 weeks (CS18)5.
Given the complex tissue remodeling associated with cardiac chamber formation and inflow/outflow tract and valvular morphogenesis, the plane of sectioning often limited the information that can be gathered on developing structures in the embryonic heart. These technical limitations in conjunction with limited access to human embryo specimens have meant that much of our understanding of early cardiac development in the human embryo is largely extrapolated from studies in model organisms7–10. With possible species differences in developmental timing and variation in cardiovascular anatomy, characterization of normal cardiac development in human embryos is necessary for clinical evaluation and diagnosis of CHD in the first trimester. This will be increasingly important, as improvements in medical technology allow earlier access to first trimester human fetal cardiac imaging and in utero intervention.
Recent studies have shown the feasibility of using magnetic resonance imaging (MRI) to obtain information on human embryo tissue structure11, 12. MRI imaging data can be digitally resectioned for viewing of the specimen in any orientation, and three-dimensional (3D) renderings can be obtained with ease. Similarly, episcopic fluorescence image capture (EFIC), a novel histological imaging technique, provides registered two-dimensional (2D) image stacks that can be resectioned in arbitrary planes and also rapidly 3D rendered10. With EFIC imaging, tissue is embedded in paraffin and cut with a sledge microtome. Tissue autofluorescence at the block face is captured and used to generate registered serial 2D images of the specimen with image resolution better than MRI. Data obtained by MRI or EFIC imaging can be easily resectioned digitally or reconstructed in 3D to facilitate the analysis of complex morphological changes in the developing embryonic heart. In this manner, the developing heart in every embryo can be analyzed in it entirety with no loss of information due to the plane of sectioning.
Using MRI and EFIC imaging, we conducted a systematic analysis of human cardiovascular development in the first trimester. 2D image stacks and 3D volumes were generated from 52 human embryos from 6 4/7 to 9 3/7 weeks estimated gestational age (EGA), equivalent to Carnegie stages (CS) 13–23. These stages encompass the developmental window during which all of the major milestones of cardiac morphogenesis can be observed. Using the MRI and EFIC imaging data, we constructed a digital atlas of human heart development. Data from our atlas were used to generate charts summarizing the major milestones of normal human heart development through the first trimester. MRI and EFIC images obtained as part of this study can be viewed as part of an online Human Embryo Atlas. To view the Human Embryo Atlas content, visit http://apps.nhlbi.nih.gov/HumanAtlas/home/login.aspx?ReturnUrl=%2fhumanatlas%2fDefault.aspx.
Specimens
Embryos from the Kyoto collection, at the Congenital Anomaly Research Center at the Kyoto University in Japan, were collected after termination of pregnancies for socioeconomic reasons under the Maternity Protection Law of Japan. Embryos were derived from normal pregnancies without any clinical presentations. The specimens were in fixative for an estimated duration of 30 to over 40 years, making them unsuitable for immunohistochemistry or any molecular/cellular analysis. This collection represents a random sample of the total intrauterine population of Japan13–16. During accessioning into the Kyoto collection, the embryos were examined and staged according to the criteria of Carnegie Staging proposed by O'Rahilly17. For this study, 52 embryos from the Kyoto collection (see Table S1 in electronic supplement) were donated to the Carnegie collection of normal human embryos archived at the National Museum of Health and Medicine of the Armed Forces Institute of Pathology (http://nmhm.washingtondc.museum/collections/hdac/Carnegie_collection.htm). Each embryo’s age was determined using post conceptional ages previously reported14, which were then converted to estimated gestational age or menstrual age by adding 14 days, and reported in weeks.
Magnetic Resonance Imaging and Episcopic Fluorescence Image Capture
High resolution MRI and EFIC images were obtained from 52 human embryos from 6 4/7 to 9 3/7 weeks of gestation (CS 13–23). These specimens from the Kyoto collection were imaged by MRI and EFIC during preparation for accessioning into the Carnegie collection (Table S1 in online supplement). Human embryos in formalin were treated with 1:20 Magnevist (Berlex, Montville, NJ)/10% formalin solution for 3 or more days, then rinsed and prepared in 5–30 mm tubes, depending on embryo size, with fixative or low melting agar. Samples that diffused gadolinium into the media were further soaked in plain fixative two or more days and re-imaged. Imaging was performed at the NIH Mouse Imaging Facility on a 7.0T Bruker vertical bore MRI system with 150 G/cm gradients (Bruker, Billerica, MA) and 5 to 30 mm microimaging birdcage coils (Bruker, Billerica, MA). Some larger samples were also imaged on a 7.0T, 16mm horizontal bore Bruker Paravision system with 39G/cm gradients and a 38-mm birdcage coil. MRI was acquired with Paravision 3.0.2 operating systems. Samples were imaged using a 3D rapid gradient echo (SNAP) sequence with TR 30–40ms, TE 3.3–4.0ms, 20–90 averages, acquisition time approximately 12 to 50 hours, matrices 256×128×128 to 512×512×512 (see Table S2 in online supplement). Over the whole collection, MRI resolution ranged from 29×35×35 to 117×105×105 µm3. Resolution was proportionate to the sample size with the smallest embryos having the highest resolution data sets. Individual image data sets are three dimensional and near-isotropic, with all three voxel dimensions being within 10 microns of each other in an individual data set. Most data sets are in the range 35×35×35 to 60×60×60 µm3. The resolution of each data set is listed in Table S2 in the online supplement.
In preparation for EFIC, embryos stored in 10% phosphate buffered formalin were dehydrated and embedded in a mixture of paraffin wax (70.4%), Vybar (24.9%), stearic acid (4.4%) and red aniline dye Sudan IV (0.4%) using techniques previously described10, 18. The embedded embryos were then sectioned using a sliding microtome (Leica SM 2500) to obtain sections of 5–8 microns in thickness. The block face was sequentially photographed using epifluorescent illumination with a 100W mercury lamp and a Leica MZ16A stereomicroscope equipped with 425 nm/480 nm excitation/emission filters. Images were captured using an ORCA-ER digital camera (Hamamatsu).
Offline Image Processing and Data Analysis
MRI images originally recorded in DICOM were converted into TIFF format using ImageJ (http://rsb.info.nih.gov/ij/). The EFIC 2D image stacks were captured and exported as TIFF files. Both the EFIC and MRI data were processed using OpenLab (Improvision Inc). 3D reconstructions and quick time virtual reality (QTVR) movies were generated using Volocity (Improvision Inc). The 2D image stacks also were digitally resectioned using Volocity (Improvision Inc) to view internal and external cardiac structures in planes similar to standard echocardiographic imaging planes used clinically. In EFIC images, each pixel was a square with length dimensions ranging from 2.34 to13.4 microns/pixel edge. Thus, pixel dimensions ranged from 5.48 µm2 to 179.56 µm2. For each embryo, we generated serial 2D image stacks, and 3D reconstructions. From this analysis, we were able to delineate all of the major milestones of human heart development, including chamber formation, septation of the atria, ventricles, and truncus arteriosus, and valvular morphogenesis.
Cardiac Loop
The cardiac loop or looped heart tube is observed from EGA 6 4/7 to 7 5/7 weeks (CS13 to CS17). 3D reconstruction of the heart at 7 5/7 weeks (CS17) reveals internal structures of the cardiac loop (Fig.1). The only exit for blood from the left sided inflow limb, consisting of the atrial cavity, atrioventricular junction, and the presumptive left ventricle, is the interventricular foramen (also known as primary foramen, primary interventricular foramen, bulboventricular foramen or embryonic interventricular foramen) (double arrow in Fig.1); while the only exit for blood from the right sided outflow limb, consisting of the presumptive right ventricle is the truncus arteriosus (arrowhead in Fig.1). Also of note, the atrioventricular junction (AV in Fig.1) is surrounded by endocardial cushion tissue, which is contiguous with the truncus arteriosus.
Figure 1. 3D view of the cardiac loop in a GA 7 5/7 weeks (CS17) embryo.

2D EFIC image stacks were reconstructed in 3D to show the looped heart tube in a EGA 7 5/7 weeks (CS17) embryo. The double headed arrow indicates the interventricular foramen. The orifice of the developing atrioventricular junction is seen as a horizontal line above the label AV. The truncus arteriosus (arrowhead) is also seen. Endocardial cushion tissue surrounding the atrioventricular junction is adjacent to the truncus arteriosus.
RA: right atrium, LA: left atrium, RV: presumptive right ventricle, LV: presumptive left ventricle. Scale bar = 0.6 mm.
The developmental changes seen in the cardiac loop are shown in more detail in Figure 2, with images from embryos at 6 4/7 (CS13) (Fig.2A–E) and 7 5/7 weeks (CS17) (Fig.2F–I). As the looped heart tube matures, the atrial and ventricular chambers expand in size, giving rise to distinct subdivisions recognizable as the primitive left and right atria and presumptive left and right ventricles (Fig.2H). At 6 4/7 weeks (CS13), the endocardial cushions seen lining the atrioventricular junction appear thin with little apparent cellular content. As development progresses, they become filled with dense material (Fig.2B,E,G; Supplemental Movies 8a,b). The interventricular foramen also shows striking changes during this developmental period. It is a wide and open communication at 6 4/7 weeks (CS13) (asterisk in Fig.2C), but as the chambers grow, it becomes a narrow and more distinct opening (foramen), by 7 3/7 to 7 5/7 weeks (CS16–17) (asterisk in Fig.2H,3C). The superior atrioventricular cushion can be seen (Fig.2G). The inflow consisting of the venous confluence or primitive atrium (Fig.2A) is observed to communicate with the ventricular chamber via the atrioventricular junction (Fig.2B,E,G). The presumptive left ventricle communicates with the presumptive right ventricle via the interventricular foramen (asterisk in Fig. 2C,H). The outflow from the cardiac loop comprises the yet undivided truncus arteriosus (T in Fig. 2D,I) arising from the presumptive right ventricle.
Figure 2. Defining structures of the cardiac loop.
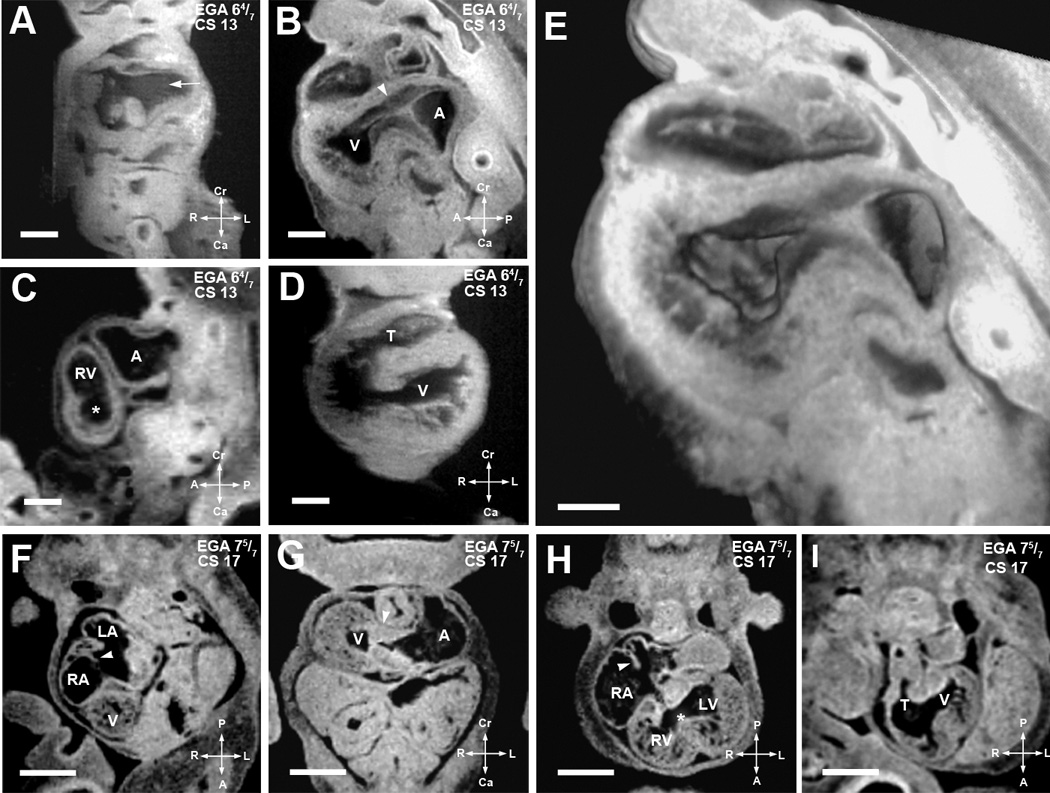
(A–E). EFIC and MRI images of EGA 6 4/7 weeks (CS13) embryos shown in various imaging planes. Imaging in the frontal plane (A) shows the common cardinal veins or the open venous confluence (arrow), while sagittal view (B) shows primitive endocardial cushions at the atrioventricular junction (arrowhead). A 3D model of the same embryo (E) shows the extent of the interventricular foramen as well as the contour of the endocardial cushions. MRI image of another embryo in the sagittal plane (C) shows the presumptive right ventricle (RV), atrial chamber (A), and a nondistinct interventricular foramen (*), while the ventricular chamber (V) and a single, undivided truncus arteriosus (T) can be seen in an frontal section of a third embryo (D).
Scale bars: (A–D)=0.4 mm, (E)=0.25 mm
(F–I). MRI images of EGA 7 5/7 weeks (CS17) embryo. Image from an oblique transverse plane (F) shows the right and left atrial (RA, LA) chambers as septation is progressing (arrowhead). The developing ventricle (V) is seen. Viewed in the transverse plane in (G), well formed dense endocardial cushion tissue is seen at the atrioventricular junction (arrowhead). Another section in the transverse plane in (H) shows the right and left ventricular cavities with a more distinct interventricular foramen (*). Septum primum can be seen as atrial septation progresses (arrowhead). The single undivided truncus arteriosus (T) and interventricular foramen communicating with the presumptive left ventricle (V) can be seen in an oblique transverse plane (I). Scale bar: (E–H) = 1.250 mm.
LV: presumptive left ventricular chamber, T: truncus arteriosus.
Figure 3. Major events of atrial and ventricular septation.
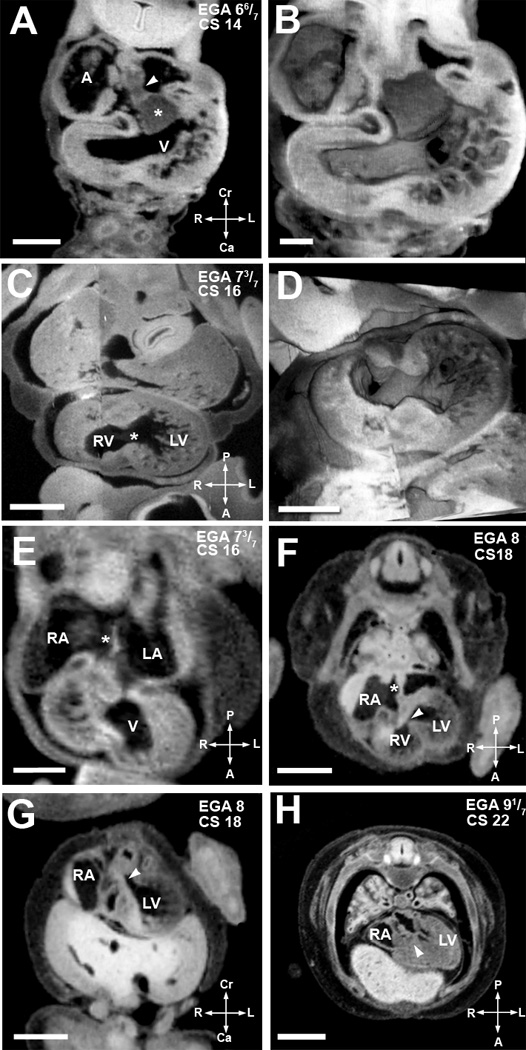
(A,B). EFIC image of EGA 6 6/7 weeks (CS14) embryo in the transverse plane (A) shows the atrial spine (arrowhead) attached to the inferior cushion (asterisks). 3D reconstruction (B) highlights the endocardial cushions and trabeculation in the ventricular chamber. Scale bar = 0.515 mm in (A), 0.272mm in (B).
(C,D). An EFIC image of EGA 7 3/7 weeks (CS16) embryo in the oblique plane (C) showing right and left ventricular chambers connected by an interventricular foramen (*). 3D reconstruction of the same embryo (D) delineates the contour of the interventricular foramen and the orifices of the atrioventricular canal and the truncus arteriosus. Scale bar = 0.5mm for (C), and 0.900mm for (D).
(E) MRI image of an embryo at EGA 7 3/7 weeks (CS16) also in the transverse plane. It shows the formation of septum primum (*) between the right and left atria (RA, LA). Scale bar = 0.5 mm.
(F,G) MRI image of an EGA 8 weeks (CS18) embryo in an oblique transverse plane (F) shows a complete atrial septum (*). The most caudal portion of the septum primum, the mesenchymal cap, has fused to the superior cushion. The growth of the muscular ventricular septum into the ventricular cavity is also shown. The crest of the muscular interventricular septum is present with an incomplete inlet ventricular septum (arrowhead) immediately above it. Panel G, another MRI image of the same embryo in an oblique coronal plane, shows the formed outlet ventricular septum (arrowhead). Together these two images show that outlet ventricular septation is completed before inlet ventricular septation. Scale bars in (F,G) = 1.5 mm.
(H). MRI image of embryo at EGA 9 1/7 weeks (CS22) in an oblique coronal plane shows a completed inlet ventricular septum (arrowhead). Scale bar = 2mm.
A: primitive atrium/venous confluence, RA: right atrium, LA: left atrium, V: ventricular chamber, LV: left ventricular chamber, RV: right ventricular chamber.
Atrial Septation (EGA 6 6/7–8 weeks)
The process of atrial septation is thought to begin with a thin septum primum growing from the posterior wall of the atrium, from a location cranial to the pulmonary vein orifice. It grows towards and eventually fuses with the endocardial cushions19. At 6 6/7 weeks gestation (CS 14), the mesenchymal cap of the primary atrial septum could be seen in contact with the superior atrioventricular cushion. The atrial spine, a mesenchymal structure, was also observed. The atrial spine fuses with the inferior atrioventricular cushion (6 6/7 weeks (CS 14)) (Fig.3A,B; Supplemental Movies 8a,b), and plays an important role in closure of the primary foramen. Although the pulmonary vein orifice was not seen by our imaging, it can be inferred from previous studies that it lies to the left of the atrial spine20. Septum primum can be observed at 6 6/7 weeks of gestation and its developmental progression through 7 5/7 weeks can be seen in Figures 2H, 3A,B, and E (Supplemental Movies 1,8a,8b). Later, septum secundum develops as an infolding of the dorsal wall of the right atrium, completing atrial septation with fenestrations forming the foramen ovale. Both atrial septum primum and secundum were present by 8 weeks (CS18) (Supplemental Movie 2). At this stage, the mesenchymal cap can be seen fused with the now divided superior atrioventricular cushion (Fig.3F). This is consistent with developmental timing suggested by others21, 22.
Ventricular Septation (EGA 7 3/7–9 1/7 weeks)
Towards the end of the looped heart tube stages of development (7 3/7 and 7 5/7 weeks, CS16,17), distinct separation of presumptive LV and RV chambers is evident. The beginning of the muscular interventricular septum can be seen at these stages, but ventricular septation is not yet complete (Fig.2H,3C,D; Supplemental Movies 9a,b). By 8 weeks (CS18), the muscular ventricular septum can be seen extending from the floor of the ventricular chamber towards the crux of the heart (Fig.3F). This leaves open a relatively large interventricular foramen which allows communication between the ventricles (Supplemental Movies 1, 2). Recent lineage tracing experiments in mice have suggested that the muscular interventricular septum is comprised of cells originating from the ventral aspect of the primitive ventricle, with closure of the ventricular foramen mediated by dorsal migration of this precursor cell population; these cells likely represent a subpopulation of cells derived from the secondary heart field23. Immunohistochemical analysis of human fetal cardiac tissue showed myocytes expressing G1N2 antigen localized in a ring around the junction between the future right and left ventricles24. In later developmental stages, G1N2 expressing cells are found in the area clinically termed the inlet ventricular septum, but not in the subaortic outflow septum.
At 8 weeks (CS 18), the ventricular septum at the level of the left ventricular outflow is closed (Fig.3G), but part of the inlet ventricular septum at the level of the atrioventricular valves remains open (arrowhead in Fig.3F; Supplemental Movies 3,4,6). The inlet and membranous portions of the ventricular septum are fully closed at 9 1/7 weeks (CS22), completing ventricular septation (Fig.3H; Supplemental Movie 5). The area clinically termed the inlet ventricular septum has been shown in prior studies to originate from the embryonic right ventricle25. In agreement with previous reports on human development, our data showed the final portion of the ventricular septum to close included what likely comprises a combination of the membranous and inlet ventricular septum. These findings suggest that an arrest in development of the ventricular septum could result in ventricular septal defects similar to those observed clinically.
Formation of the Atrioventricular Valves (EGA 7 3/7–8 weeks)
Atrioventricular valve morphogenesis begins at the looped heart tube stages, with large endocardial cushions prominently seen at the center of the cardiac loop (asterisks in Fig.3A,4A). The atrioventricular canal is divided by the endocardial cushions, which form on the posterior (dorsal) and anterior (ventral) walls of the atrioventricular canal. These cushions eventually divide the atrioventricular canal into right and left atrioventricular orifices2, 19. A well delineated atrioventricular junction can be seen at 7 3/7 weeks gestation (CS16) (Fig.4B,C;Supplemental Movies 10a,b). At 7 3/7 and 7 5/7 weeks (CS16 and CS17), the atrioventricular junction was still undivided. A few days later, by 8 weeks gestation (CS18), separate atrioventricular valves can be seen (arrowheads in Fig.4D,E), with left sided mitral and right sided tricuspid valves forming. An embryo at 8 weeks (CS18) is approximately 10 mm in size, correlating well with the embryonic stage at which fusion of the endocardial cushions is thought to occur26. The valve leaflets however appear thick at this stage (see Supplemental Movie 4). By 9 1/7 weeks (CS22), the atrioventricular valve leaflets are thinner and more mature in appearance (Fig.3H;Supplemental Movie 5). At 7 3/7 weeks (CS16), distinct posterior and anterior cushions are not observed, the inferior atrioventricular cushion is observed and this timing is consistent with previous reports of human embryonic development.22
Figure 4. Major milestones of atrioventricular valve morphogenesis.
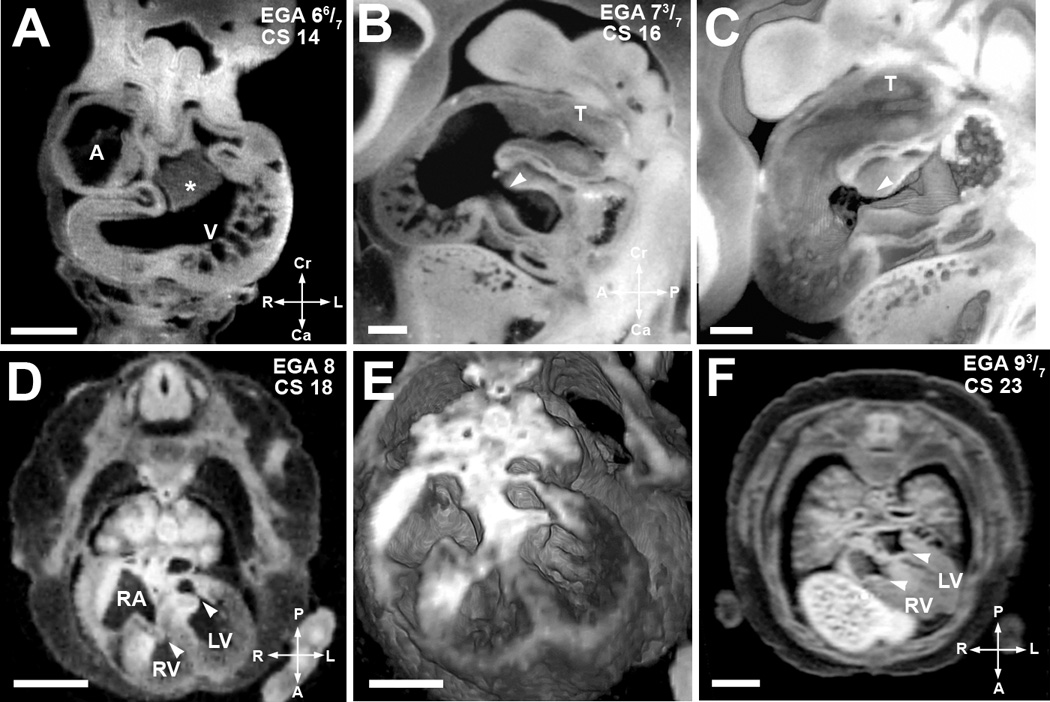
(A). EFIC image of an embryo at EGA 6 6/7 weeks (CS 14) in the transverse plane shows a large endocardial cushion (*) in the center of the cardiac loop. Scale bar = 0.515 mm
(B,C). EFIC image of an embryo at EGA 7 3/7 weeks (CS16) in a sagittal plane (B) shows a tight, well formed atrioventricular junction (arrowhead) and the truncus arteriosus (T). 3D volume of the same embryo (C) shows exquisite detail of the contour and shape of the endocardial cushions and the truncus arteriosus (T). Scale bar in (B,C)=0.389mm.
(D,E). MRI image in an oblique transverse plane (D) of an embryo at EGA 8 weeks (CS 18) shows separate atrioventricular valves. The valve leaflets appear thick at this stage. Note right and left atrioventricular valves denoted by arrowheads. 3D volume of the same embryo (E) shows indentation associated with the opening in the inlet ventricular septum. Scale bar for (D)=1.5 mm, (E)=1.1mm.
(F) MRI image in an oblique transverse plane of a more mature EGA 9 3/7 weeks (CS 23) embryo. It shows separate atrioventricular valves with thinner valve leaflets (arrowheads). The inlet septum is closed. Scale bar = 2 mm.
A: primitive atrium, RA: right atrium, V: ventricular chamber, RV: right ventricular chamber, LV: left ventricular chamber
Outflow Septation and Semilunar Valve Morphogenesis (EGA 7 3/7 to 8 weeks)
The major developmental processes occurring at the level of the truncus arteriosus consist of septation into two separate arterial channels, and semilunar valve morphogenesis. The truncus arteriosus is formed largely from cells derived from the secondary heart field27. Septation of the truncus arteriosus is dependent on activity of the secondary heart field and migrating neural crest cells28, 29, and is achieved with in growth of ridges. In the proximal truncus arteriosus, we observed truncal cushions in the form of swellings at 7 1/7 weeks (CS15) (arrowhead in Fig.5A). This forming aorticopulmonary septum undergoes a gradual spiraling course that ultimately completes truncus arteriosus septation into separate aorta and pulmonary arteries28. At 7 3/7 weeks (CS16), this spiraling course of the forming aorticopulmonary septum is evident as a spiraling in the orientation of the lumen along the proximodistal axis of the truncus arteriosus (Fig.5D–F). The truncus arteriosus remains as a single channel proximally (Fig.5D–E), but distally, it divides into two separate channels (Fig.5F; Supplemental Movie 7). Smooth muscle derived from the secondary heart field and from cardiac neural crest cells plays a crucial role in the septation and alignment of the truncus arteriosus28.
Figure 5. Septation of the truncus arteriosus.
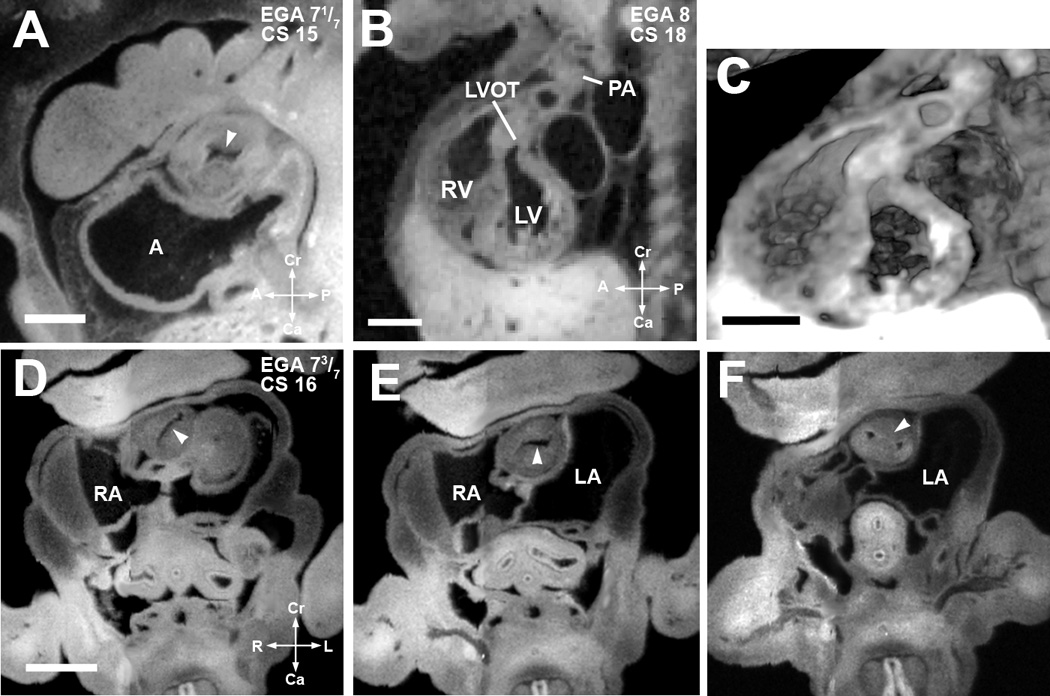
(A). EFIC image of an embryo at EGA 7 1/7 weeks (CS 15) in the sagittal plane shows a single orifice of the truncus arteriosus with inward swelling of the aorticopulmonary septum (arrowhead) which precedes septation of the truncus arteriosus. Scale bar = 0.622 mm.
(B,C) EFIC image of an EGA 8 (CS 18) embryo (B) show a distinct pulmonary artery (PA) emerging from the right ventricle (RV) and a left ventricular outflow tract (LVOT) or aorta emerging from the left ventricle (LV). 3D volume of the same embryo (C) shows crossing of the great arteries. Scale bar in (B,C)=1.35 mm.
(D–F). EFIC images of a embryo at EGA 7 3/7 weeks (CS 16) in oblique transverse planes showing the truncus arteriosus. Note changing orientation of the lumen (D,E) indicative of spiraling of the cushions (see arrowheads). In (F), the aorticopulmonary septum (arrowhead) has divided the distal portion of the truncus arteriosus into two separate arterial channels to the right and left of the aorticopulmonary septum. Scale bar = 0.9 mm.
A: primitive atrium, RA: right atrium, LA: left atrium, RV: right venetricle, LV: left ventricle.
Bartelings and Gittenberger de Groot6 suggested that in 7 3/7 weeks (CS16) embryos septation begins at the ventriculo-arterial junction and progresses proximal to distal in the truncus arteriosus. However, our findings show septation of the truncus arteriosus occurring in the opposite direction, being complete distally in the 7 3/7 week (CS16) embryo, at a time when the proximal truncus arteriosus is still undivided. This would suggest that the direction of septation is distal to proximal. This is supported by Kirby28, who described the proximal truncus arteriosus closing zipper-like from distal to proximal towards the ventricles. Our data also support both the timing and direction of septation proposed by Anderson et al29. They described septation of the truncus arteriosus initiating distally and progressing proximally with the presence of distal septation and the absence of proximal septation at 7 3/7 week (CS 16). Moore19 described bulbar ridges at the fifth week post conception, equivalent to 7 weeks gestation. Assuming the bulbar and truncal cushions are forming at the same time, our finding of truncal cushions in the outflow at 7 1/7 weeks (CS15) also corroborates these investigators’ timeframe.
The process of semilunar valve morphogenesis, similar to atrioventricular valve morphogenesis, began earlier with the formation of truncal cushion tissue which was observed in the outflow starting at 7 1/7 weeks (CS15). At 8 weeks (CS18), distinct pulmonary and aortic valves can be seen (Fig.5B,C). These valve leaflets, as well as atrioventricular valve leaflets, are initially thick. They undergo a process of thinning as the valve leaflets continue to form and mature; a process that continues well after the formation of distinct valve leaflets (Fig. 6). By 9 1/7 weeks (CS22), all of the major structures of the heart are formed, with the last developmental milestone being completion of the inlet ventricular septum (see above).
Figure 6. Developmental time course of human cardiac morphogenesis.

Outlined in the chart is the timing for major cardiac morphogenetic events and the presence of various cardiac structures in the human embryo. The timeline indicated for Atrioventricular Junction/Valve Formation (green bar) refer to when a distinct atrioventricular junction is observed before atrioventricular valve leaflets are evident. The timelime indicated for Semilunar Valve Formation (orange bar) refer to when distinct truncal cushion tissue is observed and before semilunar valve leaflets are evident. The demarcation of Mitral Valve, Tricuspid Valve, Aortic Valve and Pulmonary Valve delineate the developmental stages when distinct valve leaflets are observed and the stages when the valve leaflets continue to undergo maturation and thinning. The timeline indicated for Interventricular Foramen refer to when any communication is present between the right and left ventricular chambers.
Supplementary Material
Figure 7. Summary of Human Cardiac Developmental Milestones.
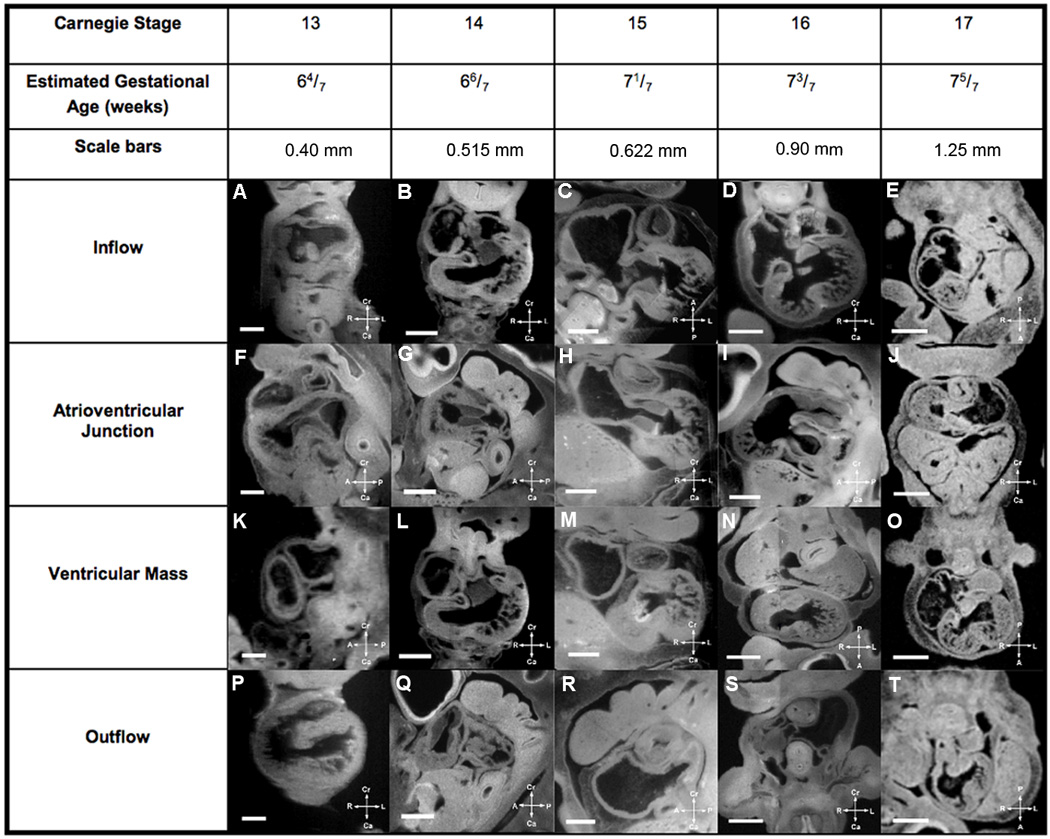
Major cardiac developmental structures present in EGA 6 4/7 weeks to 7 5/7 weeks (CS13–17) embryos are summarized in Figure 7, while Figure 8 shows the major developmental structures present in EGA 8 weeks to 9 3/7 weeks (CS18–23) embryos. One can look at a developmental structure at a specific estimated gestational age to determine what normal development is for that structure at that age in human cardiac development. The compass orients the observer to the plane of section.
Figure 8. Summary of Human Cardiac Developmental Milestones.

Major cardiac developmental structures present in EGA 6 4/7 weeks to 7 5/7 weeks (CS13–17) embryos are summarized in Figure 7, while Figure 8 shows the major developmental structures present in EGA 8 weeks to 9 3/7 weeks (CS18–23) embryos. One can look at a developmental structure at a specific estimated gestational age to determine what normal development is for that structure at that age in human cardiac development. The compass orients the observer to the plane of section.
Summary.
As rapid advances in technology provide first trimester human fetal cardiac imaging and opportunities for in utero intervention continue to advance, there is increasing need for data documenting human cardiac development in the first trimester. Using a large data set generated by MRI and EFIC imaging, the major developmental milestones of human cardiac morphogenesis were delineated spanning EGA 6 4/7–9 3/7 weeks. A summary timeline is provided in Figure 6 for the temporal profile of atrial and ventricular septation, outflow septation and valvular morphogenesis. In addition, Figures 7 and 8 were generated as reference guides to aid clinical practice. They contain thumbnail images of cardiac structures seen at each developmental milestone of cardiac morphogenesis. Full size images and Quicktime movies of the 2D serial image stacks of these embryos can be viewed via the online supplement (Movies 1–7) and the web based Human Embryo Atlas (http://apps.nhlbi.nih.gov/HumanAtlas/). A deeper understanding of human cardiovascular development, including this large dataset and the reference guides generated, may ultimately aid in clinical practice and facilitate prenatal diagnosis of CHD and appropriate counseling of families.
Acknowledgments
Funding
This work was supported by NIH grant ZO1-HL005701. The Kyoto collection was supported by Japanese Ministry of Education, Culture, Sports, Science and Technology (Grant 19390050); Japanese Ministry of Health, Labor and Welfare (Grant: 17A-6) and Japan Science Technology Agency (BIRD grant). S.Yamada was supported by Kyoto University Foundation.
Footnotes
Disclosures
Preeta Dhanantwari: None; Elaine Lee: None; Anita Krishnan: None; Rajeev Samtani: None; Shigehito Yamada: None; Stasia Anderson: None; Elizabeth Lockett: None; Mary Donofrio: None; Kohei Shiota: None; Cecilia Lo: None;
Linda Leatherbury: Research Grant: Comparison of Human Cardiac Development in the First Trimester with Mouse: Analysis with High Resolution MRI and EFIC.
REFERENCES
- 1.Kramer T. The partitioning of the truncus and conus and the formation of the membranous portion of the interventricular septum in the human heart. Am J Anat. 1942;71:343–370. [Google Scholar]
- 2.Grant RP. The embryology of ventricular flow pathways in man. Circulation. 1962;25:756–779. doi: 10.1161/01.cir.25.5.756. [DOI] [PubMed] [Google Scholar]
- 3.Goor DA, Edwards JE, Lillehei CW. The development of the interventricular septum of the human heart; correlative morphogenetic study. Chest. 1970;58:453–467. doi: 10.1378/chest.58.5.453. [DOI] [PubMed] [Google Scholar]
- 4.Anderson RH, Wilkinson JL, Arnold R, Lubkiewicz K. Morphogenesis of bulboventricular malformations. I. Consideration of embryogenesis in the normal heart. Br Heart J. 1974;36:242–255. doi: 10.1136/hrt.36.3.242. [DOI] [PMC free article] [PubMed] [Google Scholar]
- 5.Orts-Llorca F, Puerta Fonolla J, Sobrado J. The formation, septation and fate of the truncus arteriosus in man. J Anat. 1982;134(Pt 1):41–56. [PMC free article] [PubMed] [Google Scholar]
- 6.Bartelings MM, Gittenberger-de Groot AC. The outflow tract of the heart--embryologic and morphologic correlations. Int J Cardiol. 1989;22:289–300. doi: 10.1016/0167-5273(89)90270-2. [DOI] [PubMed] [Google Scholar]
- 7.Tonge M. Observations on the development of the semilunar valves of the aorta and pulmonary artery of the heart of the chick. Phil Trans Roy Soc (London) 1869;159:387–411. [Google Scholar]
- 8.Hamburger VHH. A series of normal stages in the development of the chick embryo. Journal of Morphology. 1951;88:49–92. [PubMed] [Google Scholar]
- 9.DeHaan RL. Development of form in the embryonic heart. An experimental approach. Circulation. 1967;35:821–833. doi: 10.1161/01.cir.35.5.821. [DOI] [PubMed] [Google Scholar]
- 10.Rosenthal J, Mangal V, Walker D, Bennett M, Mohun TJ, Lo CW. Rapid high resolution three dimensional reconstruction of embryos with episcopic fluorescence image capture. Birth Defects Res C Embryo Today. 2004;72:213–223. doi: 10.1002/bdrc.20023. [DOI] [PubMed] [Google Scholar]
- 11.Smith BR, Linney E, Huff DS, Johnson GA. Magnetic resonance microscopy of embryos. Comput Med Imaging Graph. 1996;20:483–490. doi: 10.1016/s0895-6111(96)00046-8. [DOI] [PubMed] [Google Scholar]
- 12.Shiota K, Yamada S, Nakatsu-Komatsu T, Uwabe C, Kose K, Matsuda Y, Haishi T, Mizuta S, Matsuda T. Visualization of human prenatal development by magnetic resonance imaging (MRI) Am J Med Genet A. 2007;143A:3121–3126. doi: 10.1002/ajmg.a.31994. [DOI] [PubMed] [Google Scholar]
- 13.Nishimura H. Prenatal versus postnatal malformations based on the Japanese experience on induced abortions in the human being Aging Gametes: Their Biology and Pathology. Seattle, WA: Karger, AG and Basel; 1975. [Google Scholar]
- 14.Nishimura H, Takano K, Tanimura T, Yasuda M. Normal and abnormal development of human embryos: first report of the analysis of 1,213 intact embryos. Teratology. 1968;1:281–290. doi: 10.1002/tera.1420010306. [DOI] [PubMed] [Google Scholar]
- 15.Shiota K. Development and intrauterine fate of normal and abnormal human conceptuses. Congenit Anom Kyoto. 1991;31:67–80. [Google Scholar]
- 16.Yamada S, Uwabe C, Fujii S, Shiota K. Phenotypic variability in human embryonic holoprosencephaly in the Kyoto Collection. Birth Defects Res A Clin Mol Teratol. 2004;70:495–508. doi: 10.1002/bdra.20048. [DOI] [PubMed] [Google Scholar]
- 17.O'Rahilly RMF. Developmental stages in human embryos: including a revision of Streeter’s “Horizons” and a survey of the Carnegie collection. Washington DC: Carnegie Institution of Washington publication. 1987 [Google Scholar]
- 18.Weninger WJ, Mohun T. Phenotyping transgenic embryos: a rapid 3-D screening method based on episcopic fluorescence image capturing. Nat Genet. 2002;30:59–65. doi: 10.1038/ng785. [DOI] [PubMed] [Google Scholar]
- 19.Moore K, Persaud T. The developing human clinically oriented embryology. 8th ed. Philadelphia: WB Saunders; 2007. [Google Scholar]
- 20.Lamers WH, Moorman AF. Cardiac septation: a late contribution of the embryonic primary myocardium to heart morphogenesis. Circ Res. 2002;91:93–103. doi: 10.1161/01.res.0000027135.63141.89. [DOI] [PubMed] [Google Scholar]
- 21.Wessels A, Anderson RH, Markwald RR, Webb S, Brown NA, Viragh S, Moorman AF, Lamers WH. Atrial development in the human heart: an immunohistochemical study with emphasis on the role of mesenchymal tissues. Anat Rec. 2000;259:288–300. doi: 10.1002/1097-0185(20000701)259:3<288::AID-AR60>3.0.CO;2-D. [DOI] [PubMed] [Google Scholar]
- 22.Anderson RH, Webb S, Brown NA, Lamers W, Moorman A. Development of the heart: (2) Septation of the atriums and ventricles. Heart. 2003;89:949–958. doi: 10.1136/heart.89.8.949. [DOI] [PMC free article] [PubMed] [Google Scholar]
- 23.Stadtfeld M, Ye M, Graf T. Identification of interventricular septum precursor cells in the mouse embryo. Dev Biol. 2007;302:195–207. doi: 10.1016/j.ydbio.2006.09.025. [DOI] [PubMed] [Google Scholar]
- 24.Wessels A, Vermeulen JL, Verbeek FJ, Viragh S, Kalman F, Lamers WH, Moorman AF. Spatial distribution of "tissue-specific" antigens in the developing human heart and skeletal muscle. III. An immunohistochemical analysis of the distribution of the neural tissue antigen G1N2 in the embryonic heart; implications for the development of the atrioventricular conduction system. Anat Rec. 1992;232:97–111. doi: 10.1002/ar.1092320111. [DOI] [PubMed] [Google Scholar]
- 25.Lamers WH, Wessels A, Verbeek FJ, Moorman AF, Viragh S, Wenink AC, Gittenberger-de Groot AC, Anderson RH. New findings concerning ventricular septation in the human heart. Implications for maldevelopment. Circulation. 1992;86:1194–1205. doi: 10.1161/01.cir.86.4.1194. [DOI] [PubMed] [Google Scholar]
- 26.Van Mierop LH, Kutsche LM. Development of the ventricular septum of the heart. Heart Vessels. 1985;1:114–119. doi: 10.1007/BF02066358. [DOI] [PubMed] [Google Scholar]
- 27.Waldo KL, Hutson MR, Ward CC, Zdanowicz M, Stadt HA, Kumiski D, Abu-Issa R, Kirby ML. Secondary heart field contributes myocardium and smooth muscle to the arterial pole of the developing heart. Dev Biol. 2005;281:78–90. doi: 10.1016/j.ydbio.2005.02.012. [DOI] [PubMed] [Google Scholar]
- 28.Kirby M. Cardiac development. New York: Oxford University Press; 2007. [Google Scholar]
- 29.Anderson RH, Webb S, Brown NA, Lamers W, Moorman A. Development of the heart: (3) formation of the ventricular outflow tracts, arterial valves, and intrapericardial arterial trunks. Heart. 2003;89:1110–1118. doi: 10.1136/heart.89.9.1110. [DOI] [PMC free article] [PubMed] [Google Scholar]
Associated Data
This section collects any data citations, data availability statements, or supplementary materials included in this article.