Abstract
An EMCCD-based dual modular x-ray imager was recently designed and developed from the component level, providing a high dynamic range of 53 dB and an effective pixel size of 26 μm for angiography and fluoroscopy. The unique 2×1 array design efficiently increased the clinical field of view, and also can be readily expanded to an M×N array implementation. Due to the alignment mismatches between the EMCCD sensors and the fiber optic tapers in each module, the output images or video sequences result in a misaligned 2048×1024 digital display if uncorrected. In this paper, we present a method for correcting display registration using a custom-designed two layer printed circuit board. This board was designed with grid lines to serve as the calibration pattern, and provides an accurate reference and sufficient contrast to enable proper display registration. Results show an accurate and fine stitching of the two outputs from the two modules.
I. Introduction
Electron-multiplying CCDS (EMCCDs) are excellent imaging platforms because they provide high sensitivity, high speed, high resolution, and acquisition of low noise images necessary for bio-medical imaging applications [1]. The built-in electron multiplication registers directly multiply charge on chip before conversion to a voltage signal by the output amplifier, thus suppressing the effective read-out noise to negligible levels. We have built a solid state x-ray image intensifier (SSXII) system using the Texas Instruments EMCCD chip TC285SPD to provide full control over the imaging system and to enable expansion towards clinical field of views (FOV) using a prototype 2×1 array configuration. The system analog circuitry consists of a power board, driver boards, a FPGA board, head boards and a CameraLink board. The system optical front end includes one continuous CsI scintillator, two abutted fiber-optic tapers (FOTs) for the two modules, and a fiber-optic (FOP) window attached to each of two separate EMCCD sensors [2]. The system operates at up to 17.5 frames per second (fps), providing a video-like display, while a frame rate of 30fps can be achieved by using a 2×2 binning scheme. The analysis of the quantum performance of the imaging system shows a dynamic range of 53 dB, a full well capacity of 31ke−, a read-out noise of 71 e− at gain 1. The read-out noise decreases proportionally with higher gains [1].
The raw image or video output from the two sensors is a misaligned 2048×1024 image due to the arbitrary coupling between FOTs and FOPs, although a continuous non-abrupt optical input is presented by the CsI x-ray-to-light conversion phosphor. In order to provide an acceptable digital output, geometric corrections are needed to complete the image stitching.
A number of image stitching techniques and algorithms have been developed for image registration as detailed in [3]–[5]. However, these methods require two images containing the same features to perform the needed calculations, which is not suitable for this system.
In this paper, we introduce an x-ray image calibration printed circuit board (XICPCB) as the calibration object. The design and layout of this two-layer PCB will be described in detail in Section II. In Section III, we explain the image registration method which is based on the object counting technique that enables us to obtain the image translation parameters. Additional results will be presented in Section IV, and section V summarizes the conclusions of this work.
II. MATERIALS
A. EMCCD-based Dual Modular X-ray Imager
This newly designed EMCCD-based dual modular x-ray imager front end consists of an optical part and an electronic (analog circuitry) part.
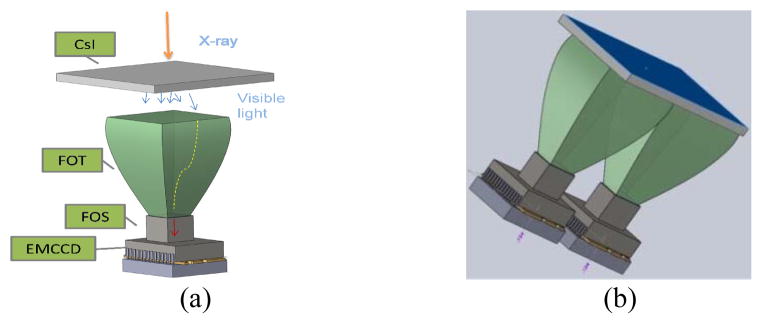
For the optical part, two FOTs are placed side by side and coupled by optical gel at the large ends to the single CsI scintillator, while the small FOT ends are coupled to two separate FOP windows which are attached to the EMCCD sensors. Figure 1(a) depicts a single module system that converts x-ray photons into light photons and transfers them to the EMCCD image area through the FOT and FOP. Figure 1(b) shows how the dual modules were placed to enlarge the FOV.
Fig. 1.
Illustrations of the optical part of the EMCCD-based x-ray imager. (a) Single module configuration. X-ray photons are converted to light photons by CsI phosphor. A 3.3:1 ratio FOT transfers the light to FOP and EMCCD sensor, where the optical signal is captured and converted to an electronic signal. (b) Dual module configuration. Two FOTs are placed side by side and coupled onto a single piece of CsI phosphor to enlarge the FOV.
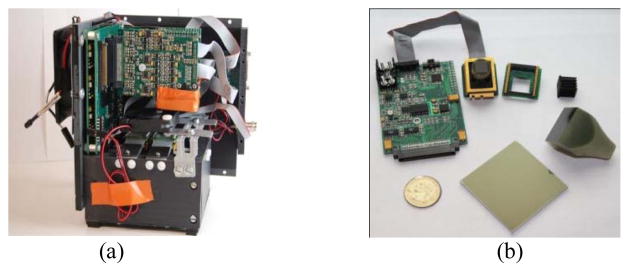
For the electronic part, the imaging system consists of power boards, driver boards, FPGA board, head board and CameraLink board. Figure 2 shows a populated front end as well as an unpopulated one. Details of the modular design can be found in reference [2].
Fig. 2.
(a) A populated dual module EMCCD-based x-ray imager front end. The black box contains FOTs, FOPs and CsI phosphor. All above mentioned necessary analog circuitry sits on top of the enclosure. (b) An unpopulated one module showing a driver board and head board, as well as the optical front end.
B. X-ray Image Calibration PCB
A double layer customized XICPCB was designed to serve as an imaging object, providing a high-contrast x-ray imaging pattern. The CAD layout of the board is shown in Figure 3; all green lines are on the top layer of the board, while the red lines are on the bottom layer. This design avoids geometric distortions at the crossing points, which are used for object counting. Both trace width and space between traces are 7 mils, which provides a high resolution pattern to enable matching corrections to be made. This pattern includes three areas: 1 mm center-to-center indicator in the top left, perpendicular rows and columns with indicator in the center, and an isosceles triangle on the right. The center part will be used in this study to extract translation parameters, while the other parts are for future applications. In fabrication, 1 oz copper is used and the board measures 50mm × 25 mm.
Fig. 3.
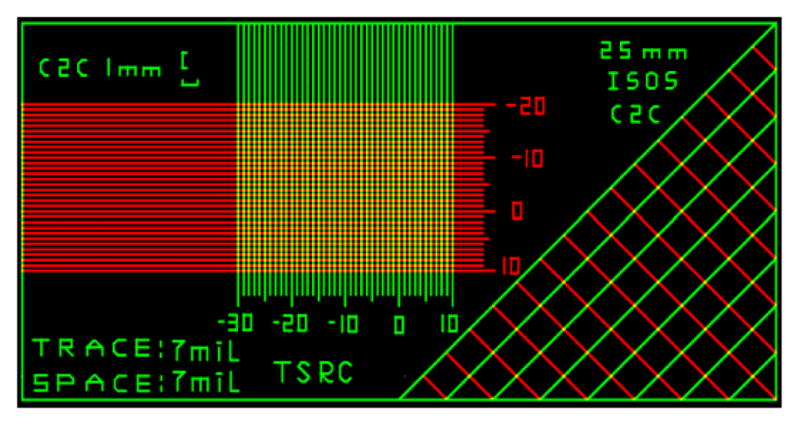
A double layer custom-designed XICPCB serves as the calibration pattern object for the image geometric corrections.
III. Method
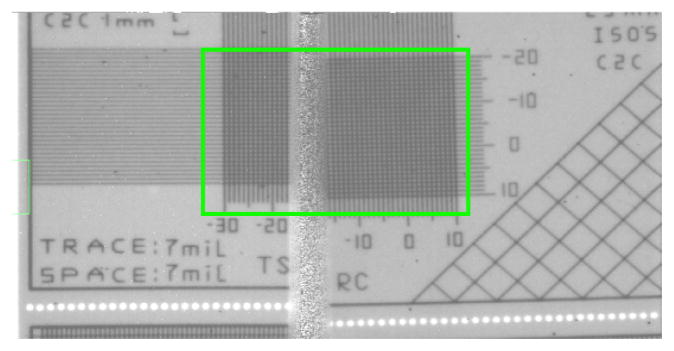
Figure 4 shows the raw x-ray image of the XICPCB obtained with the two-module array. The center grid pattern was placed in the FOV so as to cross the junction line of the two sensors. Obvious misalignment can be observed in terms of: 1) image orientation due to the slightly different angles of the EMCCD sensors when coupled to the FOTs; 2) image magnification due to the small variability in the FOT ratios in the xy direction; and 3) image translational shift. All misalignments need to be corrected to complete the seam registration.
Fig. 4.
A raw x-ray image of XICPCB with the high resolution grid pattern at the center of the FOV, as indicated in the region of interest (ROI) box.
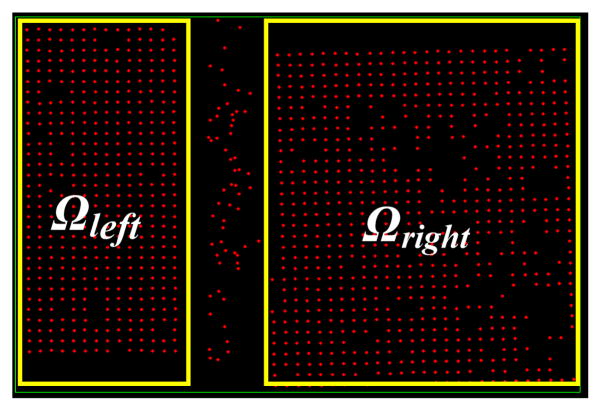
By using an object counting technique, the cross points in the ROI with higher contrast can be identified as objects and form a binary image, as shown in Figure 5.
Fig. 5.
A binary image of the ROI of the XICPCB with the threshold value set at a digital number of 128 and the constraint of object size set to between 3 and 10 pixels. The red dots represent the center location of the recognized objects. Ωleft and Ωright are effective image area from left and right sensors respectively.
A. Image Orientation
Image orientation alignment for the Ωleft and Ωright can be calculated using the slopes of the lines that were computed from a linear fit to the dots in every row. An average slope value S̿ was calculated from the fitted slopes Si, of all the rows with the following equation:
| (1) |
where Si is the individual line slope value, S̄ is the mean value of all the line slopes within each sensor, σs is the standard deviation of the set of Si.
The image angle θ is thus given by:
| (2) |
By determining the image angle for the left and right sensors, θleft; and θright;, the right sensor image orientation can be adjusted by rotating θleft; − θright;, degrees.
Figure 6 shows an orientation adjusted image obtained by rotating the right image with respect to the left.
Fig. 6.
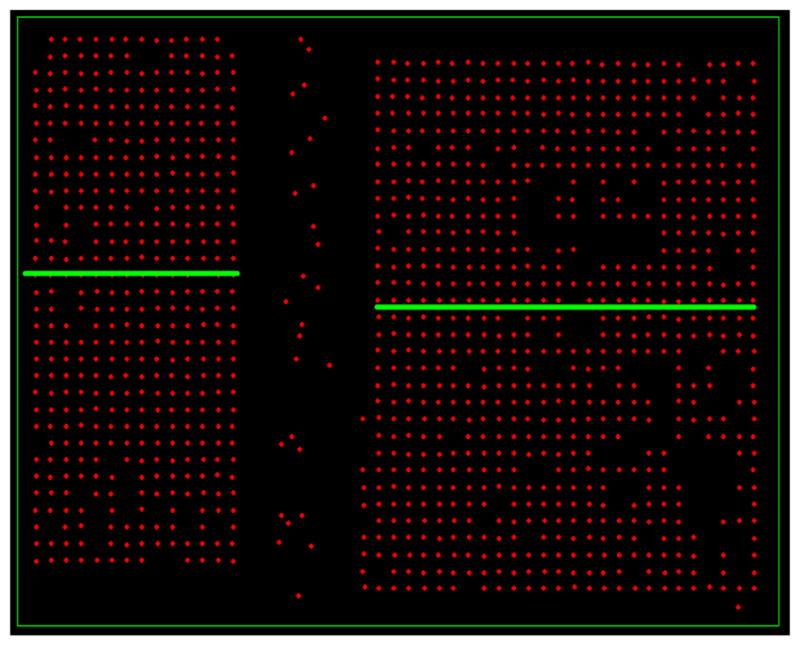
An orientation corrected image obtained by adjusting the right image with respect to the left. The green lines indicate the same image orientation, but not necessarily at the same level.
B. Image magnification adjustment
Unlike the traditional x-ray intensifier, the image distortions in the SSXII are negligible. However, variability in FOTs ratios can introduce different magnification factors for individual sensors. To get the x and y direction zoom factor, the distance that contains the same number of continuous dots in both x and y directions were calculated to find out the magnification ratio.
| (3) |
where Rx and Ry are the zoom factors for x and y direction that applies to the right image, ux,l and ux,r are the averaged distance that contains the same number of continuous dots in the x direction for Ωleft and Ωright. ϑy,l and ϑy,r are the averaged distance that contains the same number of continuous dots in the y direction for Ωleft and Ωright. While ux,l,r and ϑy,l,r can be obtained by the following equations:
| (4) |
| (5) |
where ui is the distance for the ith row that contains the same number of continuous dots in Ωleft and Ωright in x direction, ū is the mean value of the ui, and σu is the standard deviation of the set of ui, ϑj is the distance a jth row that contains the same number of continuous dots in Ωleft and Ωright in y direction, ϑ̄ is the mean value of the ϑj and σϑ is the standard deviation of the set of ϑj. Figure 7 is the magnification factor corrected image.
Fig. 7.
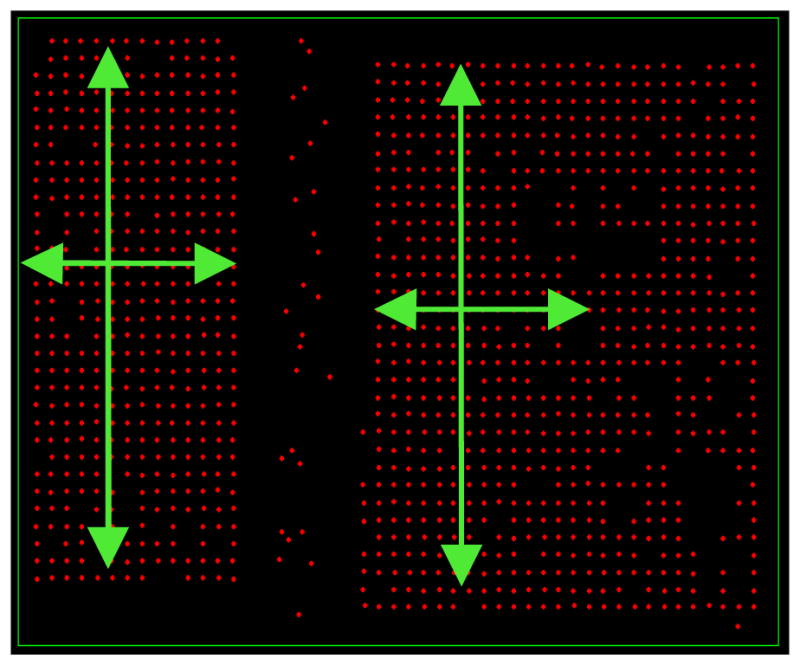
A right sensor magnification corrected image with the x direction reduced by a factor of 1.029 and y direction reduced by a factor of 1.027.
C. Image coordinate translation correction
Image coordinate translational correction can be achieved by shifting the entire right image in the x and y direction:
| (6) |
where X and Y are the original x and y positions, X′ and Y′ are the translated positions for the right image, and xT and yT are the coordinate shifting values for the x and y axis.
The optimal x shift is taken to be the average difference between the separation of dots on the adjacent edges of corresponding rows of Ωleft and Ωright and the average x-separation between all dots in the matrix. Expressed mathematically, for optimal xT:
| (7) |
where xTK is the x shifting value in the rows that contains dots at the edge of Ωleft and Ωright, xk,Nr is the edge-dot (located at the Nth column indicated by the scale on the XICPCB) x-axis value in the kth row in Ωright, xk,Ml is the edge-dot (located at the Mth column indicated by the scale on the XICPCB) x-axis value in the kth row in Ωleft, Ml,k and Nr,k are the edge column number from Ωleft and Ωright. x̄ is the average distance between two continuous dots in x direction in the whole effective image area. K is the total number of xTK in the summation (K=30 in this study), k is the summation index and indicates the kth row,
For the optimal yT, dots in the same row at each side of the image will be along a single line expressed as:
| (8) |
From step A, we have already aligned the orientation of the two images, and have determined the row slope S̿. To have the optimal yT, the difference between bleft and bright should be minimized. This is done by taking the average b value difference over all rows so that the optimal yT is given by:
| (9) |
where K is the total number of rows in the ROI (K=30 in this study), yTj is the y shifting value in each row, and are the mean values of y position and x position for the dots in Ωleft in the jth row, and and are the mean values of the translated y position and x position for the dots in Ωright in the jth row. Figure 8 below shows an image coordinate translation correction result.
Fig. 8.
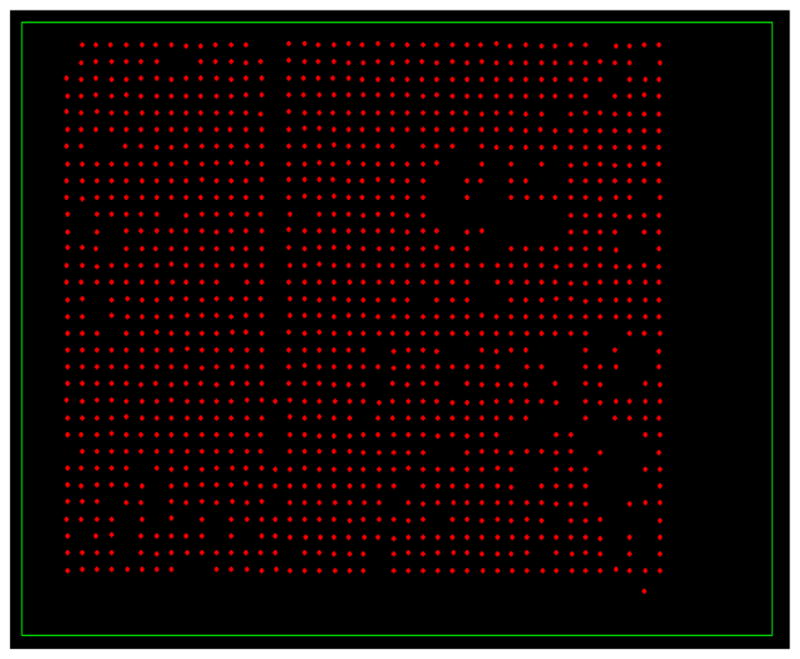
Image coordinate corrected by shifting righ ht image upwards by 18 pixels and leftwards 102 pixels.
IV. Results
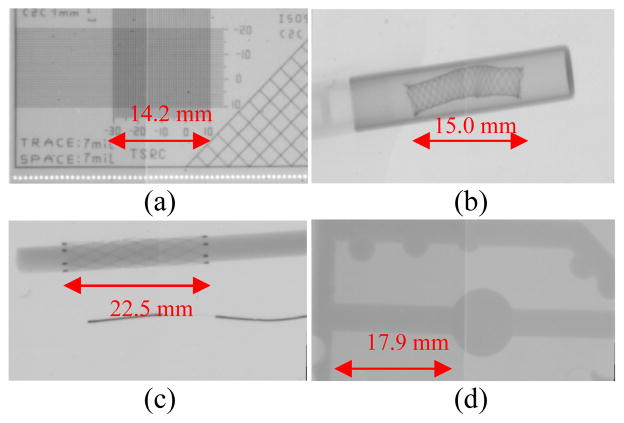
By applying all image geometric correction parameters, the output images show continuity in the 2×1 array. However, due to the chamfers on the larger end of the FOTs direct abutment was not possible, resulting in a registration seam that is noticeable in the middle of the image. Corrected images of various objects are shown in Figures 9(a) to (d).
Fig. 9.
Composite images with proposed geometric correction method. Imaging object of (a) XICPCB. (b) a pipeline stent. (c) a guide wire and a stent. (d) a stenosis/aneurysm artery block phantom.
V. Conclusion
Using the x-ray image calibration printed circuit board as a calibration object, we successfully implemented a geometric image matching correction scheme for a new EMCCD-based 2×1 array. The two-layer XICPCB provides accurate rows and columns as well as crossing points with good contrast under x-ray exposure. The objects counting algorithm efficiently identifies the effective crossing point center locations, which provides image information in terms of orientation, magnification factor, and coordinate translation. By setting all the parameters in advance, the EMCCD-based dual modular x-ray imager can provide geometrically corrected images or video sequences.
Acknowledgments
This project was supported in part by NIH Grants R01-EB008425 and R01-EB002873 and an equipment grant from Toshiba Medical Systems Corp.
Contributor Information
Bin Qu, Email: binqu@buffalo.edu, The Department of Electrical Engineering, University at Buffalo, Buffalo, NY 14260 USA.
Ying Huang, Email: yh42@buffalo.edu, The Department of Electrical Engineering, University at Buffalo, Buffalo, NY 14260 USA.
Weiyuan Wang, Email: ww34@buffalo.edu, The Departments of Physiology and Biophysics, University at Buffalo, Buffalo, NY 14214 USA.
Alexander N. Cartwright, Email: anc@buffalo.edu, The Departments of Electrical Engineering and Biomedical Engineering, University at Buffalo, Buffalo, NY 14260 USA.
Albert H. Titus, Email: ahtitus@buffalo.edu, The Departments of Electrical Engineering and Biomedical Engineering, University at Buffalo, Buffalo, NY 14260 USA.
Daniel R. Bednarek, Email: bednarek@buffalo.edu, The Departments of Radiology, Neurosurgery, Physiology and Biophysics, University at Buffalo, Buffalo, NY 14214 USA
Stephen Rudin, Email: srudin@buffalo.edu, The Departments of Radiology, Mechanical and Aerospace Engineering, Electrical Engineering, Biomedical Engineering, Physiology and Biophysics, and Neurosurgery, University at Buffalo, Buffalo, NY 14214 USA.
References
- 1.Qu B, Kuhls-Gilcrist AT, Huang Y, Wang W, Cartwright AN, Titus AH, Bednarek DR, Rudin S. Quantum performance analysis of an EMCCD-based x-ray detector using photon transfer technique. IEEE NSS/MIC 2010. doi: 10.1109/NSSMIC.2010.5874445. In print. [DOI] [PMC free article] [PubMed] [Google Scholar]
- 2.Huang Y, Qu B, Sharma P, Kuhls-Gilcrist AT, Wang W, Titus AH, Cartwright AN, Bednarek DR, Rudin S. Component Level Modular Design of a Solid State X-ray Image Intensifier for MxN Arrays. IEEE NSS/MIC 2010 conference; In print. [DOI] [PMC free article] [PubMed] [Google Scholar]
- 3.Wang Y, Wang M. Research on stitching technique of medical infrared images. 2010 Inter Conf on Computer Application and System Modeling. 10:V10–490. [Google Scholar]
- 4.Zhao X, Wang H, Wang Y. Medical image seamless stitching by SIFT and GIST. 2010 Inter. Conf. on E-Product E-Service and E-Entertainment; p. 1. [Google Scholar]
- 5.Jia Jiaya, Tang Chi-Keung. Image stitching using structure deformation. IEEE Trans Pattern Analysis and Machine Intelligence. 2008 Apr;30(4):617–631. doi: 10.1109/TPAMI.2007.70729. [DOI] [PubMed] [Google Scholar]


