Abstract
The inter-subject variability of visual cortex reorganization was assessed in late-blind subjects suffering from retinitis pigmentosa (RP), a degenerative retinal disease that results in tunnel vision and eventual loss of sight. fMRI BOLD responses were measured as blindfolded RP and blindfolded sighted control groups completed a tactile discrimination task (in which subjects determined the relative roughness of sandpaper discs) during successive scans in a 3T Siemens scanner. Resulting activation patterns were compared between the two groups in a whole-brain analysis. We found that vision deprivation leads to elevated activation of the visual cortex elicited with tactile stimuli, and the degree of activation correlates with the degree of visual field loss: higher visual cortex activation is associated with greater vision loss. The location of vision loss in the visual field also correlates with the location of tactile responses in the visual cortex, with greater peripheral vision loss leading to stronger activation in the peripheral of V1. Visual cortex responses to tactile stimuli may hence be used as a diagnostic marker in determining the extent of an individual’s vision loss and tracking sight recovery following treatments.
I. Introduction
Previous fMRI studies suggest that vision deprivation in humans causes the visual cortex to be modulated by the processing of certain non-visual stimuli, including tactile input. Tactile discrimination studies have shown increased activation of posterior occipital areas when compared to their sighted counterparts [1, 2]. A pattern of visual cortex activation similar to that seen in blind subjects during tactile tests was observed in sighted subjects after they were blindfolded for five days; this cross-modal activation was reversed within 24 hours of removing the blindfold [3]. The cause of activation in low-level visual cortex during tactile stimulation is in dispute. Early studies by Sadato et al. 1996 postulated that in the blind, tactile input extended from the early somatosensory cortex to the dorsal posterior occipital cortex via the posterior parietal cortex [4], which is consistent with the view that the occipital cortex may be part of a multisensory pathway for shape representation [5]. It has also been suggested that the occipital cortex may act as an operator of a function based on the best-suited input available [6]. However, several recent studies on humans and monkeys have questioned these functional claims and instead suggest that the observed activations may be unmasked feedback signals driven by task demands that would otherwise be functional in the presence of visual inputs [7, 8].
Regardless of its cause, cross-modal activation of the visual cortex, if correlated with vision loss, can be a useful physiological marker for tracking the neural consequence of the disease and for assessing progress following sight-recovery treatments. The current study measures the extent of cross-modal responses in the visual cortex of late-blind individuals with retinitis pigmentosa (RP), a genetic degenerative disease that results in gradual vision degradation and eventual blindness. Individuals with RP experience deterioration of the photoreceptor layer, yielding night blindness, tunnel vision, and eventual complete loss of foveal vision. We sought to characterize and correlate tactile-evoked visual cortex activity with degrees of peripheral and foveal vision loss across individuals with RP.
II. Methods
A. Subjects
Eleven subjects participated in the study, including 5 normally-sighted individuals and 6 individuals diagnosed with RP; sighted control subjects were gender-matched to the RP subjects (Table 1). Diagnosis of RP was confirmed by each individual’s primary ophthalmologist, and visual field and visual acuity information was obtained from subjects’ medical records after receiving HIPAA authorization from the subjects. The study received approval from the University of Southern California’s University Park Campus Institutional Review Board. All subjects provided written informed consent prior to participating.
TABLE I.
Subject Demographics
| Subject ID | Age | Gender | Description of Vision Status |
|---|---|---|---|
| RP1 | 43 | Male | RP; minimal light perception |
| RP2 | 58 | Female | RP; < 10 degrees spared central vision; cataract removal |
| RP3 | 57 | Female | RP; 3 degrees 20/20 spared central vision; cataract removal |
| RP4 | 51 | Female | RP; loss of peripheral vision, night blindness, and blurred vision in right eye |
| RP5 | 77 | Female | RP; loss of peripheral vision and night blindness |
| RP6 | 21 | Male | RP; beginning loss of peripheral vision and some night blindness |
| S1 | 57 | Female | Sighted with strabismus of the right eye |
| S2 | 43 | Male | Sighted |
| S3 | 51 | Female | Sighted |
| S4 | 24 | Male | Sighted |
| S5 | 30 | Male | Sighted |
Subjects S1–S5 served as sighted, gender-matched control subjects for subjects RP1–RP6.
B. MRI Scanning
Anatomical images were obtained using a T1-weighted sequence (MPRAGE) in a 3T Siemens scanner. Functional images with blood oxygenation level-dependent (BOLD) contrast were acquired using an EPI sequence with TR/TE/flip angle = 2s/25ms/60°. 36 slices with isotropic voxels of 3×3×3 mm3 were axially oriented and covered the entire cerebrum.
Subjects laid head first and supine in the scanner. Foam padding was placed around the head to minimize movement during scanning; earplugs and sound-attenuating headphones were provided to dampen scanner noise.
C. Experimental Setup and Stimuli
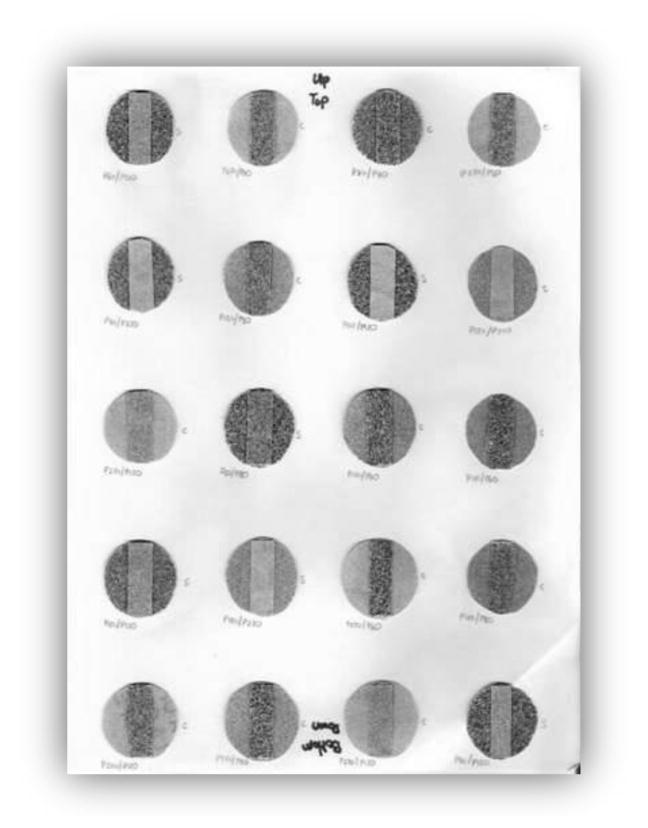
Subjects are of one of two groups: those diagnosed with retinitis pigmentosa and normally-sighted control subjects. Both groups completed the same tactile task which required individuals to determine the relative roughness between a strip of sand paper and the sandpaper disc surrounding it. Each subject was given a sheet composed of 4 columns and 5 rows of 30 mm diameter sandpaper discs spaced approximately 25 mm apart, for a total of 20 discs per sheet (Fig. 1).
Fig. 1.
Image of tactile stimuli sheet with sandpaper discs.
The sandpaper task was performed in a block design paradigm, in which individuals scanned a column during active blocks and rested their fingers in the empty space between columns during rest blocks. Subjects were given 4 seconds per disc for determining relative roughness and were instructed to either explore the tactile elements or rest between columns by a set of auditory instructions given over headphones. Subjects were asked to silently determine the relative roughness between the sandpaper strips and discs.
All subjects were asked to use their right hand and keep their eyes open while wearing an eye mask throughout the task. This eyes-open-in-darkness condition minimizes any visual cortex activity due to visual imagination [9]. All completed a training session prior to entering the scanner to ensure that the task could be completed properly.
D. Data Analysis
Image data was analyzed using the BrainVoyager QX [10]. All anatomical data underwent inhomogeneity correction and were transformed to ACPC space, while all functional data was preprocessed (via 3D motion correction, mean intensity adjustment, slice timing correction, and temporal filtering). Volumes in which a subject exhibited movement greater than 0.6 mm/degree were trimmed from the final image data set before activation maps were generated.
The BOLD signal obtained in the active blocks was contrasted with that in resting blocks to identify significantly activated voxels in a whole-brain analysis. Statistical maps of beta value were estimated using a general linear model (GLM), with head-motion parameters as covariates. Significant voxel-wise activations were identified at false discovery rates (FDR) less than 0.05. For each subject, individual functional data sets for each run were concatenated after normalization to increase the statistical power (subject RP5 was unable to complete the task correctly and so was not included in the this analysis).
Putative V1 was identified anatomically for each subject, consisting of the occipital pole and both banks of the Calcarine fissure. We calculated, for each subject, the percentage of significantly activated voxels within the V1 ROI, while the mean absolute beta value of the activated voxels within the ROI was used to quantify the amplitude of the significant positive and negative activations. These quantities were evaluated as a function of visual-field loss.
III. Results
A. V1 activation responses to tactile stimuli
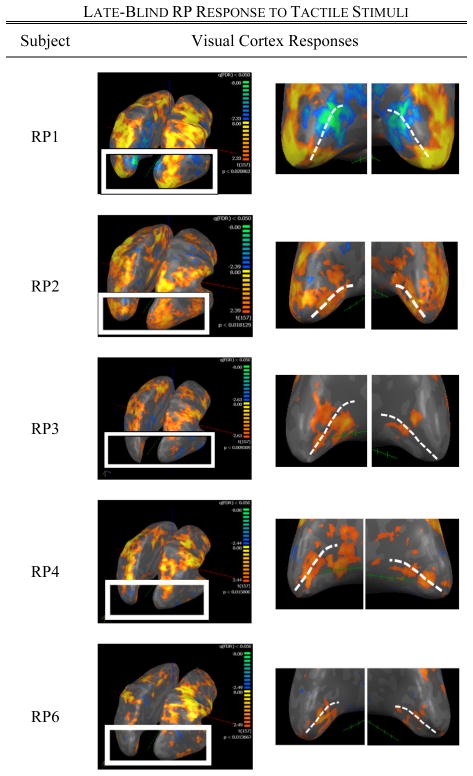
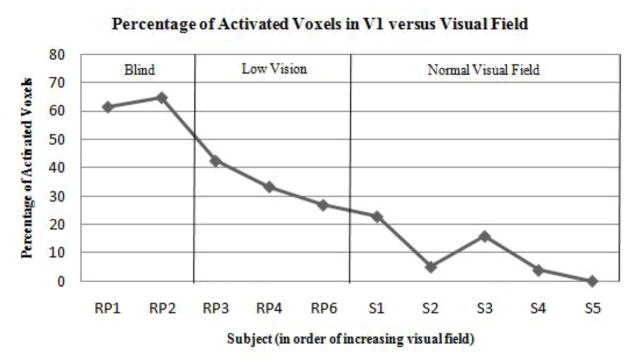
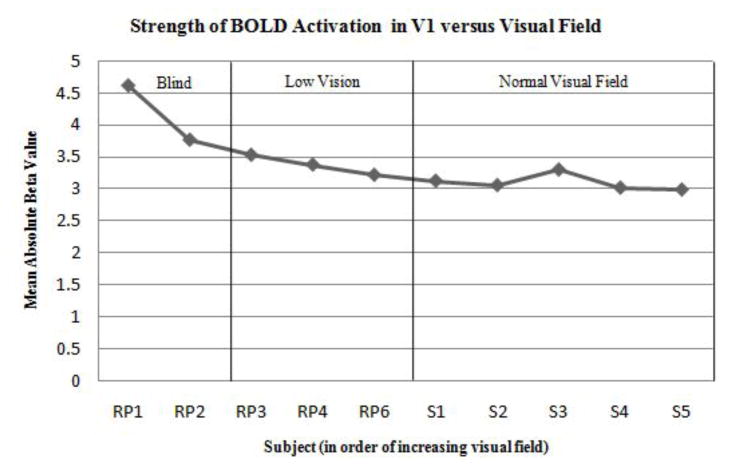
Those RP subjects with the greatest degree of vision loss exhibited the strongest visual cortex activation over the largest cortical extent in V1 to the tactile stimulation (Fig. 2). Subject RP1—an individual with only minimal light perception—experienced activation of foveal V1 and strong deactivation of peripheral V1, similar to patterns seen in sighted individuals performing a central vision task [11]. Similarly, subject RP2 (an individual with severe vision loss) exhibited a large region of activation along the calcarine sulcus. RP subjects RP3 and RP4 with a less severe tunnel vision exhibited modest activation of the occipital cortex, while subject RP6 (at a very early stage of RP) experienced activation patterns similar to some control subjects. The strength of the BOLD signal response (as quantified by the mean absolute beta value within the ROI) and percentage of activated voxels within V1 decreased with increasing visual field (Figs. 4 and 5).
Fig. 2.
BOLD responses to the sandpaper task in five late-blind RP subjects. For each subject, the image on the left illustrates activation patterns throughout an inflated representation of the whole brain, while the image on the right shows subjects’ visual cortex responses (the white dotted line represents the location of the calcarine sulcus, with its posterior end at the occipital pole).
Fig. 4.
Percentage of activated voxels in V1 (FDR < 0.05) versus visual field loss in 5 RP and 5 sighted control subjects. Subjects are ranked along the x-axis in descending order of severity of field loss. Blind subjects were those with minimal light perception and severe tunnel vision, while Low Vision subjects included those with moderate tunnel vision.
Fig. 5.
Strength of BOLD activation (mean absolute beta value) in activated V1 voxels (FDR < 0.05) versus visual field loss in 5 RP and 5 sighted control subjects. Subjects are ranked along the x-axis in descending order of severity of field loss and divided amongst three general categories.
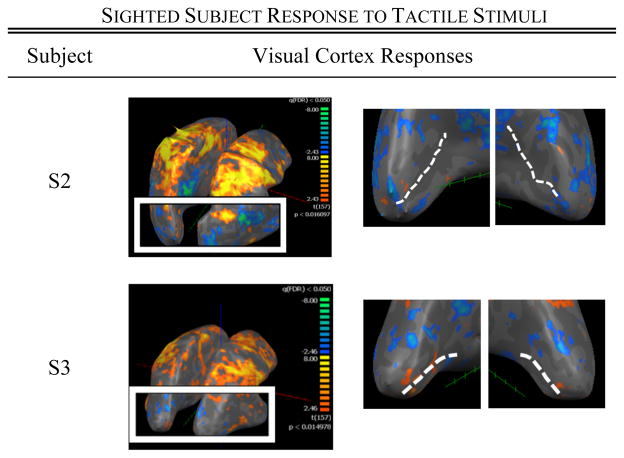
Among the five sighted control subjects, two (subjects S1 and S3) also exhibited visual cortex activation in response to the task, though the strength of this activity was weaker when compared to those RP subjects with significant vision loss (Figs. 4 and 5). Control subject S1, who experienced the greatest spatial spread of activation among the control group, had strabismus in the right eye. Subjects S2, S4, and S5 showed little-to-no activity in response to the tactile task.
B. Peripheral versus foveal activation in V1
Comparison of BOLD responses between subjects RP1, RP2, RP3, and RP4 revealed a localization of tactile-evoked activity to regions most affected by vision deprivation. Subjects RP1 and RP2 experienced severe peripheral blindness and little-to-no foveal vision, while subjects RP3 and RP4 both retained a functional amount of foveal vision. As such, subjects RP1 and RP2 exhibited a greater amount of tactile induced activity localized in the foveal region of V1 (around the occipital poles) when compared to subjects RP3 and RP4.
IV. Discussion
RP subjects with the greatest degree of vision loss (subjects RP1 and RP2) showed the strongest level of V1 activation and the greatest extent of activation in response to the tactile stimuli. In contrast, those RP subjects with the least amount of vision loss (subjects RP4 and RP6) exhibited weaker visual cortex activation in response to the task. These results suggest that vision deprivation leads to an elevated activation of the visual cortex in response to tactile stimuli, and that the degree of activation is dependent upon the extent of an individual’s vision loss. While the mechanism and function of the tactile-evoked visual cortex activity remain unclear, these findings reinforce other studies that show cross-modal activity in visual cortex for other sensory tasks when an individual is deprived of visual input [3, 12].
More importantly, our findings show that the amount of cross-model activation is related to the degree of visual field loss: subjects RP1 and RP2 had both central and peripheral blindness and experienced activation of both foveal and peripheral regions of V1 during the tactile task. Subjects RP3 and RP4 exhibited only peripheral blindness and had a greater amount of activation in the peripheral regions of V1 when compared to their foveal region.
V. Conclusion
Over a relatively large sample of subjects for this type of experiment, we found a strong correlation between degree of visual field loss and amount of activation observed in V1 that can be elicited through tactile stimulation. Both the spatial spread and the modulation amplitude of the activated voxels are increased with the severity of visual-field loss. V1 responses to tactile stimulation can thus be used as a measure of the neural consequence of vision loss; this measure can be particularly useful if the developmental time course of V1 cross-modal activation and that of the loss or recovery of visual functions can be established with future studies. The fMRI measure of cross-modal activations in the visual cortex may be used to monitor progress in individuals who have undergone vision replacement therapies.
Fig. 3.
BOLD responses to the sandpaper task in two representative sighted control subjects.
Acknowledgments
This material is based on work supported by NIH/NEI Grants R01-EY017707, the National Science Foundation under Grant No. EEC-0310723, the USC Dana and David Dornsife Cognitive Neuroscience Imaging Center, and the NSF Graduate Research Fellowship Program.
References
- 1.Amedi A, Raz N, Azulay H, Malach R, Zohary E. Cortical activity during tactile exploration of objects in blind and sighted humans. Restor Neurol Neurosci. 2010;28(2):143–156. doi: 10.3233/RNN-2010-0503. [DOI] [PubMed] [Google Scholar]
- 2.Cheung S-H, Fang F, He S, Legge GE. Retinotopically-specific reorganization of visual cortex for tactile pattern recognition. Current Biology. 2009;19:596–601. doi: 10.1016/j.cub.2009.02.063. [DOI] [PMC free article] [PubMed] [Google Scholar]
- 3.Merabet LB, Hamilton R, Schlaug G, Swisher JD, et al. Rapid and Reversible Recruitment of Early Visual Cortex for Touch. PLoS ONE. 2008;8:1–12. doi: 10.1371/journal.pone.0003046. [DOI] [PMC free article] [PubMed] [Google Scholar]
- 4.Sadato N, Pascual-Leone A, Grafman J, Ibanez V, et al. Activation of the primary visual cortex by Braille reading in blind subjects. Nature. 1996;380:526–528. doi: 10.1038/380526a0. [DOI] [PubMed] [Google Scholar]
- 5.Amedi A, Jacobson G, Malach R, Zohary E. Convergence of visual and tactile shape processing in the human lateral occipital complex. Cereb Cortex. 2002;12(11):1202–1212. doi: 10.1093/cercor/12.11.1202. [DOI] [PubMed] [Google Scholar]
- 6.Pascual-Leon A, Hamilton R. The metamodal organization of the brain. Prog Brain Res. 2001;134:427–445. doi: 10.1016/s0079-6123(01)34028-1. [DOI] [PubMed] [Google Scholar]
- 7.Smirnakis SM, Schmid MC, Weber B, Tolia As, et al. Spatial specificity of BOLD versus cerebral blood volume fMRI for mapping cortical organization. J Cereb Blood Flow Metab. 2007;27(6):1248–1261. doi: 10.1038/sj.jcbfm.9600434. [DOI] [PubMed] [Google Scholar]
- 8.Wandell BA, Smirnakis SM. Plasticity and stability of visual field maps in adult primary visual cortex. Nat Rev Neurosci. 2009;10(12):873–884. doi: 10.1038/nrn2741. [DOI] [PMC free article] [PubMed] [Google Scholar]
- 9.Marx E, Deutschlander A, Stephan T, Dieterich M, et al. Eyes open and eyes closed at rest conditions: impact on brain activation patterns. NeuroImage. 2004;21:1818–1824. doi: 10.1016/j.neuroimage.2003.12.026. [DOI] [PubMed] [Google Scholar]
- 10.Goebel R, Esposito F, Formisano E. Analysis of Functional Image Analysis Contest (FIAC) Data with BrainVoyager QX: From Single-Subject to Cortically Aligned Group General Linear Model Analysis and Self-Organizing Group Independent Component Analysis. Human Brain Mapping. 2006;27:392–401. doi: 10.1002/hbm.20249. [DOI] [PMC free article] [PubMed] [Google Scholar]
- 11.Merabet LB, Swisher JD, McMains SA, Halko MA, et al. Combined activation and deactivation of visual cortex during tactile sensory processing. Journal of Neurophysiology. 2006;97(2):1633–1641. doi: 10.1152/jn.00806.2006. [DOI] [PubMed] [Google Scholar]
- 12.Sathian K. Visual cortical activity during tactile perception in the sighted and the visually deprived. Dev Psychobiol. 2004;46:279–286. doi: 10.1002/dev.20056. [DOI] [PubMed] [Google Scholar]


