Abstract
We investigated the effect of electrode area and inter-electrode distance on the spatial distribution of the current density in transcranial direct current stimulation (tDCS). For this purpose, we used the finite element method to compute the distribution of the current density in a four layered spherical head model using various electrode montages, corresponding to a range of electrode sizes and inter-electrode distances. We found that smaller electrodes required slightly less current to achieve a constant value of the current density at a reference point on the brain surface located directly under the electrode center. Under these conditions, smaller electrodes also produced a more focal current density distribution in the brain, i.e., the magnitude of the current density fell more rapidly with distance from the reference point. The combination of two electrodes with different areas produced an asymmetric current distribution that could lead to more effective and localized neural modulation under the smaller electrode than under the larger one. Focality improved rapidly with decreasing electrode size when the larger electrode sizes were considered but the improvement was less marked for the smaller electrode sizes. Also, focality was not affected significantly by inter-electrode distance unless two large electrodes were placed close together. Increasing the inter-electrode distance resulted in decreased shunting of the current through the scalp and the CSF, and decreasing electrode area resulted in increased current density on the scalp under the edges of the electrode.
Our calculations suggest that when working with conventional electrodes (25–35 cm2), one of the electrodes should be placed just “behind” the target relative to the other electrode, for maximum current density on the target. Also electrodes with areas in the range 3.5 to 12 cm2 may provide a better compromise between focality and current density in the scalp than the traditional electrodes. Finally, the use of multiple small return electrodes may be more efficient than the use of a single large return electrode.
Keywords: tDCS, stimulation, electrode area, inter-electrode distance, focality, finite element method
1. Introduction
Transcranial direct current stimulation (tDCS) is a painless and non-invasive technique that has already shown promising results in modulating cortical excitability. This modulation is achieved by the application of an electric potential difference between electrodes located on the scalp, which creates an electric field in the brain (Nitsche and Paulus, 2000; Nitsche and Paulus, 2001). In the most commonly used configuration, one electrode is placed over the region of interest, e.g. the motor cortex, and the other is placed away from the first one, e.g. above the contralateral eyebrow. To date, all studies concerning the safety of tDCS indicate that the application of a current of 1 mA for periods up to 20 min using electrodes whose area is 25 or 35 cm2 has no significant adverse effects “Nitsche et al., 2003; Iyer et al., 2005; Poreisz et al., 2007). By 2008, more than 2000 subjects had been stimulated worldwide using a current of 1 mA without clinically relevant side effects (Nitsche et al., 2008). In addition, tDCS has shown promising results as a potential therapy for several pathologies such as stroke (Fregni et al., 2005), depression (Ferrucci et al., 2009; Fregni et al., 2006a), Parkinson’s disease (Fregni et al., 2006b), Alzheimer’s disease (Boggio et al., 2009), and epilepsy (Fregni et al., 2006c). An overview of recent tDCS experiments and methodological issues has been published recently (Nitsche et al., 2008). In addition, tDCS is a practical and affordable technique: the small and portable stimulating device is battery operated, and only two surface electrodes connected to the current stimulator are required to deliver current to the brain.
Despite the aforementioned advantages of using tDCS in clinical contexts, the spatial distribution of the current density within the human brain for a given electrode montage, the changes introduced by varying electrode area and inter-electrode distance, as well as the underlying mechanisms of action and the efficacy of this technique still remain largely unknown. Some numerical studies have already provided valuable information regarding the current density distribution. In 1968, Rush and Driscoll (Rush and Driscoll, 1968) derived an analytical expression for the electric potential in a 3 layer spherical model of the head due to two point-like electrodes on the scalp, and showed that the theoretical predictions were in good agreement with experimental measurements. More recently, other studies of the current density in the brain have been published, either with point-like electrodes (Ferdjallah et al., 1996) or with more realistic electrode and/or head models (Stecker, 2005, Miranda et al., 2006; Wagner et al., 2007; Datta et al., 2008; Datta et al., 2009; Faria et al., 2009; Miranda et al., 2009; Sadleir et al., 2010; Parazzini et al., 2011).
The implicit assumption underlying these modeling studies is that the effect of tDCS on neurons is linearly proportional to the magnitude of the current density (or electric field) in the brain, as suggested by in-vitro experiments (Bikson et al., 2004, Radman et al., 2009). However, many other factors also contribute to the final output of stimulation, ranging from the relative orientation of the neurons and the applied electric field (Rushton, 1927) to brain state dependency (Silvanto, 2008).
One aspect that is likely to become increasingly relevant in the application of tDCS is the area of the electrodes used. Nitsche and colleagues (Nitsche et al., 2007) have shown, in humans, that a reduction in electrode area and current intensity can lead to a more focal stimulation. Conversely, an increase in electrode area for a fixed current intensity, leads to a less effective stimulation. The combination of these two effects can be used to achieve a localized and intense modulatory effect under the smaller electrode and a more distributed and less intense effect under the larger one. This comes close to achieving “unifocal” stimulation, traditionally implemented with transcranial electrical stimulation using one electrode over the target region and several connected electrodes of the same size distributed around the perimeter of the head (Rossini et al., 1985). Other electrode montages employing one or more small electrodes have also been recently modeled (Datta et al., 2008; Datta et al., 2009; Faria et al., 2009).
Another relevant aspect is inter-electrode distance as it has a significant effect on the current density distribution, with closely spaced electrodes producing a more focal and more superficial distribution (Rush and Driscoll, 1969). It also affects the fraction of the injected current that reaches the brain as well as the distribution of the radial and tangential components of the current density (Datta et al., 2008). Given that the electric field has a greater effect on the cell’s polarization when the cell’s dimensions are large (Basser, 1991) and when the field is parallel to the long axis of the cell (Rushton, 1927), the radial component of the electric field is more likely to affect large (vertical) pyramidal cells on cortical gyri whereas its tangential component is more likely to target large pyramidal cells in the walls of sulci or horizontal interneurons in the gyri. The terms radial and tangential were used in the context of a spherical head model whereas the terms vertical and horizontal refer to the neuron’s orientation in the cortical sheet.
In this work we performed a systematic study of the influence of electrode area and inter-electrode distance on the spatial distribution of the current density in the brain during tDCS employing two circular electrodes placed on the scalp. We used the finite element method to implement a spherical head model with four layers representing the scalp, the skull, the cerebrospinal fluid (CSF) and the brain. The representation of the skull in the model is particularly important because its electric conductivity is much lower than that of the other tissues and as a result the current density in the brain is much weaker and more diffuse than in the scalp (Miranda et al., 2006). This blurring effect of the skull is well documented in the EEG literature (see, e.g., (Le and Gevins, 1993)). The low conductivity of the skull relative to the scalp also means that only a fraction of the current flowing between the two electrodes penetrates the skull. In a three-layer model about 45% of the injected current is shunted through the scalp (Rush and Driscoll, 1968). In a four-layer model, shunting may occur in the CSF because its conductivity is higher than that of the skull and of the brain, i.e., a significant fraction of the current that enters the cranial cavity may flow through the CSF and exit without entering the brain.
2. Methods
2.1. Spherical head model
The spherical head model proposed by Rush and Driscoll (Rush and Driscoll, 1968) was adapted in order to implement a four-layer spherical head model consisting of four homogeneous and isotropic concentric spheres. The values for the radius and electrical conductivity of the brain, CSF, skull and scalp were the following: rbrain = 7.9 cm, rCSF = 8.1 cm (Manola et al., 2005; Stok, 1987), rskull = 8.6 cm and rscalp = 9.2 cm (Nunez and Srinivasan, 2006); σbrain = σscalp 0.332 S/m (Goncalves et al., 2003), σCSF = 1.79 S/m (Baumann et al., 1997), σskull = 0.0083 S/m (Goncalves et al., 2003; Nunez and Srinivasan, 2006). Note that σbrain/σskull = 40 in this model. The use of conductivity values taken from the EEG literature was deemed appropriate since tDCS and EEG are linked by the reciprocity theorem (Rush and Driscoll, 1969).
2.2. Electrode models
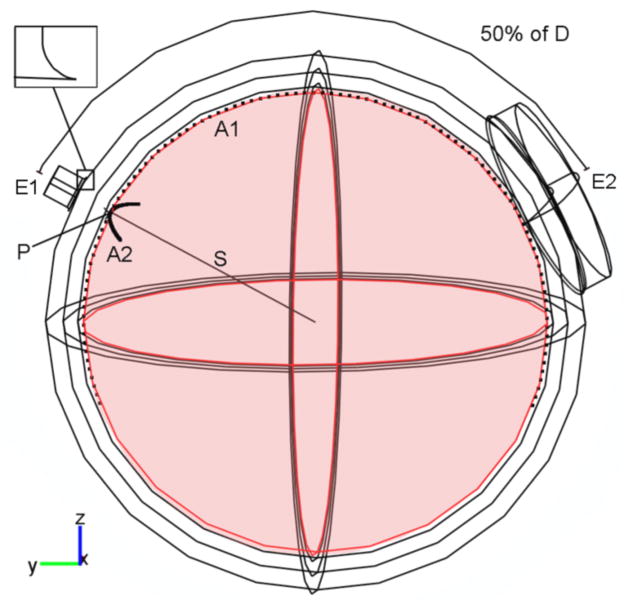
In this study we modeled circular sponge electrodes similar to the ones supplied by Amrex-Zetron, Inc (www.amrex-zetron.com). Each electrode consisted of a metal mesh held over a 1 cm thick sponge by a rubber frame. The sponge is soaked in saline solution prior to application on the scalp; its electrical conductivity was taken to be equal to that of the scalp (σ= 0.332 S/m). The metal meshes were modeled as isopotential surfaces. These electrode models are similar to those described in (Miranda et al., 2006), with the addition of a 1 mm radius fillet on the edge of the contact surface between the electrode and the scalp (inset in figure 1). This fillet provides a more realistic representation of this edge in the presence of saline solution and improves the accuracy of the numerical calculations in its vicinity. In this study, the values used for the area of the sponge in contact with the skin were 1 cm2, 3.5 cm2, 7 cm2, 12 cm2, 25 cm2 or 35 cm2.
Figure 1.
Geometry of the four-layer spherical head model when the inter-electrode distance is 50% D and the area of the electrodes is 1 cm2 for E1 and 35 cm2 for E2. In the other electrode montages considered in this study the area of electrode E1 varied between 1 cm2 and 35 cm2 whereas the area of electrode E2 was fixed at 35 cm2. The inter-electrode distance varied between 20% D and 80% D. See main text for a definition of D, S, A1, A2 and P.
2.3. Numerical Calculation
In the steady state, the divergence of the current density is equal to zero and therefore the electric potential, V, obeys ∇⃗ •(σ∇⃗V) = 0, where ∇⃗ represents the gradient operator and σ is the electrical conductivity of the volume conductor. To obtain a solution for this partial differential equation, the following boundary conditions were imposed: 1) the upper surface of each electrode was considered to be at a uniform constant electric potential and the potential difference between the two electrodes was adjusted so that the injected current had the required value, 2) the external surfaces were treated as insulated, i.e. n⃗ • J⃗ = 0, where n⃗ is the vector normal to the surface and J⃗ represents the current density; and 3) on all the inner surfaces of the model we imposed the continuity of the normal component of the current density : n⃗ • (J⃗i – J⃗i+1) =0, where i and i+1 are indexes referring to adjacent subdomains. The electric field, E⃗, was derived from the scalar potential as E⃗ = − ∇⃗ V and the current density calculated from the electric field using Ohm’s law, J⃗ = σE⃗.
Following the approach outlined above, we calculated the 3D distribution of the current density in the spherical head model for various electrode montages using a finite element software package (Comsol 3.3a, with AC/DC module, www.comsol.com). The mesh consisted of approximately 700,000 tetrahedral Lagrangian second order elements. The resulting set of equations was solved with an iterative linear solver – GMRES – which demanded the use of a preconditioner – Incomplete LU, with a drop tolerance set to 0.005. The resolution of the finite element mesh represents a compromise between accuracy and computation time. In order to ensure accurate results, the numerical solution from the finite element model was validated by comparing it to the analytical solution derived by Rush and Driscoll for point electrodes, and the maximum difference between the two solutions was 2.5% for distances from the point electrodes greater than 1 mm. Other meshes refinements and solvers were tried, without significant improvement. For finite electrodes, a mesh refinement at the edges of the electrode in contact with the scalp was performed by setting the maximum element size to 0.05 cm, to improve accuracy at these edges.
2.4. The effect of electrode area and inter-electrode distance on tDCS
In this study we investigated 6 different values for the area of one of the electrodes and 7 values for the inter-electrode distance, giving a total of 42 different electrode montages. The values considered for the area of electrode 1 (E1) were 1 cm2, 3.5 cm2, 7 cm2, 12 cm2, 25 cm2 and 35 cm2 while the area of the electrode 2 (E2) was fixed at 35 cm2. To set the distance between the two electrodes, we first measured the average distance along the scalp between the nasion and the inion in ten subjects: D = 39.6 ± 1.6 cm. We then spaced the center of the electrodes by 20%, 30%, 40%, 50%, 60%, 70% and 80% of D, which corresponds to a range of 7.9 cm to 31.7 cm, measured along an arc of a great circle. Note that D is used merely as a convenient unit for setting the range and step for inter-electrode distances in the spherical head model; it does not provide an accurate means for extrapolating the results obtained here to real heads.
Figure 1 shows the geometry of the model, with the two electrodes placed 50% of D (50% D) apart and with areas of 1 cm2 and 35 cm2, respectively. A straight radial line (S) and two arcs of great circles were drawn on the surface of the brain: S passes through the center of E1, A1 passes under the center of both electrodes and extends 20% D beyond the center of each electrode and A2, orthogonal to A1, passes under the center of E1 and its arc length is three times the diameter of this electrode. P is the target point on the surface of the brain under the center of electrode E1.
To study the focality of each electrode montage we considered the area of the surface of the brain and the brain volume in which the magnitude of the current density was within 50% of its maximum power on the brain surface, i.e., , as described in (Carbunaru and Durand, 2001). We refer to these values as the half-power area, A50, and the half-power volume, V50. They are independent of the intensity chosen for the injected current because for a given electrode montage the current density in the volume conductor is linearly proportional to the injected current.
The choice of a current density “threshold” for calculating measures of focality is somewhat arbitrary in tDCS since the effect of stimulation on the neuronal membrane varies linearly with stimulation intensity (Bikson et al., 2004). It is conceivable that the effect of stimulation at a sufficiently low intensity may not outlast the stimulus, even for long stimuli. In that case the desired after-effect would not have been achieved. Since these “threshold” conditions are not known, we opted for the half-power region.
In the traditional electrode montage E1 is placed over the hand representation in the left primary motor cortex and E2 above the contralateral eyebrow (see, for instance (Nitsche and Paulus, 2000; Nitsche and Paulus, 2001)). In this case, the centers of the two electrodes are placed roughly 19 cm apart, which corresponds approximately to an inter-electrode distance of 50% D in our study. Also, in many studies both electrodes have an area of 35 cm2 each. This montage was considered as the reference montage. When the potential difference between these two electrodes was adjusted so that the total DC current passing through them was 1 mA, the magnitude of the current density at the reference point P was calculated to be 0.073 A/m2. Since a similar electrode montage was shown to modify the excitability in the human brain (Nitsche and Paulus, 2000; Nitsche and Paulus, 2001), we considered this value as a reference current density value. In all the other electrode montages the injected current was adjusted so as to obtain the same current density at point P. The aim of this normalization procedure was to compare the spatial characteristics of the current density distribution due to the different electrode montages when the current density at the reference point was the same. This makes it easier to see how the electrode area affects the rate of decay of the current density in the brain with distance from the reference point.
We also calculated the average magnitude of the current density along the edges of the electrodes in contact with the scalp. In addition, we quantified the shunting effect of the scalp, the skull and the CSF using an expression of the form 100*(Iin−Iout)/Iin, where Iin is the current that penetrated a given layer and Iout is the current that penetrated the next inner layer.
3. Results
In this section we report some of the more representative results obtained in this study. A comprehensive description of the results for all electrode montages can be found in the supplementary material available in the on-line version of this paper, in the form of figures and tables.
3.1. The variation of the current density with depth
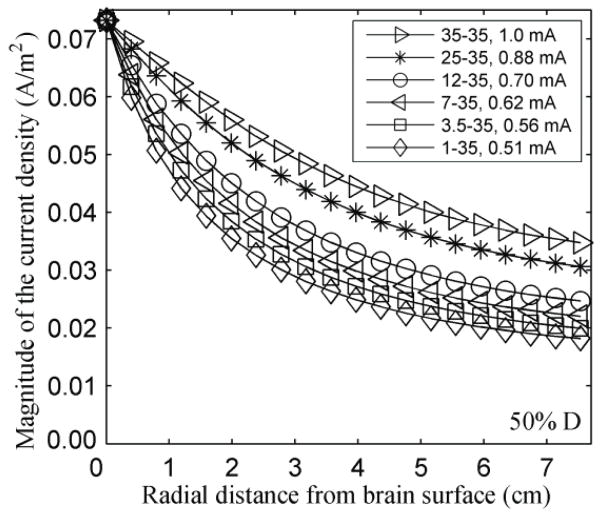
Figure 2 shows the effect of electrode area on the variation of the magnitude of the current density in the brain with depth along a straight radial line (S) passing through the center of the E1, when the inter-electrode distance is 50% D. The results show that the reference current density value (0.073 A/m2 at point P) can be attained with less injected current as the electrode area becomes smaller: as the electrode area varies from 35 cm2 to 1 cm2, the injected current decreases from 1.00 mA to 0.51 mA. However, the current required to attain the reference current density value is not linearly proportional to the electrode area. Also, the current density decreases more rapidly with depth as the electrode area diminishes. The graphs for the other inter-electrode distances showed a similar trend, with the magnitude of the current density decreasing more rapidly with depth as the inter-electrode distance decreased.
Figure 2.
Effect of decreasing electrode size on the variation of the magnitude of the current density (A/m2) with depth along the radial line S, while maintaining the current density at point P constant. The electrodes were 18.8 cm apart (50% D). The legend gives the area (cm2) of the electrodes E1-E2, and the current intensity (mA).
We also calculated the radial and the tangential components of the current density along line S for all electrode montages. As expected, the radial component was always much larger than the tangential one. For instance, when the electrodes were 50% D apart and the area of electrode E1 was 1 cm2 or 35 cm2, the radial component of the current density at a point of S placed 1 cm below the inner surface of the skull was 64% and 87% of the maximum magnitude in the brain, respectively, whereas the tangential component was 6% and 11%, respectively.
3.2. The distribution of the current density along the arc A1 that passes through both electrodes
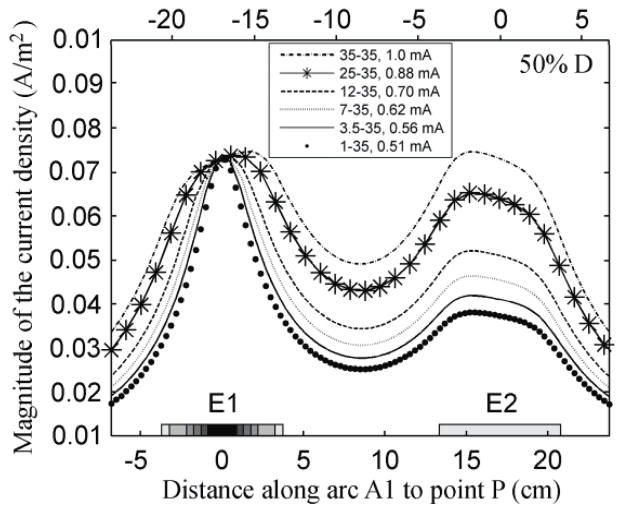
Figure 3 represents the distribution of the magnitude of the current density on the surface of the brain along A1 for different E1 areas, when the electrodes were 50% D apart. For all the electrode montages the current density along A1 decreases more rapidly with distance from the center of E1 as the area of this electrode becomes smaller. The current density maxima were located not immediately below the center of each electrode but slightly displaced in the direction of the other electrode. This effect is more apparent when the area of E1 is larger. The values of the current density at the maxima and the positions of the maxima can be found in the supplementary material.
Figure 3.
Effect of decreasing electrode size on the variation of the magnitude of the current density (A/m2) on the surface of the brain along A1, while maintaining the current density at point P constant. The electrodes were 18.8 cm apart (50% D). The shaded rectangles on the left of the horizontal axis represent the six diameters chosen for the E1 electrode.
For inter-electrode distances ranging from 30% to 80% D, the graphs obtained for the distribution of the magnitude of the current density along A1 followed the same trend as shown in figure 3, with two maxima of the current density on the brain surface. These maxima were located roughly under the center of each electrode when the electrodes were 60% to 80% of D apart. Their displacement, along A1, was more evident when the inter-electrode distance was 50% or less and it increased as the inter-electrode distance diminished.
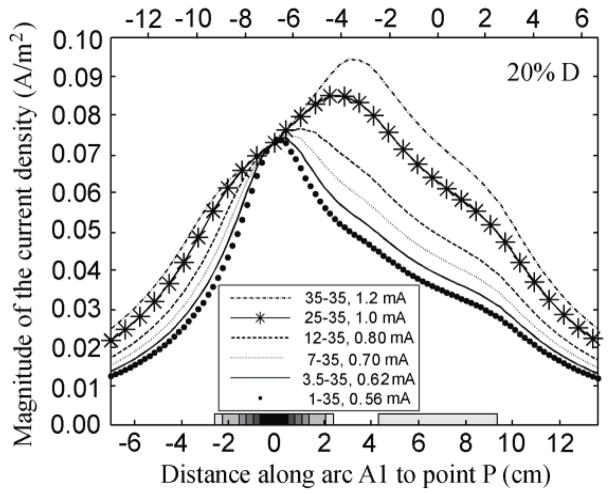
When the electrodes were 20% of D apart there was only one maximum of the current density along A1, as shown in figure 4. This maximum was located between the two electrodes, but it moved along A1 in the direction of E1, as the area of E1 become smaller.
Figure 4.
Effect of decreasing electrode size on the variation of the magnitude of the current density (A/m2) on the surface of the brain along A1, while maintaining the current density at point P constant. The electrode centers were 7.9 cm apart (20% D).
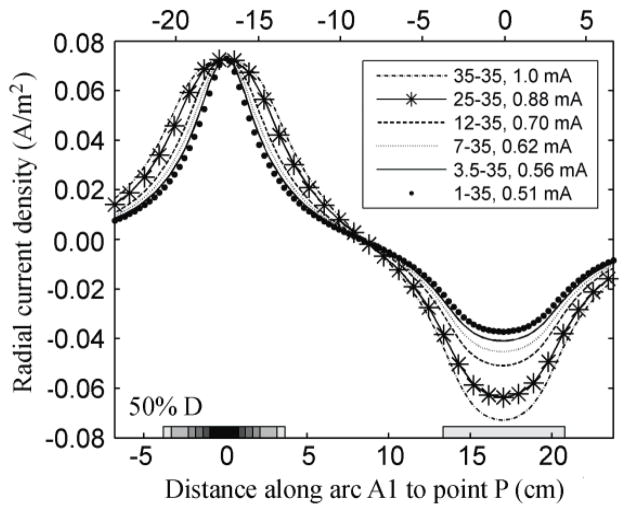
The radial component of the current density along A1 peaked under both electrodes and was zero near the center of A1, as can be seen in figure 5 for the case where the electrodes were 50% D apart. The absolute value of the radial component of the current density decreased more rapidly with distance from the electrode center as the electrode area became smaller. For all electrode montages considered the radial component followed the same trend.
Figure 5.
Effect of decreasing electrode size on the variation of the radial component of the current density (A/m2) on the surface of the brain along A1, while maintaining the current density at point P constant. The electrodes were 18.8 cm apart (50% D).
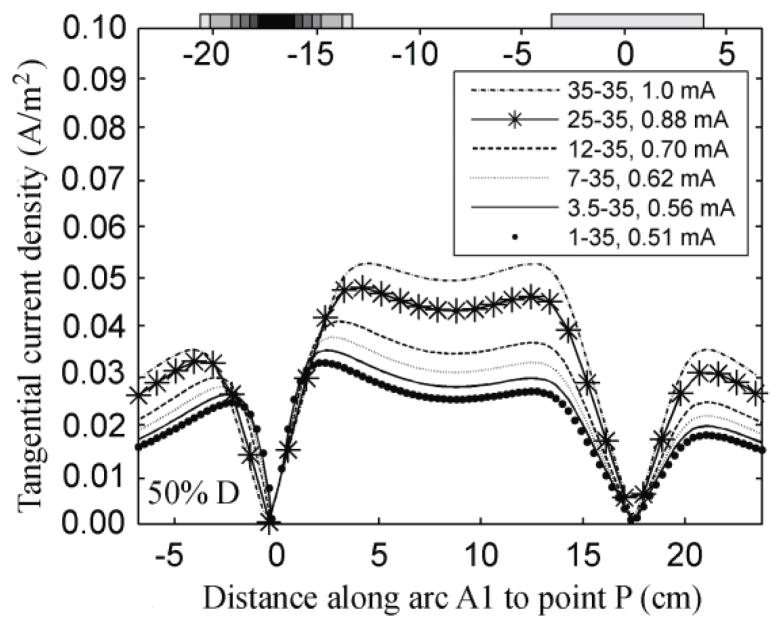
The variation of the tangential component along A1 when the inter-electrode distance was 50% of D is shown in figure 6. This component was zero under both electrodes and increased with distance from the center of the electrodes. Away from the electrodes, this component increased as the area of electrode E1 increased. When the inter-electrode distance was higher than 40% of D, the variation of the tangential component distribution along A1 followed the same trend as shown in figure 6, with a local minimum at the center of A1 surrounded by two maxima that became more evident as the inter-electrode distance increased. When the electrodes were 20% and 30% of D apart, the distribution of this component showed a different trend, as the previous maxima overlapped creating a local maximum halfway between the two electrodes.
Figure 6.
Effect of decreasing electrode size on the variation of the tangential component of the current density (A/m2) on the surface of the brain along A1, while maintaining the current density at point P constant. The electrodes were separated by 18.8 cm (50% D).
3.3. The distribution of the current density along an arc A2 that passes below the center of the E1 and is orthogonal to A1
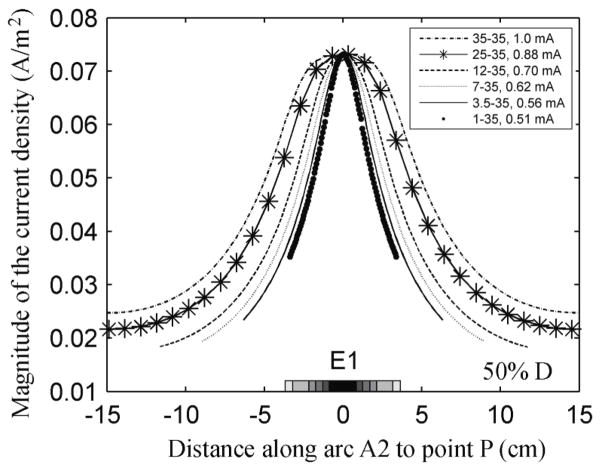
Figure 7 shows the effect of decreasing electrode size on the distribution of the magnitude of the current density (A/m2) along A2, when the inter-electrode distance was 50% D. Due to the symmetry of the geometry, the maximum value of the current density along arc A2 is always located under the center of E1. The width of the current density curve decreased monotonically with electrode size. The graphs obtained for all other inter-electrode distances showed a similar trend. As the inter-electrode distance decreased, the magnitude of the current density decreased more rapidly with the distance to the center of the electrode. The radial and the tangential components followed the same trend for all the electrode montages. The former peaked under E1 and decreased rapidly with distance from the center of this electrode at a rate that increased as the electrode area decreased. The latter had a minimum under the center of E1 and two symmetric peaks on either side of the minimum. The value at the maxima increased as the E1 area increased.
Figure 7.
Effect of decreasing electrode size on the variation of the magnitude of the current density (A/m2) on the surface of the brain along A2, while maintaining the current density at point P constant. The electrodes were separated by 18.8 cm (50% D).
3.4. Comparison of the focality of tDCS at the surface of the brain
The total area of the brain surface in which the magnitude of the current density was within 50% of its maximum power on the brain surface, A50, was calculated for all electrode montages and the results are shown in figure 8. For all the inter-electrode distances considered, A50 decreased as the E1 area decreased. For inter-electrode distances greater than 50% D or when the area of E1 was less than or equal to 7 cm2, A50 remained approximately independent of inter-electrode distance. For the 25 and 35 cm2 electrodes, a small increase in A50 was observed for an inter-electrode distance of 40% D, followed a larger decrease for shorter inter-electrode distances. For a given inter-electrode distance, A50 does not decrease linearly as the electrode area decreases from 35 to 1 cm2. For example, for inter-electrode distances greater than or equal to 50% D, A50 decreases rapidly as electrode area decreases from 35 to 12 cm2 but decreases slowly as electrode area decreases from 12 to 1 cm2.
Figure 8.
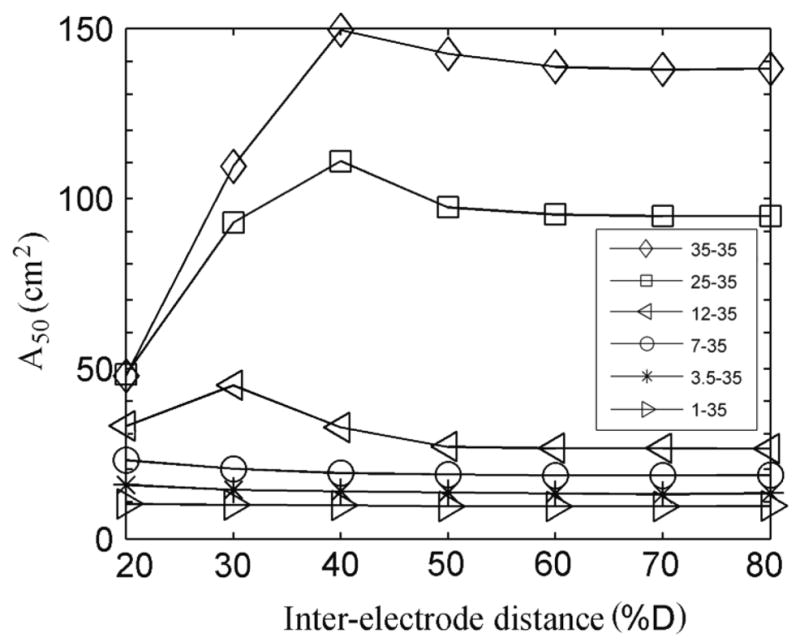
Area of the surface of the brain (cm2) in which the magnitude of the current density is within 50% of its maximum power at the surface of the brain (A50).
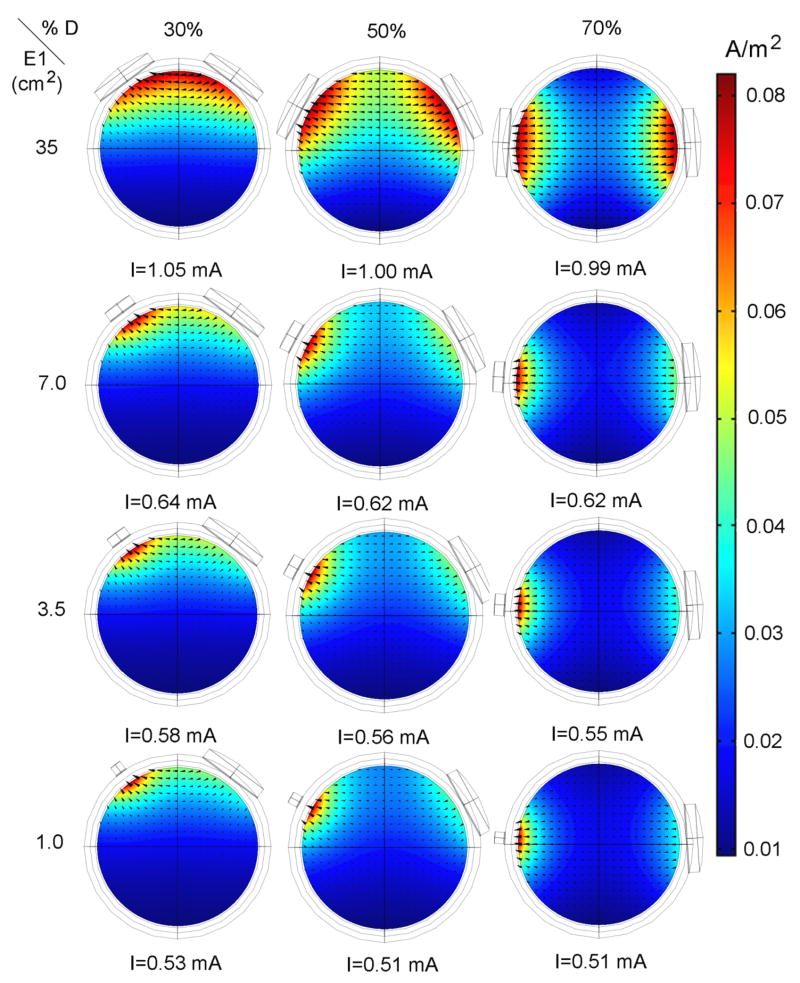
The total area A50 was made up of one or two separate regions, depending on the area of electrode E1 and on the inter-electrode distance. This can be seen in figure 9, which illustrates the magnitude and the direction of the current density in the brain in a plane that passes through the center of the sphere and the centers of the two electrodes. When the two electrodes are far apart and have similar areas, A50 is made up of two separate regions, one under each electrode as shown in the top right corner of the figure. If the two electrodes are close together and have similar sizes, A50 is made up of a single region located under both electrodes, as shown in the top left corner of figure 9. In particular, when the inter-electrode distance was 40% D, the two regions merged into one when the E1 area was higher than or equal to 25 cm2 and consequently A50 increased (figure 8). Finally, if one of the electrodes is sufficiently smaller than the other one, A50 is made up of a single region located under the smaller electrode, as shown in the bottom three rows of the figure.
Figure 9.
Magnitude (color scale) and direction (arrows) of the current density in the brain when the inter-electrode distance is 30%, 50% and 70% of D and the area of E1 is 1 cm2, 3.5 cm2, 7 cm2 and 35 cm2. Rows show the effect of inter-electrode distance whereas columns display the effect of electrode area. The legend under each graph gives the current intensity required to maintain the current density at point P constant.
The variation of the volume of the brain in which the magnitude of the current density was within 50% of its maximum power in the brain, V50, was similar to that obtained in the area study.
3.5. The current density on the edge of the electrodes in contact with the scalp
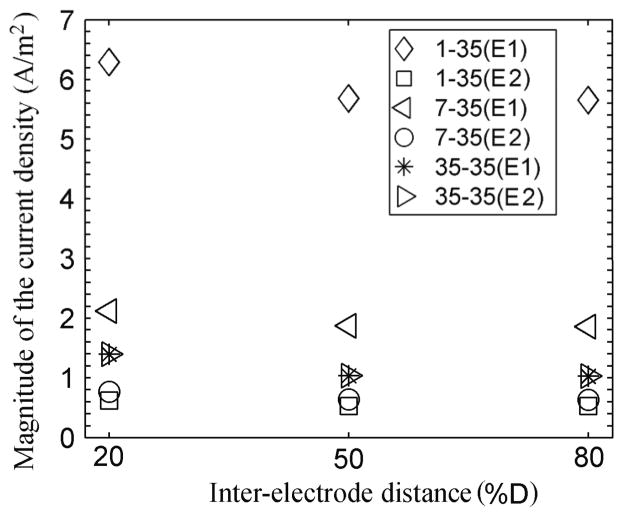
The average magnitude of the current density along the edge of the electrodes in contact with the scalp varied little with the inter-electrode distance but changed significantly as the E1 area decreased. Figure 10 shows the results obtained when the inter-electrode distance was 20%, 50% and 80% of D and the area of E1 was equal to 1 cm2, 7 cm2 and 35 cm2. For all inter-electrode distances, the current density on the edge of electrode E1 increased considerably as its area decreased, despite the reduction in current intensity to ensure a constant current density at the reference point P. The average current density on the edge of E2 decreased slightly as the area of E1 decreased. As the area of E1 increased towards 35 cm2, the magnitude of the current density on the edges of both electrodes became equal. These calculations indicate that the current density on the edge of E1 in contact with the scalp may be up to a factor of six larger when its area is 1 cm2 than when it is 35 cm2, for all the inter-electrode distances.
Figure 10.
Average magnitude of the current density on the edges of the electrodes in contact with the scalp when the electrodes are 20%, 50% and 80% of D apart and the area of E1 is 1 cm2, 7 cm2 and 35 cm2.
3.6. The shunting effect of the skull and the CSF
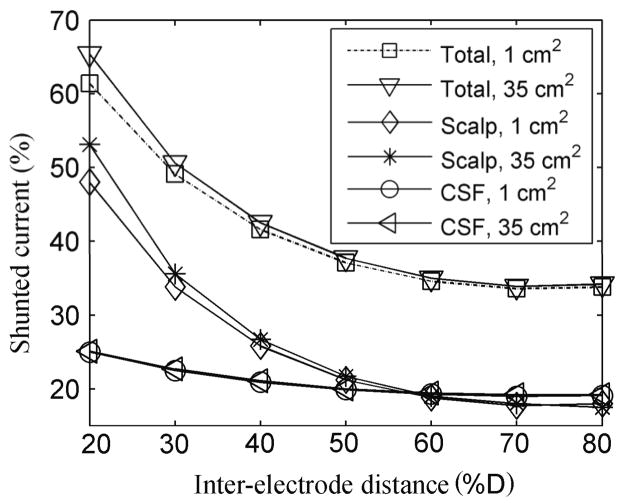
The percentages of the injected current that entered the skull, the CSF and the brain were obtained for all the electrode montages. These values were used to calculate the percentage of the current that was shunted through the scalp, the skull and the CSF, as well as by the 3 layers together (total). This percentage varied little with E1 area but increased rapidly as the inter-electrode distance decreased below 50 % D (about 19 cm) as can be seen in figure 11. As expected, the shunting effect of the skull was negligible in this model, <1.5%, and is not shown. For inter-electrode distances shorter than 50% D, more current is shunted through the scalp than through the CSF whereas for inter-electrode distances greater than 50% D the two tissues have similar shunting effects.
Figure 11.
Percentage of the current shunted by the scalp, the CSF and by the three outer tissues (including skull) when the E1 area was 1 cm2 and 35 cm2.
4. Discussion
The results presented in this paper illustrate the effect that electrode area and inter-electrode distance may have on the current density distribution during tDCS. The results also apply to transcranial AC stimulation (tACS) inasmuch as the quasistatic approximation holds (Roth et al., 1991).
For all montages, the injected current was adjusted so as to maintain the magnitude of the current density at the reference point in the brain constant. Since the current density is linearly proportional to the injected current, all current density plots in this paper can be scaled appropriately to obtain current density values for other current intensities. In future work, a physiological more meaningful alternative would be to adjust the current intensity so that the average current density in a predefined brain region is kept constant for all montages.
We found that when the area of one of the electrodes is reduced below the 25–35 cm2 often used in tDCS there is a significant decrease in the extent of the region where the magnitude of the current density reaches a significant fraction of its peak value, both in depth and on the brain surface (figure 2 and figure 3). This is corroborated by the values of the half-power areas, A50, shown in figure 8, for inter-electrode distances greater than about 12 cm (30% D). The same figures also indicate that once the area of the smaller electrode is less than 12 cm2 then further reductions in electrode area lead to diminishing improvements in focality. This effect is due to the low conductivity of the skull.
The increase in focality in the brain achieved by smaller electrodes is accompanied by an increase in the current density in the scalp, even after adjusting the current intensity to obtain the reference current density value at the reference point. Under the edge of the electrode in contact with the scalp, the current density may be as high as 6 A/m2 for a 1 cm2 electrode compared to about 2 A/m2 for a 7 cm2 electrode and 1 A/m2 for a 35 cm2 electrode (figure 10). It is therefore essential to minimize electrode-scalp impedance using the usual EEG techniques of scalp preparation and impedance monitoring, when using small electrodes. In addition, adverse effects on the skin can be minimized by appropriate choices of electrode material and gel (Minhas, 2010).
High current densities on the scalp may render tDCS intolerable or may make sham stimulation (Gandiga, 2006) impracticable. Given that smaller electrodes produce more focal distribution at the cost of increasing current density on the scalp, in the manner shown in figures 8 and 10, there should exist an optimal electrode size that maximizes focality and minimizes scalp current density, i.e., minimizes the product of A50 and the current density on the edges of the electrode. In our modeling study, for an inter-electrode distance of about 19 cm (50% D) and with the injected current adjusted as explained before, this product exhibits a broad minimum between 3.5 and 12 cm2. Electrodes with sizes in this range may be useful in applications where a more focal stimulation is important. For example, a 3.5 cm2 electrode and a current intensity of 0.1 mA have been used to selectively modulate the cortical excitability of the representation of the abductor digiti minimi without affecting the first dorsal interosseus (Nitsche et al., 2007).
The current intensities presented in figure 2 confirm that smaller electrodes require less injected current to achieve a given current density on the brain under the electrode. However, the required current intensity is not proportional to electrode area, which implies that stimulus intensity does not scale as the ratio of the current intensity and the electrode area (Miranda et al., 2009). Given the lack of a simple rule, how should the current intensity be set for different electrode areas? The current intensities in figure 2 could be taken as initial estimates. However, these estimates could also be verified experimentally by quantifying a physiological aftereffect, such as the change in magnitude of the motor evoked potential.
The last 3 rows of figure 9 show that when the area of the smaller electrode drops below 12 cm2, and the area of the larger electrode is fixed at 35 cm2, the current density distribution has a single half-power region located under the smaller electrode. Thus, a mixed electrode montage, using two electrodes with different areas, should help to increase the focality of cortical stimulation in the sense that it allows a decrease in the stimulated region under the smaller electrode as well as a significant reduction of the functional effects of the stimulation under the larger one, as suggested by Nitsche et al. (Nitsche et al., 2007).
The ratio of the maximal current densities under E1 and E2 increases from 1:1 in the standard montage (two 35 cm2 electrodes) to 1.9:1 when the area of E1 is reduced to 1 cm2, independently of the current intensity. This is a modest increase considering that the ratio of electrode areas increased from 1:1 to 35:1. Slightly higher ratios can be obtained by increasing the area of the largest electrode but this may become difficult to handle. A more efficient way is to replace the larger electrode by n electrodes of the same size as the smaller one and which are all connected to the same terminal of the stimulator. Some calculations have already been performed with multiple return electrodes (Datta et al., 2009; Faria et al., 2009). Provided that the n electrodes are well separated on the scalp and approximately equidistant from E1, this should increase the current density ratio to about n:1.
Both electrode area and inter-electrode distance influence the position of the maximum of the current density magnitude in the brain. As the electrode area increases, the maximum shifts from under the center of the electrode towards the other electrode. Although the shift can be large, up to several centimeters, the difference between the magnitude of the current density under the center of the electrode and its maximum value remains small, in relative terms, when the electrodes are far apart (figure 3). When these electrodes are close together, i.e., when their centers are less than 8 cm (20% D) apart, the maximum can be located between the two electrodes (figure 4). Our results suggest that when using large electrodes, 25 to 35 cm2, the current density in the target region may be increased slightly by placing the electrode’s front edge (the edge closer to the other electrode) over the target region, instead of placing its center over the target region as is currently done.
The high conductivity of the scalp relative to that of the skull and the high conductivity of the CSF relative to those of the skull and the brain constrain a significant percentage of the injected current to flow tangentially in these tissues and never reach the brain. Even so, at least 35% of the injected current may reach the brain if the electrodes are 8 cm (20% D) apart and 60% or more for inter-electrode distances greater than 20 cm (50% D). The current shunted through the scalp and the CSF is unlikely to be harmful but if too much current is shunted through the scalp then stimulation may become less well tolerated.
The use of a spherical head model enabled us to investigate the effect of electrode size and inter-electrode distance on the current density distribution, independently of detailed anatomical information. Even though the more general features of this distribution, such as the non-linear variation of A50 with electrode area, are likely to remain valid when considering a more realistic head model, it is also clear that significant differences may arise. This is due to the heterogeneity of the brain tissues and the convoluted nature of the cortical sheet, which, in combination, have a complex effect on the current density distribution. Thus, the location of current density peaks in a realistic head model will be determined by the local cortical geometry as well as the size and the position of the electrodes on the scalp. Also, our model does not include the various openings that exist in the skull and which may affect the current density in the nearby cortex (Paulus, 2010; Schutter and Hortensius, 2010). In addition, the analysis of focality was based on the distribution of the magnitude of the current density, and does not take into account the relative orientation of the current density and the neuronal cells. Some information on this issue may be gathered from the plots of the radial and tangential components of the current density, such as those shown in figures 5 and 6, if the orientation of the target cells in the brain is known. All these limitations should be addressed using more realistic, albeit more demanding, head models featuring accurate representations of the grey and white matter surfaces. Even so, knowledge of the predictions of the spherical head model will be important for a critical appreciation of the more complicated results obtained with a realistic head model.
Despite the above-mentioned limitations, the results presented in this paper indicate clearly that small electrodes can stimulate the cortical surface efficiently and focally. This suggest the implementation of a versatile multi-electrode system based on small electrodes that could be used to target different brain regions, simultaneously or sequentially, by choosing appropriate combinations of two or more electrodes (see, for example, Dmochowski, 2011). Such a system could be based on the use of EEG electrodes and an EEG cap, to place the electrodes in standard positions, such as those defined in the 10/10 International System (Faria et al., 2009). Each electrode could be used either to inject current or to record an EEG signal. Large tDCS electrodes could be simulated by linking together several neighboring electrodes. Electrode impedance could be easily monitored and the EEG gel could provide a uniform and stable electrical contact. Such a combined tDCS and EEG system could be used to monitor the effect of the stimulation on the brain’s activity during or immediately after tDCS.
Supplementary Material
Acknowledgments
This work was supported in part by the NIH Intramural Program, EUA, by the Foundation for Science and Technology (FCT), Portugal and by project HIVE. The project HIVE acknowledges the financial support of the Future and Emerging Technologies (FET) programme within the Seventh Framework Programme for Research of the European Commission, FET-Open grant #222079. Paula Faria gratefully acknowledges the support of FCT under Grant SFRH/BD/29020/2006 and of Polytechnic Institute of Leiria, Portugal.
Footnotes
Subject classification numbers: PACS
87.50.-a Effects of electromagnetic and acoustic fields on biological systems; 87.50.C-Static and low-frequency electric and magnetic fields effects; Poisson and Laplace equations, boundary-value problems; 87.85.eg Electrode stimulation; 47.11.Fg Finite element methods; 87.85.-d Biomedical engineering.
References
- Basser PJ, Roth BJ. Stimulation of a myelinated nerve axon by electromagnetic induction. Med Biol Eng Comput. 1991;29:261–8. doi: 10.1007/BF02446708. [DOI] [PubMed] [Google Scholar]
- Baumann SB, Wozny DR, Kelly SK, Meno FM. The electrical conductivity of human cerebrospinal fluid at body temperature. IEEE Trans Biomed Eng. 1997;44:220–3. doi: 10.1109/10.554770. [DOI] [PubMed] [Google Scholar]
- Bikson M, Inoue M, Akiyama H, Deans KJ, Fox EJ, Miyakawa H, Jefferys RGJ. Effects of uniform extracellular DC electric fields on excitability in rat hippocampal slices in vitro. J Physiol. 2004;557.1:175–90. doi: 10.1113/jphysiol.2003.055772. [DOI] [PMC free article] [PubMed] [Google Scholar]
- Boggio PS, Khoury LP, Martins DCS, Martins OEMS, Macedo EC, Fregni F. Temporal cortex direct current stimulation enhances performance on a visual recognition memory task in Alzheimer disease. J Neurol Neurosurg Psychiatry. 2009;80:444–7. doi: 10.1136/jnnp.2007.141853. [DOI] [PubMed] [Google Scholar]
- Carbunaru R, Durand DM. Toroidal coil models for transcutaneous magnetic stimulation of nerves. IEEE Trans Biomed Eng. 2001;48:434–41. doi: 10.1109/10.915709. [DOI] [PubMed] [Google Scholar]
- Datta A, Elwassif M, Battaglia F, Bikson M. Transcranial current stimulation focality using disc and ring electrode configurations: FEM analysis. J Neural Eng. 2008;5:163–74. doi: 10.1088/1741-2560/5/2/007. [DOI] [PubMed] [Google Scholar]
- Datta A, Bansal V, Diaz J, Patel J, Reato D, Bikson M. Gyri-precise head model of transcranial DC stimulation: Improved spatial focality using a ring electrode versus conventional rectangular pad. Brain Stimulation. 2009;2(4):201–7. doi: 10.1016/j.brs.2009.03.005. [DOI] [PMC free article] [PubMed] [Google Scholar]
- Dmochowski JP, Bikson M, Datta A, Yuzhuo Su, Parra LC. A multiple electrode scheme for optimal non-invasive electrical stimulation. Proc IEEE EMBS Neural Eng. 2011:29–35. [Google Scholar]
- Faria P, Leal A, Miranda PC. Comparing different electrode configurations using the 10-10 international system in tDCS: a finite element model analysis. Conf Proc IEEE Eng Med Biol Soc. 2009:1596–9. doi: 10.1109/IEMBS.2009.5334121. [DOI] [PubMed] [Google Scholar]
- Ferdjallah M, Bostick FX, Jr, Barr RE. Potential and current density distributions of cranial electrotherapy stimulation (CES) in a four-concentric-spheres model. IEEE Trans Biomed Eng. 1996;43:939–43. doi: 10.1109/10.532128. [DOI] [PubMed] [Google Scholar]
- Ferrucci R, Bortolomasi M, Vergari M, Tadini L, Salvoro B, Giacopuzzi M, Barbieri S, Priori A. Transcranial direct current stimulation in severe, drug-resistant major depression. J Affect Disord. 2009;118:215–9. doi: 10.1016/j.jad.2009.02.015. [DOI] [PubMed] [Google Scholar]
- Fregni F, Boggio PS, Mansur CG, Wagner T, Ferreira MJ, Lima MC, Rigonatti SP, Marcolin MA, Freedman SD, Nitsche MA, Pascual-Leone A. Transcranial direct current stimulation of the unaffected hemisphere in stroke patients. Neuroreport. 2005;16:1551–5. doi: 10.1097/01.wnr.0000177010.44602.5e. [DOI] [PubMed] [Google Scholar]
- Fregni F, Boggio PS, Nitsche MA, Marcolin MA, Rigonatti SP, Pascual-Leone A. Treatment of major depression with transcranial direct current stimulation. Bipolar Disord. 2006a;8:203–4. doi: 10.1111/j.1399-5618.2006.00291.x. [DOI] [PubMed] [Google Scholar]
- Fregni F, Boggio PS, Santos MC, Lima M, Vieira AL, Rigonatti SP, Silva MT, Barbosa ER, Nitsche MA, Pascual-Leone A. Noninvasive cortical stimulation with transcranial direct current stimulation in Parkinson’s disease. Mov Disord. 2006b;21:1693–702. doi: 10.1002/mds.21012. [DOI] [PubMed] [Google Scholar]
- Fregni F, Thome-Souza S, Nitsche MA, Freedman SD, Valente KD, Pascual-Leone A. A controlled clinical trial of cathodal DC polarization in patients with refractory epilepsy. Epilepsia. 2006c;47:335–42. doi: 10.1111/j.1528-1167.2006.00426.x. [DOI] [PubMed] [Google Scholar]
- Gandiga PC, Hummel FC, Cohen LG. Transcranial DC stimulation (tDCS): a tool for double-blind sham-controlled clinical studies in brain stimulation. Clin Neurophysiol. 2006;117:845–50. doi: 10.1016/j.clinph.2005.12.003. [DOI] [PubMed] [Google Scholar]
- Goncalves SI, de Munck JC, Verbunt JP, Bijma F, Heethaar RM, Lopes da Silva F. In vivo measurement of the brain and skull resistivities using an EIT-based method and realistic models for the head. IEEE Trans Biomed Eng. 2003;50:754–67. doi: 10.1109/tbme.2003.812164. [DOI] [PubMed] [Google Scholar]
- Iyer MB, Mattu U, Grafman J, Lomarev M, Sato S, Wassermann EM. Safety and cognitive effect of frontal DC brain polarization in healthy individuals. Neurology. 2005;64:872–5. doi: 10.1212/01.WNL.0000152986.07469.E9. [DOI] [PubMed] [Google Scholar]
- Le J, Gevins A. Method to reduce blur distortion from EEG’s using a realistic head model. IEEE Trans Biomed Eng. 1993;40:517–28. doi: 10.1109/10.237671. [DOI] [PubMed] [Google Scholar]
- Manola L, Roelofsen BH, Holsheimer J, Marani E, Geelen J. Modelling motor cortex stimulation for chronic pain control: electrical potential field, activating functions and responses of simple nerve fibre models. Med Biol Eng Comput. 2005;43:335–43. doi: 10.1007/BF02345810. [DOI] [PubMed] [Google Scholar]
- Minhas P, Bansal V, Patel J, Ho JS, Diaz J, Datta A, Bikson M. Electrodes for high-definition transcutaneous DC stimulation for applications in drug delivery and electrotherapy, including tDCS. J Neurosci Methods. 2010;190:188–97. doi: 10.1016/j.jneumeth.2010.05.007. [DOI] [PMC free article] [PubMed] [Google Scholar]
- Miranda PC, Faria P, Hallett M. What does the ratio of injected current to electrode area tell us about current density in the brain during tDCS? Clin Neurophysiol. 2009;120:1183–7. doi: 10.1016/j.clinph.2009.03.023. [DOI] [PMC free article] [PubMed] [Google Scholar]
- Miranda PC, Lomarev M, Hallett M. Modeling the current distribution during transcranial direct current stimulation. Clin Neurophysiol. 2006;117:1623–9. doi: 10.1016/j.clinph.2006.04.009. [DOI] [PubMed] [Google Scholar]
- Nitsche MA, Cohen LG, Wassermann EM, Priori A, Lang N, Antal A, Paulus W, Hummel F, Boggio P, Fregni F, Pascual-Leone A. Transcranial direct current stimulation: State of the art 2008. Brain Stimulation. 2008;1:206–23. doi: 10.1016/j.brs.2008.06.004. [DOI] [PubMed] [Google Scholar]
- Nitsche MA, Doemkes S, Karakose T, Antal A, Liebetanz D, Lang N, Tergau F, Paulus W. Shaping the effects of transcranial direct current stimulation of the human motor cortex. J Neurophysiol. 2007;97:3109–17. doi: 10.1152/jn.01312.2006. [DOI] [PubMed] [Google Scholar]
- Nitsche MA, Liebetanz D, Lang N, Antal A, Tergau F, Paulus W. Safety criteria for transcranial direct current stimulation (tDCS) in humans (letters to the editor) Clin Neurophysiol. 2003;114:2220–2. doi: 10.1016/s1388-2457(03)00235-9. [DOI] [PubMed] [Google Scholar]
- Nitsche MA, Paulus W. Excitability changes induced in the human motor cortex by weak transcranial direct current stimulation. J Physiol. 2000;527:633–9. doi: 10.1111/j.1469-7793.2000.t01-1-00633.x. [DOI] [PMC free article] [PubMed] [Google Scholar]
- Nitsche MA, Paulus W. Sustained excitability elevations induced by transcranial DC motor cortex stimulation in humans. Neurology. 2001;57:1899–901. doi: 10.1212/wnl.57.10.1899. [DOI] [PubMed] [Google Scholar]
- Nunez PL, Srinivasan R. Electric Fields of the Brain - The Neurophysics of EEG. 2. Oxford University Press; New York: 2006. pp. 251–2. [Google Scholar]
- Paulus W. On the difficulties of separating retinal from cortical origins of phosphenes when using transcranial alternating current stimulation (tACS) Clin Neurophysiol. 2010;121:987–91. doi: 10.1016/j.clinph.2010.01.029. [DOI] [PubMed] [Google Scholar]
- Parazzini M, Fiocchi S, Rossi E, Paglialonga A, Ravazzani P. Transcranial direct current stimulation: estimation of the electric field and of the current density in an anatomical human head model. IEEE Trans Biomed Eng. 2011;58:1773–80. doi: 10.1109/TBME.2011.2116019. [DOI] [PubMed] [Google Scholar]
- Poreisz C, Boros K, Antal A, Paulus W. Safety aspects of transcranial direct current stimulation concerning healthy subjects and patients. Brain Res Bull. 2007;72:208–14. doi: 10.1016/j.brainresbull.2007.01.004. [DOI] [PubMed] [Google Scholar]
- Radman T, Ramos RL, Brumberg JC, Bickson M. Role of cortical cell type and morphology in subthreshold and suprathreshold uniform electric field stimulation in vitro. Brain Stim. 2009;2:215–27. doi: 10.1016/j.brs.2009.03.007. [DOI] [PMC free article] [PubMed] [Google Scholar]
- Rossini PM, Marciani MG, Caramia M, Roma V, Zarola F. Nervous propagation along ‘central’ motor pathways in intact man: characteristics of motor responses to ‘bifocal’ and ‘unifocal’ spine and scalp non-invasive stimulation. Electroencephalogr Clin Neurophysiol. 1985;61:272–86. doi: 10.1016/0013-4694(85)91094-6. [DOI] [PubMed] [Google Scholar]
- Roth JB, Saypol MJ, Hallett M, Cohen GL. A theoretical calculation of the electric field induces in the cortex during magnetic stimulation. Elect Clin Neurophysiol. 1991;81(1):47–56. doi: 10.1016/0168-5597(91)90103-5. [DOI] [PubMed] [Google Scholar]
- Rush S, Driscoll D. Current distribution in the brain from surface electrodes. Anesth Analg. 1968;47:717–23. [PubMed] [Google Scholar]
- Rush S, Driscoll D. EEG electrode sensitivity--an application of reciprocity. IEEE Trans Biomed Eng. 1969;16:15–22. doi: 10.1109/tbme.1969.4502598. [DOI] [PubMed] [Google Scholar]
- Rushton WA. The effect upon the threshold for nervous excitation of the length of nerve exposed, and the angle between current and nerve. J Physiol. 1927;63:357–77. doi: 10.1113/jphysiol.1927.sp002409. [DOI] [PMC free article] [PubMed] [Google Scholar]
- Sadleir RJ, Vannorsdall TD, Schretlen DJ, Gordon B. Transcranial direct current stimulation (tDCS) in a realistic head model. NeuroImage. 2010;51(4):1310–8. doi: 10.1016/j.neuroimage.2010.03.052. [DOI] [PubMed] [Google Scholar]
- Schutter DJ, Hortensius R. Retinal origin of phosphenes to transcranial alternating current stimulation. Clin Neurophysiol. 2010;121:1080–4. doi: 10.1016/j.clinph.2009.10.038. [DOI] [PubMed] [Google Scholar]
- Silvanto J, Muggleton N, Walsh V. State-dependency in brain stimulation studies of perception and cognition. Trends Cogn Sci. 2008;12:447–54. doi: 10.1016/j.tics.2008.09.004. [DOI] [PubMed] [Google Scholar]
- Stecker MM. Transcranial electric stimulation of motor pathways: a theoretical analysis. Comput Biol Med. 2005;35:133–55. doi: 10.1016/j.compbiomed.2003.12.005. [DOI] [PubMed] [Google Scholar]
- Stok CJ. The influence of model parameters on EEG/MEG single dipole source estimation. IEEE Trans Biomed Eng. 1987;34:289–96. doi: 10.1109/tbme.1987.326090. [DOI] [PubMed] [Google Scholar]
- Wagner T, Fregni F, Fecteau S, Grodzinsky A, Zahn M, Pascual-Leone A. Transcranial direct current stimulation: a computer-based human model study. NeuroImage. 2007;35:1113–24. doi: 10.1016/j.neuroimage.2007.01.027. [DOI] [PubMed] [Google Scholar]
Associated Data
This section collects any data citations, data availability statements, or supplementary materials included in this article.


