

Abstract
Objectives
To evaluate independent associations of high density lipoprotein cholesterol (HDL-C) and particle (HDL-P) concentrations with carotid intima-media thickness (cIMT) and incident coronary heart disease (CHD).
Background
HDL-C is inversely related to CHD, but also to triglycerides, LDL particles (LDL-P), and related metabolic risk. HDL-P associations with CHD may be partially independent of these factors.
Methods
In a multi-ethnic study of 5598 men and women ages 45-84, without baseline CHD, excluding subjects on lipid-lowering medications, triglycerides >400 mg/dl or missing values, we evaluated associations of HDL-C and NMR-spectroscopy-measured HDL-P with cIMT and incident CHD (myocardial infarction, CHD death, angina, n=227 events, 6.0 years mean follow-up). All models were adjusted for age, sex, ethnicity, hypertension and smoking.
Results
HDL-C and HDL-P correlated with each other (π=0.69) and LDL-P (π = −0.38, −0.25, respectively), p<0.05 for all. For (1-SD) higher HDL-C (15 mg/dl) or HDL-P (6.64 μmol/l), cIMT differences (95%CI) were −26.1(−34.7,−17.4) and −30.1 (−38.8,−21.4) μm, and CHD hazard ratios (HR (95%CI)) were 0.74 (0.63, 0.88) and 0.70 (0.59, 0.82), respectively. Adjusted for each other and LDL-P, HDL-C was no longer associated with cIMT (2.3 (−9.5, 14.2) μm) or CHD (0.97(0.77, 1.22)), but HDL-P remained independently associated with cIMT (−22.2(−33.8,−10.6) μm) and CHD (0.75 (0.61, 0.93)). Interactions by sex, ethnicity, diabetes and high-sensitivity C-reactive protein were not significant.
Conclusions
Adjusting for each other and LDL-P substantially attenuated associations of HDL-C, but not HDL-P, with cIMT and CHD. Potential confounding by related lipids or lipoproteins should be carefully considered when evaluating HDL-related risk.
Keywords: Lipids, lipoproteins, high-density lipoprotein cholesterol, high-density lipoprotein particles, cardiovascular disease
Introduction
There is great interest in raising levels of high-density lipoprotein cholesterol (HDL-C), given its well-established inverse association with atherosclerosis and coronary heart disease (CHD).(1) However, quantification of HDL-C, the cholesterol carried by HDL particles, may not fully capture HDL-related risk.(1,2) For example, some forms of genetically low,(3) or genetically high, HDL-C(4) do not correspond to expected differences in CHD risk. Recent failures of drugs that raised HDL-C without reducing cardiovascular (CVD) events (5,6) or atherosclerosis(7) have also fueled interest in alternative indices of HDL quantity, i.e., HDL particles (HDL-P) or apolipoprotein A-I (apoA-I), or possibly HDL “quality,” i.e., particle size, subclass distribution,(8) or various measures of HDL functionality.(2)
The association of HDL-C with CHD risk is complicated by the inverse association of HDL-C with triglycerides, insulin resistance, obesity, high-sensitivity c-reactive protein (hsCRP), and atherogenic lipoprotein particles, i.e., apolipoprotein B (apoB) and LDL particle concentration (LDL-P).(1) Recent reports showed that adjusting for apoB and apoA-I abolished the inverse association of HDL-C with CHD risk,(9) but HDL-P remained inversely associated with CHD, adjusted for apoB, triglycerides, and HDL particle size.(10) Therefore, we hypothesized that HDL-C associations with carotid intima-media thickness (cIMT) and incident CHD events partly reflect correlated lipid, apolipoprotein or lipoprotein concentrations, particularly LDL-P, but that HDL-P associations are less affected by these metabolic risk factors, including HDL-C. Since HDL functionality has been reported to be altered in diabetes, (11,12), with inflammation,(13), by ethnicity(14), or sex,(15) we also evaluated potential interactions by baseline diabetes, hsCRP, sex and ethnicity.
Methods
Participants and Risk Factor Measurement
Participants eligible for the current study were 6814 men and women enrolled at baseline (2000-2002) in the NHLBI-sponsored multi-center community-based cohort, MESA, the design and objectives of which have been described.(16) Briefly, MESA participants were community-dwelling men and women ages 45-84, of African-American, Hispanic, White, and Chinese-American ethnicity. Baseline exclusion criteria included self-reported CVD (heart attack, angina, coronary or any other arterial revascularization procedure, pacemaker or defibrillator implantation, valve replacement, heart failure or cerebrovascular disease), pregnancy, cancer, cognitive impairment, or weight >136 kg. The current study excluded participants with baseline lipid-lowering medication use (n=1100), triglycerides >400 mg/dl (n=57), or missing values for lipid-lowering medication use, HDL-C, HDL-P, or smoking (n=59). Of the remaining 5598 participants, cIMT was missing for 57 (1.0%) and incident CHD data was missing for 1, leaving 5541 for the cIMT analyses and 5597 for the CHD analyses. Participants provided informed written consent at their field centers. The study was approved by the institutional review boards of the participating institutions and the University of Pittsburgh.
Height, weight, blood pressure, and medications were collected at the baseline MESA examination. Smoking was defined as never, former (smoked ≥100 cigarettes in lifetime) or current (smoked cigarettes in last 30 days). Hypertension was defined as systolic blood pressure ≥ 140 mmHg, or diastolic blood pressure ≥ 90 mmHg, or self-reported hypertension and anti-hypertensive medication use. Hormone therapy use was defined as current user (yes/no.) Type 2 diabetes was defined as fasting glucose >125 mg/dL or use of anti-diabetic medication. HOMA-IR (homeostasis model assessment of insulin resistance) was calculated as insulin (μIU/L) × (glucose [mg/dL] × 0.055)/22.5,(17) for those not on anti-diabetic medication.
Lipid, Lipoprotein and other Laboratory Assays
Blood was drawn following a 12 hour fast, and samples were stored at −70 degrees C. Lipids, insulin and glucose were measured at a central laboratory (Collaborative Studies Clinical Laboratory at Fairview-University Medical Center, Minneapolis, MN). Lipids were assayed on thawed EDTA plasma within 2 weeks of the sample collection, using CDC/NHLBI standards. HDL-C was measured using the cholesterol oxidase method (Roche Diagnostics) after precipitation of non-HDL-C with magnesium/dextran (coefficient of variation (CV) = 2.9%)). LDL-C was calculated using the Friedewald equation.(18) Plasma lipoprotein particle concentrations were measured at LipoScience, Inc. (Raleigh, N.C.) by NMR spectroscopy using the LipoProfile-3 algorithm. HDL-P and LDL-P (CVs<4%) are the sums of the particle concentrations of their respective subclasses, which are quantified based on particle size using the amplitudes of their lipid methyl group NMR signals, and mean particle sizes are the weighted average of related subclasses.(19)
Endpoints
Carotid atherosclerosis was measured using high-resolution B-mode ultrasound as previously described for the Cardiovascular Health Study.(20) CIMT was calculated from maximal thickness measured at 8 sites (right and left, near and far walls of the common and internal carotid arteries), as previously described.(21) Incident CHD events (myocardial infarction, CHD death, resuscitated cardiac arrest, or definite or probable angina (followed by revascularization)) were ascertained and adjudicated for MESA as previously described.(22) Hypotheses were also tested using secondary endpoints of 1) “hard” CHD, which excluded angina, 2) “all CVD”, which was “all CHD” plus stroke, stroke death, other atherosclerotic death or other CVD death, and 3) “hard” CVD, which included “hard CHD” plus stroke and stroke death, and finally, 4) cIMT considered separately for the common vs. the internal (more susceptible to plaque) carotid artery.
Statistical Analysis
Analyses were performed using SAS 9.2 (SAS Institute, Cary, NC). Two-tailed p values <0.05 were considered significant. Spearman-rank correlations were adjusted for age, sex, and ethnicity. HDL-C and HDL-P were analyzed as continuous variables (results reported per 1 standard deviation (1-SD) increment) or categorized as tertiles or quartiles. Triglycerides were log-transformed. Associations with cIMT were modeled using analysis of covariance and linear regression, and with incident CHD events using Cox proportional hazards regression. All models were adjusted for a base set of covariates: age, sex, ethnicity, hypertension and smoking. P for linear trend was calculated using contrasts. Hypothesized differences by sex, ethnicity, diabetes and hsCRP were tested by including interaction terms with HDL-C and HDL-P for each of the models, with the main effect included in the model. Sensitivity analyses included excluding hormone therapy users (n=837), stratifying by sex, and also testing hypotheses using secondary endpoints described above, i.e., “hard” CHD, “all CVD”, “hard” CVD, internal carotid artery (ICA) cIMT and common carotid artery (CCA) cIMT.
To illustrate multivariable regression results, a stratified analysis was used to calculate adjusted mean cIMT for HDL-C tertiles within HDL-P tertiles, and then further stratified by above/below median LDL-P. Tertiles (HDL-C and HDL-P) were used rather than quartiles, to allow for a sufficient number of individuals in discordant cells (i.e., high HDL-C/low HDL-P or low HDL-C/high HDL-P). Finally, we sought to replicate a report of an increased risk of CHD for very high HDL-C ( ≥ 80 mg/dl) relative to low HDL-C (<40 mg/dl) in adjusted models,(9) and also evaluated CHD risk for very high vs. low HDL-P, using the corresponding 95th and 25th percentiles of HDL-P (≥45.7 and <29 μmol/l).
Results
Study participants were multi-ethnic men and women ages 45-84 from MESA, without baseline clinical CVD or lipid-lowering medication use (Table1). HDL-C and HDL-P concentrations were positively correlated (Fig 1). HDL-C and HDL-P were inversely correlated with LDL-C, weakly, (ρ= −0.08, −0.13, respectively), and LDL-P, more strongly, (ρ= −0.38, −0.25) and with other metabolic risk factors (e.g., small LDL-P, triglycerides, BMI, waist circumference, and HOMA-IR), but for all, correlations were stronger for HDL-C than for HDL-P (Table 2).
Table 1.
Characteristics of MESA Participants in Study (n=5598), 2000-2002
| Characteristic | Mean(SD) or % |
|---|---|
| Age, years | 61.5(10.3) |
| Women, % | 52.9 |
| Ethnicity, % | |
| White | 37.6 |
| Chinese-American | 12.1 |
| African- American | 27.7 |
| Hispanic | 22.7 |
| Body Mass Index, kg/m2 | 28.2(5.5) |
| Waist Circumference, cm | 97.6 (14.4) |
| Smoker, % | |
| Current | 13.5 |
| Former | 36.0 |
| Hypertension, % | 41.3 |
| Diabetes, % | 10.7 |
| Carotid Intima-Media thickness, μm | 946 (339) |
| Lipids, mg/dL | |
| HDL-C | 51.2 (15) |
| LDL-C | 119.6 (31.3) |
| Total Cholesterol | 195.8 (34.6) |
| Triglycerides | 124.5 (64.8) |
| Lipoprotein Particle Concentrations | |
| HDL-P, μmol/L | |
| Total | 33.8 (6.6) |
| Large | 6.1 (3.5) |
| Medium | 13.4 (6.8) |
| Small | 14.3 (5.6) |
| LDL-P, nmol/L | |
| Total | 1261 (342) |
| Large | 607 (253) |
| Small | 524 (381) |
| IDL-P | 130.5(98.5) |
| Lipoprotein Particle Size(nm) | |
| LDL | 20.8 (0.6) |
| HDL | 9.3 (0.5) |
Values are mean (SD) or n, %. Abbreviations: HDL: High density lipoprotein, HDL-C: HDL cholesterol, HDL-P: HDL particles, IDL-P: intermediate density lipoprotein particles LDL: Low density lipoprotein, LDL-C: LDL cholesterol, LDL-P: LDL particles.
Figure 1.
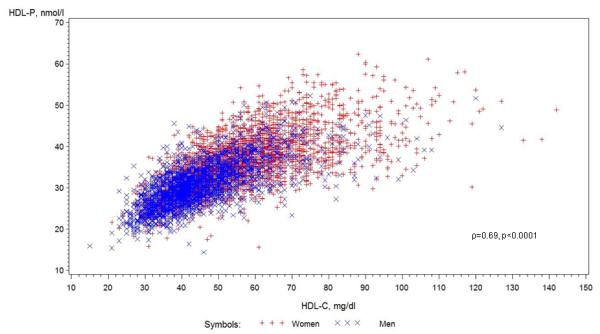
Scatterplot of HDL-C with HDL-P
All results except Fig 1 are adjusted for base covariates (base cov.): age, sex, ethnicity, hypertension, and smoking. Error bars are standard errors; p values are for linear trend.
Table 2.
Spearman correlations of the concentrations of HDL cholesterol (HDL-C) and HDL particles (HDL-P) among MESA participants in study (n=5598), 2000-2002
| HDL-C | HDL-P | |
|---|---|---|
| Mean HDL particle size, nm | 0.68 | 0.34 |
| LDL-C, mg/dl | −0.08 | −0.13 |
| Triglycerides, mg/dl | −0.48 | −0.09 |
| Total Cholesterol, mg/dl | 0.14 | 0.12 |
| Large HDL-P, μmol/L | 0.87 | 0.53 |
| Medium HDL-P, μmol/L | 0.45 | 0.58 |
| Small HDL-P, μmol/L | −0.28 | 0.07 |
| Mean LDL Particle Size, nm | 0.69 | 0.32 |
| LDL-P, nmol/L | −0.38 | −0.25 |
| Large LDL-P, nmol/L | 0.53 | 0.22 |
| Small LDL-P, nmol/L | −0.69 | −0.38 |
| Body Mass Index, kg/m2 | −0.26 | −0.12 |
| Waist Circumference, cm | −0.27 | −0.12 |
| HOMA-IR* | −0.38 | −0.16 |
| C-reactive protein, mg/L | −0.15 | −0.05 |
All correlations (Spearman-rank) are adjusted for age, sex, ethnicity and all are statistically significant (p<0.0001)
calculated for participants reporting no anti-diabetic medication (n=5157)
Abbreviations: HDL: High density lipoprotein, HDL-C: HDL cholesterol, HDL-P: HDL particles, HOMA-IR: Homeostasis model of insulin resistance, LDL: Low density lipoprotein, LDL-C: LDL cholesterol, LDL-P: LDL particles.
LDL-C and LDL-P
Positive associations of LDL-C and LDL-P with cIMT and CVD events in MESA have been published(21,23) and when LDL-P and LDL-C differ, associations are stronger for LDL-P(23). In our study, adjusted for base covariates, the cIMT difference (95%CI) per 1-SD increment was 28.8(13.4, 44.3) μm for LDL-C, and 36.5 (20.8, 52.1) μm for LDL-P. The HR (95%CI) for CHD per 1-SD increment was 1.24 (1.09, 1.42) for LDL-C and 1.29 (1.13, 1.47) for LDL-P, adjusted for base covariates. LDL-C and LDL-P each remained associated (p<0.05) with cIMT and incident CHD in the models reported below that also adjusted for HDL-P, HDL-C or both.
Associations with Carotid Atherosclerosis
Adjusted for base covariates (age, sex, ethnicity, hypertension and smoking) mean cIMT was lower with higher quartiles of HDL-C (Figure 2, Panel A) or HDL-P (Figure 2, Panel B). The inverse linear association between HDL-C and cIMT was attenuated by adjusting for LDL-P or for HDL-P, and was abolished when adjusted for both. In contrast, HDL-P remained inversely associated with cIMT after adjusting for LDL-P, HDL-C, or both (p for trend <0.05 for all).
Figure 2.
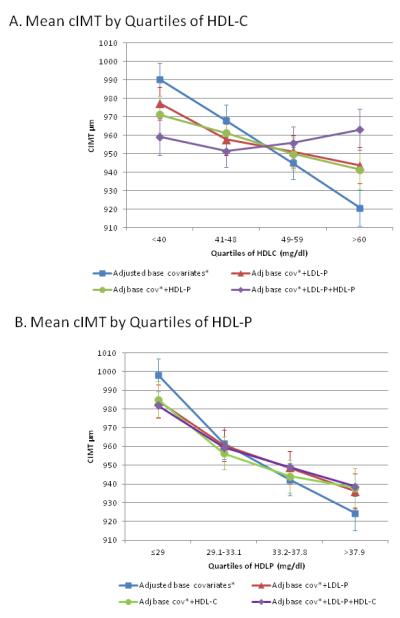
Mean cIMT (μm) across quartiles of HDL-C or HDL-P, before and after adjusting for LDL-P and each other (n=5541).
A. Mean cIMT (μm) across HDL-C quartiles, adjusted for base covariates, p <0.001; adjusted for base covariates plus LDL-P, p=0.01; adjusted for base covariates plus HDL-P, p=0.051, and adjusted for base covariates plus LDL-P and HDL-P, p=0.75.
B. Mean cIMT (μm) across HDL-P quartiles; adjusted for base covariates, p <0.0001; adjusted for base covariates plus LDL-P, p=0.0001; adjusted for base covariates plus HDL-C, p=0.002; adjusted for base covariates plus LDL-P and HDL-C, p<0.001
All results except Fig 1 are adjusted for base covariates (base cov.): age, sex, ethnicity, hypertension, and smoking. Error bars are standard errors; p values are for linear trend.
Additional models are shown in Table 3, which reports adjusted mean cIMT difference for a 1-SD increment in HDL-C or HDL-P. Separately, higher HDL-C and HDL-P were each associated with lower mean cIMT, and were modestly attenuated by adjusting for LDL-C or HDL particle size. However, adjusting for LDL-P substantially attenuated cIMT estimates, more for HDL-C (12.2 (−21.4,−3.1) μm), than for HDL-P (−20.7 (−29.6, −11.8) μm). Further adjustment for LDL-C and triglycerides had little effect.
Table 3.
Predicted difference in carotid intima-media thickness (μm) for a 1 standard deviation (SD) greater HDL cholesterol (HDL-C) or HDL particle (HDL-P) concentration among MESA participants (n=5541), 2000-2002
| Difference (95%CI) in cIMT (μm) | ||
|---|---|---|
|
HDL-C and HDL-P in separate
models, covariates |
HDL-C (SD=15 mg/dl) |
HDL-P (SD= 6.64 μmol/l) |
| Basic Model* | −26.1 (−34.7, −17.4) | −30.1 (−38.8, −21.4) |
| plus LDL-C | −22.7(−31.4,−14.1) | −25.5(−34.2,−16.7) |
| plus HDL size | −19.3 (−31.2, −7.4) | −25.5 (−34.6, −16.3) |
| plus LDL-P | −12.2 (−21.4, −3.1) | −20.7 (−29.6, −11.8) |
| plus LDL-P, LDL-C and (log) TG | −13.9 (−23.9,−3.9) | −21.6 (−30.5,−12.7) |
|
Joint models† of HDL-C, HDL-P,
covariates |
HDL-C
(SD=15 mg/dl) |
HDL-P
(SD= 6.64 μmol/l) |
| Basic Model | −11.1 (−22.7, 0.42) | −22.7 (−34.3, −11.0) |
| plus LDL-C | −10.9 (−22.4, 0.6) | −18.2 (−29.8, −6.5) |
| plus HDL size | 4.9 (−11.0 20.8) | −27.9 (−40.1, −15.8) |
| plus LDL-P | 2.3 (−9.5, 14.2) | −22.2 (−33.8, −10.6) |
| plus LDL-P, LDL-C and (log) TG | 5.7 (−8.2, 19.7) | −25.2 (−37.6, −12.8) |
Basic model and all substantial models are adjusted for: age, sex, ethnicity, hypertension, and smoking.
Joint models report estimates with HDL-C and HDL-P together in the same model.
Abbreviations: HDL: High density lipoprotein, HDL-C: HDL cholesterol, HDL-P: HDL particles, LDL: Low density lipoprotein, LDL-C: LDL cholesterol, LDL-P: LDL particles, TG: Triglycerides
In joint models, (HDL-C and HDL-P adjusted for each other and base covariates; Table 3 lower panel), HDL-C and HDL-P associations were only mildly attenuated by adjusting for LDL-C. However, adjusted for HDL-P, HDL-C was no longer significantly associated with cIMT (−11.1 (−22.7, 0.42) μm, and became positive, but not statistically significant, in models that also adjusted for mean HDL size or LDL-P, with or without LDL-C and triglycerides. Conversely, HDL-P remained inversely associated with cIMT (−22.2 (−33.8, −10.6) μm) when adjusted for HDL-C, and also for LDL-P, or HDL size, or LDL-P, LDL-C and triglycerides.
To visualize the multivariable model results, Figure 3 shows adjusted mean cIMT for cross-classified tertiles of HDL-C and HDL-P (Fig 3: A), and further stratified by median LDL-P (Fig 3: B, C). Power is limited for these analyses due to small numbers in the discordant groups, e.g., high HDL-C/low HDL-P. Within HDL-P tertiles, HDL-C was generally not inversely associated with cIMT (p HDL-C trend= not significant for all) (Fig 3: A), but within HDL-C tertiles, HDL-P was inversely associated with cIMT in both low and high HDL-C tertiles (p trend <0.05 for both). When further stratified by median LDL-P (Fig 3: B, C), trends were generally not statistically significant, but HDL-C was positively associated with cIMT within 5 of the 6 HDL-P tertiles, whereas HDL-P remained inversely associated with cIMT within 5 of the 6 HDL-C tertiles.
Figure 3.


Mean cIMT (μm) by joint tertiles of HDL-C and HDL-P, entire group, and stratified by median LDL-P (1236.5 nmol/l). All models adjusted for base covariates.
HDL-C tertiles (mg/dl): low HDL-C (≤42), medium HDL-C (43-54), high HDL-C: (≥55.) HDL-P tertiles (μmol/l): low HDL-P (≤30.5), medium HDL-P (30.6-36.1), high HDL-P: (≥30.6).
A. Entire study sample.
P for HDL-C trend within each HDL-P tertile= not significant.
P for HDL-P trend <0.05 for both low and high HDL-C tertiles, not significant for medium HDL-C tertiles. B. Participants with LDL-P below the median.
P for HDL-C trend within each HDL-P tertile: not significant.
P for HDL-P trend within HDL-C tertile= 0.06, 0.09, 0.02 for low, medium and high HDL-C tertiles, respectively.
C. Participants with LDL-P above the median.
Neither HDL-C trends within each HDL-P tertile, nor HDL-P trends within each HDL-C tertile were significant.
All results except Fig 1 are adjusted for base covariates (base cov.): age, sex, ethnicity, hypertension, and smoking. Error bars are standard errors; p values are for linear trend.
Sensitivity Analyses for cIMT Associations
Interaction terms for sex, ethnicity, diabetes status, or hsCRP were not significant. In sex-stratified models, adjusted for LDL-P and each other, HDL-C was not inversely associated with cIMT for women: −1.2 (−15.0, 12.7) μm, or men: 8.3 (−13.4, 30.1) μm, whereas HDL-P was significantly inversely associated with cIMT for women: −17.8 (−31.4, −4.2) μm, and men: −27.1 (−47.7, −6.4) μm. Evaluated separately, the internal and common carotid artery showed similar results to our combined cIMT measure, although associations were slightly stronger for the internal carotid artery, which is more prone to plaque.
Associations with Incident Coronary Heart Disease Events
Among the 5597 participants with incident CHD data, 227 CHD events occurred during mean(SD) =6.0(1.4) years follow-up. The proportionality assumption appeared valid, i.e., interactions of time with HDL-C or HDL-P were not significant. CHD risk is reported for quartiles and for a 1-SD increment in HDL-C and HDL-P, for separate and joint models (Table 4). Separately, higher HDL-C and HDL-P were similarly associated with lower CHD risk, adjusted for base covariates. Adjusting for LDL-C or HDL particle size had little effect. Adjustment for LDL-P attenuated the association for HDL-C to a greater extent than for HDL-P. In joint models (adjusted for HDL-P), HDL-C HRs were not statistically significant and became weakly positive when adjusted for LDL-P, LDL-C, and (log) triglycerides. In contrast, HDL-P’s inverse association with CHD remained statistically significant when adjusted for HDL-C, LDL-P, LDL-C, and triglycerides.
Table 4.
Risk of incident CHD across higher HDL-C and HDL-P quartiles and for 1-SD increment among MESA participants (n=5597), baseline 2000-2002
| Hazard Ratio (95%CI) by HDL-C Quartile: range, mg/dl | HR(95% CI) for 1 SD* HDL-C |
|||||
|---|---|---|---|---|---|---|
| Q1:15- 40 |
Q2: 41-48 | Q3: 49-59 | Q4: 60-142 | P trend | ||
| Basic Model | 1.0 | 0.67 (0.48, 0.94) | 0.56 (0.38, 0.81) | 0.45 (0.29, 0.69) | <0.0001 | 0.74 (0.63, 0.88) |
| plus LDL-C | 1.0 | 0.64 (0.46,0.89) | 0.53 (0.37, 0.77) | 0.45 (0.29, 0.70) | <0.0001 | 0.74 (0.62, 0.88) |
| plus HDL size | 1.0 | 0.67 (0.48,0.94) | 0.55 (0.37, 0.83) | 0.44 (0.25,0.76) | 0.0002 | 0.74 (0.60, 0.92) |
| plus LDL-P | 1.0 | 0.67 (0.48, 0.94) | 0.61 (0.42, 0.89) | 0.53 (0.34, 0.84) | 0.002 | 0.80 (0.67, 0.95) |
| plus HDL-P | 1.0 | 0.77 (0.54, 1.09) | 0.71 (0.47, 1.09) | 0.67 (0.39, 1.16) | 0.10 | 0.92 (0.74, 1.14) |
| plus HDL-P+LDL-P | 1.0 | 0.76 (0.54, 1.08) | 0.77 (0.50, 1.18) | 0.77 (0.44, 1.36) | 0.25 | 0.97 (0.77, 1.22) |
| plus HDL-P, LDL-P, LDL-C,TG | 1.0 | 0.83 (0.57,1.20) | 0.85 (0.52,1.40) | 0.92 (0.48,1.77) | 0.69 | 1.12 (0.86, 1.46) |
|
| ||||||
| Hazard Ratio (95%CI) by HDL-P Quartile (range, μmol/l) | HR(95% CI) for 1 SD* HDL-P |
|||||
| Q1:14. 4-29 |
Q2: 29.1-33.1 | Q3: 33.2-37.8 | Q4: 37.9-62.4 | P trend | ||
|
| ||||||
| Basic Model | 1.0 | 0.79 (0.57, 1.08) | 0.49 (0.33, 0.73) | 0.46 (0.30, 0.71) | <0.0001 | 0.70 (0.59, 0.82) |
| plus LDL-C | 1.0 | 0.81 (0.59, 1.12) | 0.50 (0.34, 0.75) | 0.49 (0.31, 0.75) | <0.0001 | 0.71 (0.60, 0.84) |
| plus HDL size | 1.0 | 0.81 (0.59,1.12) | 0.52 (0.35,0.77) | 0.49 (0.31,0.77) | 0.0007 | 0.74 (0.62, 0.87) |
| plus LDL-P | 1.0 | 0.84 (0.61, 1.16) | 0.55 (0.37, 0.81) | 0.52 (0.33, 0.82) | 0.0006 | 0.74 (0.63, 0.87) |
| plus HDL-C | 1.0 | 0.84 (0.60,1.16) | 0.55 (0.36, 0.85) | 0.56 (0.33, 0.97) | 0.009 | 0.74 (0.60, 0.92) |
| plus HDL-C+LDL-P | 1.0 | 0.89 (0.64, 1.23) | 0.59 (0.38, 0.91) | 0.57 (0.33, 0.98) | 0.015 | 0.75 (0.61, 0.93) |
| plus HDL-C, LDL-P, LDL-C,TG | 1.0 | 0.82 (0.58, 1.14) | 0.52 (0.34, 0.81) | 0.49 (0.27, 0.86) | 0.003 | 0.68 (0.54, 0.85) |
Basic model and all substantial models are adjusted for: age, sex, ethnicity, hypertension, and smoking.
1 SD = 15 mg/dl for HDL-C, and 6.64 μmol/l for HDL-P.
Abbreviations: HDL: High density lipoprotein, LDL-C: HDL cholesterol, HDL-P: HDL particles, LDL: Low density lipoprotein, LDL-C: LDL cholesterol, LDL-P: LDL particles, TG: Triglycerides
Sensitivity Analysis for CHD Associations
In multivariable models, interaction terms for sex, ethnicity, diabetes or hsCRP were not statistically significant. Results were similar if adjusted for baseline diabetes status, or if current hormone users were excluded, or if stratified by sex. With few cases among women (n=66), CHD risk estimates for women were not statistically significant, but the base covariate-adjusted HR (95%CI) for (1-SD) higher HDL-C (0.81 (0.63, 1.05) became 1.00 (0.71, 1.43) when adjusted for HDL-P and LDL-P, whereas for HDL-P, the base covariate-adjusted HR(95%CI) of 0.77 (0.59, 1.00), became 0.81 (0.57, 1.14) when adjusted for HDL-C and LDL-P. Results were also similar for the secondary outcomes of all CVD or hard CHD or hard CVD (Online Table 1.)
Finally, we evaluated CHD risk associations at very high levels of HDL-C and HDL-P. Adjusted for base covariates, LDL-P, HDL-P, and log-triglycerides the HR(95%CI) for very high HDL-C (≥80 mg/dl) compared with low HDL-C (<40 mg/dl) became positive and statistically significant (2.59 (1.11, 6.02). Conversely, adjusted for base covariates, LDL-P, HDL-C and log-triglycerides, the HR(95%CI) for analogous very high vs. low HDL-P (≥45.7 vs. <29 μmol/l) was 0.50 (0.19, 1.35).
Discussion
Among multi-ethnic men and women without clinical CVD or lipid-lowering medication use at baseline, HDL-C associations with cIMT and incident CHD were substantially attenuated by adjusting for atherogenic lipoproteins, particularly LDL-P. In contrast, HDL-P associations with cIMT and incident CHD were relatively unaffected by adjusting for atherogenic lipoproteins, HDL-C, and mean HDL particle size. Results were similar for secondary outcomes of “all CVD,” and “hard” CHD or CVD events.
Few studies have evaluated HDL-P associations with CHD risk, and we know of none that evaluated it jointly with HDL-C and LDL-P. Low HDL-P levels predicted CHD death over 18 years of follow-up among men with metabolic syndrome in the MRFIT cohort.(24) In EPIC-Norfolk, lower HDL-P levels predicted incident events independent of age, sex, apoB, triglycerides, mean HDL particle size, smoking, myeloperoxidase, paraoxonase-1, and hsCRP.(10) Lower HDL-P also predicted CVD events among HIV patients.(25) In the VA-HIT Study, lower levels of baseline and on-trial HDL-P predicted CHD events among men with low HDL-C randomized to gemfibrozil vs. placebo.(26) In the large Women’s Health Study, the inverse association of HDL-P with incident CVD over an 11 year follow-up was not significant.(27) However, HDL-P was inversely associated with incident CHD among postmenopausal women in the Women’s Health Initiative Hormone Trial, adjusted for treatment arm,(28) and the inverse association of HDL-P with cIMT was statistically significant for women in the current study. Future studies may help to reconcile these results.
In this study, HDL-C was not inversely associated with cIMT or CHD after adjusting for LDL-P and HDL-P, similar to reported attenuation of HDL-C associations when adjusted for apoB, as an index of atherogenic lipoproteins, and apoA-I.(9) In our study, very high HDL-C (≥80 mg/dl) became positively associated with CHD risk (p<0.05), when adjusted for LDL-P, HDL-P and triglycerides, as reported in IDEAL (adjusted for apoB and apoA-I.)(9) In contrast, very high HDL-P (≥45.7 μmol/l) remained inversely associated with CHD, in models adjusting for LDL-P, HDL-C and triglycerides. However, the results of this study suggest that, adjusted for LDL-P and HDL-P, HDL-C loses its inverse association with atherosclerotic CHD across the range of HDL-C, not just at very high HDL-C.
Potential Mechanisms
These results suggest that since HDL-C, the cholesterol content of HDL, varies inversely with triglycerides, LDL-P or apoB, and other metabolic risk factors, the risk attributed to HDL-C may come from several sources other than low levels of particles (i.e. HDL-P). In contrast, HDL-P remained inversely associated with atherosclerotic risk relatively independently of both atherogenic lipoprotein levels, and its own cholesterol content (i.e. HDL-C). More HDL particles may equal higher reverse cholesterol transport capacity. Cholesterol efflux, an index of HDL’s capacity for reverse cholesterol transport, was inversely correlated with cIMT and angiographic coronary disease independent of HDL-C, and cholesterol efflux was also associated with higher levels of apoA-I (a rough measure of HDL particles) independent of HDL-C.(29) Furthermore, in a study of diabetic patients, cholesterol efflux was positively associated with total HDL-P but not with HDL-C or apoA-I.(30) Anti-atherogenic benefits of higher HDL-P (anti-oxidation, anti-inflammation, etc.) may also be related to HDL’s protein or other cargo (e.g., apoA-I, paraoxonase-1, myeloperoxidase) rather than to its cholesterol cargo.(1,2) Indeed, in EPIC-Norfolk, the HDL-associated anti-oxidant paroxonase-1 was positively correlated with HDL-P more strongly than with HDL-C or apoA-I.(10) However, given the complexity of HDL, many potential mechanisms require further investigation.(2)
Terapeutic Interventions
Lifestyle and pharmacologic interventions to increase low HDL-C have been reviewed elsewhere,(31) but few studies have evaluated intervention effects on HDL-P compared with HDL-C. A few studies have reported that HDL-C and HDL-P are both higher with hormone therapy(28) and alcohol intake.(32) Active smokers have lower levels of both HDL-C and HDL-P, (33) and both increased with smoking cessation in a recent randomized clinical trial.(34) The limited existing data suggest that physical activity(35) and diet/exercise interventions may increase HDL-C but not HDL-P,(36) which would occur if large cholesterol-rich particles increase at the expense of smaller particles.
Niacin also raises HDL-C with little effect on HDL-P.(37) Torcetrapib reportedly raised HDL-P by only 1% despite a 53% increase in HDL-C.(38) In contrast, gemfibrozil increased HDL-P more than HDL-C in VA-HIT, and as noted, on-treatment HDL-P predicted lower CHD events.(26) Statins also increase HDL-P more than HDL-C, as well as decreasing LDL-P less than LDL-C.(39) Among diabetic individuals, effects of vitamin E intake on HDL function (i.e., cholesterol efflux) differ by haptoglobin genotype, increasing it for Hp2-2 and decreasing it for Hp 2-1.(12) Whether effects on HDL-P levels would parallel these effects is unknown. Additional research is needed to quantify differential effects of pharmacological interventions as well as types of diet, omega-3 fatty acids, haptoglobin genotype(12) and other influences on HDL in relation to outcomes.
Potential implications
These results show that associations of HDL-C with CHD risk may be partially due to metabolic correlations with atherogenic lipoprotein concentrations. In contrast, associations of HDL-P with CHD risk were substantially independent of atherogenic lipoprotein concentrations, and of HDL-C. HDL-C is one measured parameter of HDL. It may be important to assess parameters other than HDL-C in clinical trials of interventions to raise “HDL.” HDL-P may be an alternative to HDL-C as a marker of HDL-related cardiovascular risk, if these findings are confirmed in other studies and found to be cost-effective.
Potential limitations
These results, while robust, are observational, do not prove causality, and may be subject to bias and confounding, measurement error or unmeasured confounders. Lipid and lipoprotein levels are dynamically metabolically interrelated,(8,11) and statistical modeling in a large observational study is only one tool to investigate potential effects of these interrelationships, which warrant additional metabolic studies. However, despite statistical adjustment for several correlated lipoproteins, multicollinearity was not a problem in this study, as assessed by variance inflation factors. ApoA-I and apoB are not currently available in MESA, so their influence could not be evaluated in the current study. Finally, there were very few events at the high end of the HDL parameter ranges and few among women, limiting our ability to evaluate independent effects on CHD risk in those groups.
Conclusion
Among multi-ethnic men and women, associations of HDL-C with carotid IMT and incident CHD were substantially attenuated by adjusting for atherogenic lipoproteins and HDL-P, whereas HDL-P remained significantly inversely associated with cIMT and incident CHD, independent of atherogenic lipoproteins (LDL-P, triglycerides and LDL-C) and HDL-C. These results may have implications both for risk assessment and for evaluation of therapeutic interventions, particularly pharmacologic interventions which may differentially affect several lipid and lipoprotein parameters concurrently. Quantitative and metabolic interrelationships between lipids and the lipoprotein particles that carry them should be considered when evaluating associations between single parameters, e.g., HDL-C, and atherosclerotic cardiovascular risk.
Supplementary Material
Online Table 1: HR (95% CI) for incident CHD and CVD for a 1 SD difference in HDL-C and HDLP
Acknowledgements
This research was supported by contracts N01-HC-95159 through N01-HC-95169 from the National Heart, Lung, and Blood Institute, an unrestricted grant from LipoScience, Inc., who also measured NMR lipoproteins at no additional cost to MESA, and by grant K08 HL094375 (Dr. Mora). Funding sources had no role in the study design, analysis, or in the decision to submit the manuscript for publication. We thank MESA investigators, staff, and participants for their valuable contributions; MESA investigators/institutions listed at http://www.mesa-nhlbi.org. The information contained herein was derived in part from data provided by the Bureau of Vital Statistics, NY City Department of Health and Mental Hygiene.
Relationship with industry/ funding Dr. Mackey’s effort was supported by a research grant from LipoScience, Inc. to the University of Pittsburgh. The grant was unrestricted as LipoScience exercised no control over the design, management, analysis, or interpretation of the data or in the preparation, review, or approval of the manuscript.
Abbreviations
- CVD
cardiovascular disease
- CHD
coronary heart disease
- HDL-P
High-density lipoprotein particles
- LDL-P
Low-density lipoprotein particles
- LDL-C
Low-density lipoprotein cholesterol
- HDL-C
High-density lipoprotein cholesterol
- TG
Triglycerides
- hsCRP
high sensitivity c-reactive protein
- cIMT
carotid intima-media thickness
- apoA-I
apolipoprotein A-I
- apoB
apolipoprotein B
- MESA
Multi-Ethnic Study of Atherosclerosis
- HOMA-IR
homeostasis model of insulin resistance
- SD
standard deviation
Reference List
- 1.Vergeer M, Holleboom AG, Kastelein JJ, Kuivenhoven JA. The HDL hypothesis: does high-density lipoprotein protect from atherosclerosis? J Lipid Res. 2010;51:2058–73. doi: 10.1194/jlr.R001610. [DOI] [PMC free article] [PubMed] [Google Scholar]
- 2.deGoma EM, deGoma RL, Rader DJ. Beyond high-density lipoprotein cholesterol levels evaluating high-density lipoprotein function as influenced by novel therapeutic approaches. J Am Coll Cardiol. 2008;51:2199–211. doi: 10.1016/j.jacc.2008.03.016. [DOI] [PMC free article] [PubMed] [Google Scholar]
- 3.Frikke-Schmidt R. Genetic variation in the ABCA1 gene, HDL cholesterol, and risk of ischemic heart disease in the general population. Atherosclerosis. 2010;208:305–16. doi: 10.1016/j.atherosclerosis.2009.06.005. [DOI] [PubMed] [Google Scholar]
- 4.Johannsen TH, Kamstrup PR, Andersen RV, et al. Hepatic lipase, genetically elevated high-density lipoprotein, and risk of ischemic cardiovascular disease. J Clin Endocrinol Metab. 2009;94:1264–73. doi: 10.1210/jc.2008-1342. [DOI] [PubMed] [Google Scholar]
- 5.Barter PJ, Caulfield M, Eriksson M, et al. Effects of torcetrapib in patients at high risk for coronary events. N Engl J Med. 2007;357:2109–22. doi: 10.1056/NEJMoa0706628. [DOI] [PubMed] [Google Scholar]
- 6.Ginsberg HN, Elam MB, Lovato LC, et al. Effects of combination lipid therapy in type 2 diabetes mellitus. N Engl J Med. 2010;362:1563–74. doi: 10.1056/NEJMoa1001282. [DOI] [PMC free article] [PubMed] [Google Scholar]
- 7.Nissen SE, Tardif JC, Nicholls SJ, et al. Effect of torcetrapib on the progression of coronary atherosclerosis. N Engl J Med. 2007;356:1304–16. doi: 10.1056/NEJMoa070635. [DOI] [PubMed] [Google Scholar]
- 8.Rosenson RS, Brewer HB, Jr, Chapman MJ, et al. HDL measures, particle heterogeneity, proposed nomenclature, and relation to atherosclerotic cardiovascular events. Clin Chem. 2011;57:392–410. doi: 10.1373/clinchem.2010.155333. [DOI] [PubMed] [Google Scholar]
- 9.van der Steeg WA, Holme I, Boekholdt SM, et al. High-density lipoprotein cholesterol, high-density lipoprotein particle size, and apolipoprotein A-I: significance for cardiovascular risk: the IDEAL and EPIC-Norfolk studies. J Am Coll Cardiol. 2008;51:634–42. doi: 10.1016/j.jacc.2007.09.060. [DOI] [PubMed] [Google Scholar]
- 10.El Harchaoui K, Arsenault BJ, Franssen R, et al. High-density lipoprotein particle size and concentration and coronary risk. Ann Intern Med. 2009;150:84–93. doi: 10.7326/0003-4819-150-2-200901200-00006. [DOI] [PubMed] [Google Scholar]
- 11.Kontush A, Chapman MJ. Why is HDL functionally deficient in type 2 diabetes? Curr Diab Rep. 2008;8:51–9. doi: 10.1007/s11892-008-0010-5. [DOI] [PubMed] [Google Scholar]
- 12.Farbstein D, Blum S, Pollak M, et al. Vitamin E therapy results in a reduction in HDL function in individuals with diabetes and the haptoglobin 2-1 genotype. Atherosclerosis. 2011;219:240–4. doi: 10.1016/j.atherosclerosis.2011.06.005. [DOI] [PMC free article] [PubMed] [Google Scholar]
- 13.Corsetti JP, Gansevoort RT, Sparks CE, Dullaart RP. Inflammation reduces HDL protection against primary cardiac risk. Eur J Clin Invest. 2010;40:483–9. doi: 10.1111/j.1365-2362.2010.02287.x. [DOI] [PubMed] [Google Scholar]
- 14.Dodani S, Kaur R, Reddy S, Reed GL, Navab M, George V. Can dysfunctional HDL explain high coronary artery disease risk in South Asians? Int J Cardiol. 2008;129:125–32. doi: 10.1016/j.ijcard.2007.12.019. [DOI] [PubMed] [Google Scholar]
- 15.Fan AZ, Dwyer JH. Sex differences in the relation of HDL cholesterol to progression of carotid intima-media thickness: the Los Angeles Atherosclerosis Study. Atherosclerosis. 2007;195:e191–e196. doi: 10.1016/j.atherosclerosis.2007.03.045. [DOI] [PubMed] [Google Scholar]
- 16.Bild DE, Bluemke DA, Burke GL, et al. Multi-ethnic study of atherosclerosis: objectives and design. Am J Epidemiol. 2002;156:871–81. doi: 10.1093/aje/kwf113. [DOI] [PubMed] [Google Scholar]
- 17.Matthews DR, Hosker JP, Rudenski AS, Naylor BA, Treacher DF, Turner RC. Homeostasis model assessment: insulin resistance and beta-cell function from fasting plasma glucose and insulin concentrations in man. Diabetologia. 1985;28:412–9. doi: 10.1007/BF00280883. [DOI] [PubMed] [Google Scholar]
- 18.Friedewald WT, Levy RI, Fredrickson DS. Estimation of the concentration of low-density lipoprotein cholesterol in plasma, without use of the preparative ultracentrifuge. Clin Chem. 1972;18:499–502. [PubMed] [Google Scholar]
- 19.Jeyarajah EJ, Cromwell WC, Otvos JD. Lipoprotein particle analysis by nuclear magnetic resonance spectroscopy. Clin Lab Med. 2006;26:847–70. doi: 10.1016/j.cll.2006.07.006. [DOI] [PubMed] [Google Scholar]
- 20.O’Leary DH, Polak JF, Kronmal RA, Manolio TA, Burke GL, Wolfson SK., Jr Carotid-artery intima and media thickness as a risk factor for myocardial infarction and stroke in older adults. Cardiovascular Health Study Collaborative Research Group. N Engl J Med. 1999;340:14–22. doi: 10.1056/NEJM199901073400103. [DOI] [PubMed] [Google Scholar]
- 21.Mora S, Szklo M, Otvos JD, et al. LDL particle subclasses, LDL particle size, and carotid atherosclerosis in the Multi-Ethnic Study of Atherosclerosis (MESA) Atherosclerosis. 2007;192:211–7. doi: 10.1016/j.atherosclerosis.2006.05.007. [DOI] [PubMed] [Google Scholar]
- 22.Bluemke DA, Kronmal RA, Lima JA, et al. The relationship of left ventricular mass and geometry to incident cardiovascular events: the MESA (Multi-Ethnic Study of Atherosclerosis) study. J Am Coll Cardiol. 2008;52:2148–55. doi: 10.1016/j.jacc.2008.09.014. [DOI] [PMC free article] [PubMed] [Google Scholar]
- 23.Otvos JD, Mora S, Shalaurova I, Greenland P, Mackey RH, Goff DC., Jr Clinical implications of discordance between low-density lipoprotein cholesterol and particle number. J Clin Lipidol. 2011;5:105–13. doi: 10.1016/j.jacl.2011.02.001. [DOI] [PMC free article] [PubMed] [Google Scholar]
- 24.Kuller LH, Grandits G, Cohen JD, Neaton JD, Prineas R. Lipoprotein particles, insulin, adiponectin, C-reactive protein and risk of coronary heart disease among men with metabolic syndrome. Atherosclerosis. 2007;195:122–8. doi: 10.1016/j.atherosclerosis.2006.09.001. [DOI] [PMC free article] [PubMed] [Google Scholar]
- 25.Duprez DA, Kuller LH, Tracy R, et al. Lipoprotein particle subclasses, cardiovascular disease and HIV infection. Atherosclerosis. 2009;207:524–9. doi: 10.1016/j.atherosclerosis.2009.05.001. [DOI] [PMC free article] [PubMed] [Google Scholar]
- 26.Otvos JD, Collins D, Freedman DS, et al. Low-density lipoprotein and high-density lipoprotein particle subclasses predict coronary events and are favorably changed by gemfibrozil therapy in the Veterans Affairs High-Density Lipoprotein Intervention Trial. Circulation. 2006;113:1556–63. doi: 10.1161/CIRCULATIONAHA.105.565135. [DOI] [PubMed] [Google Scholar]
- 27.Mora S, Otvos JD, Rifai N, Rosenson RS, Buring JE, Ridker PM. Lipoprotein particle profiles by nuclear magnetic resonance compared with standard lipids and apolipoproteins in predicting incident cardiovascular disease in women. Circulation. 2009;119:931–9. doi: 10.1161/CIRCULATIONAHA.108.816181. [DOI] [PMC free article] [PubMed] [Google Scholar]
- 28.Hsia J, Otvos JD, Rossouw JE, et al. Lipoprotein Particle Concentrations May Explain the Absence of Coronary Protection in the Women’s Health Initiative Hormone Trials. Arterioscler Thromb Vasc Biol. 2008;28:1666–71. doi: 10.1161/ATVBAHA.108.170431. [DOI] [PMC free article] [PubMed] [Google Scholar]
- 29.Khera AV, Cuchel M, Llera-Moya M, et al. Cholesterol efflux capacity, high-density lipoprotein function, and atherosclerosis. N Engl J Med. 2011;364:127–35. doi: 10.1056/NEJMoa1001689. [DOI] [PMC free article] [PubMed] [Google Scholar]
- 30.Tan HC, Tai ES, Sviridov D, et al. Relationships between cholesterol efflux and high-density lipoprotein particles in patients with type 2 diabetes mellitus. J Clin Lipidol. 2011;5:467–73. doi: 10.1016/j.jacl.2011.06.016. [DOI] [PubMed] [Google Scholar]
- 31.Singh IM, Shishehbor MH, Ansell BJ. High-density lipoprotein as a therapeutic target: a systematic review. JAMA. 2007;298:786–98. doi: 10.1001/jama.298.7.786. [DOI] [PubMed] [Google Scholar]
- 32.Mukamal KJ, Mackey RH, Kuller LH, et al. Alcohol consumption and lipoprotein subclasses in older adults. J Clin Endocrinol Metab. 2007;92:2559–66. doi: 10.1210/jc.2006-2422. [DOI] [PubMed] [Google Scholar]
- 33.Gossett LK, Johnson HM, Piper ME, Fiore MC, Baker TB, Stein JH. Smoking intensity and lipoprotein abnormalities in active smokers. J Clin Lipidol. 2009;3:372–8. doi: 10.1016/j.jacl.2009.10.008. [DOI] [PMC free article] [PubMed] [Google Scholar]
- 34.Gepner AD, Piper ME, Johnson HM, Fiore MC, Baker TB, Stein JH. Effects of smoking and smoking cessation on lipids and lipoproteins: outcomes from a randomized clinical trial. Am Heart J. 2011;161:145–51. doi: 10.1016/j.ahj.2010.09.023. [DOI] [PMC free article] [PubMed] [Google Scholar]
- 35.Pettee KK, Kriska AM, Johnson BD, et al. The relationship between physical activity and lipoprotein subclasses in postmenopausal women: the influence of hormone therapy. Menopause. 2007;14:115–22. doi: 10.1097/01.gme.0000229573.29258.d5. [DOI] [PubMed] [Google Scholar]
- 36.Kuller LH, Pettee Gabriel KK, Kinzel LS, et al. The Women on the Move Through Activity and Nutrition (WOMAN) Study: Final 48-Month Results. Obesity (Silver Spring) 2012;20:636–643. doi: 10.1038/oby.2011.80. [DOI] [PMC free article] [PubMed] [Google Scholar]
- 37.Jafri H, Alsheikh-Ali AA, Mooney P, Kimmelstiel CD, Karas RH, Kuvin JT. Extended-release niacin reduces LDL particle number without changing total LDL cholesterol in patients with stable CAD. J Clin Lipidol. 2009;3:45–50. doi: 10.1016/j.jacl.2008.12.003. [DOI] [PubMed] [Google Scholar]
- 38.Rashedi N, Brennan D, Kastelein JJ, Nissen SE, Nicholls S. Impact of Cholesteryl Ester Transfer Protein Inhibition on Nuclear Magnetic Resonance Derived Lipoprotein Particle Parameters (abstr) Atherosclerosis Supplements. 2011;12:48. [Google Scholar]
- 39.Rosenson RS, Otvos JD, Hsia J. Effects of rosuvastatin and atorvastatin on LDL and HDL particle concentrations in patients with metabolic syndrome: a randomized, double-blind, controlled study. Diabetes Care. 2009;32:1087–91. doi: 10.2337/dc08-1681. [DOI] [PMC free article] [PubMed] [Google Scholar]
Associated Data
This section collects any data citations, data availability statements, or supplementary materials included in this article.
Supplementary Materials
Online Table 1: HR (95% CI) for incident CHD and CVD for a 1 SD difference in HDL-C and HDLP