Abstract
This paper explores trends in poverty and nutrition during economic transformation and especially the impacts linked to government support for agriculture during the process. Analysis of multiyear data for 29 developing countries confirms that structural transformation raises total income and that poverty falls faster with strong support for agriculture. In turn, poverty reduction supports improved nutrition, especially in rural areas. However, transformation brings problems through health risks associated with rising obesity in rural as well as urban areas. Thus, the transition process must be managed better, through targeted support for smallholder agriculture and health interventions, if the negative consequences of obesity and chronic disease are to be mitigated.
Keywords: agricultural policy, economic growth
The global food price crises of 2007–2008 and 2010–2011 refocused attention on agriculture. Stalled growth in cereal yield and increased variability in supply highlighted long-term neglect of the farm sector (1). Many agencies, like the World Bank, argued that “agriculture must be a prominent part of the development agenda, whether for delivering growth … or for reducing rural poverty” (2). However, some analysts urge caution, proposing that high-productivity agriculture leads to the oversupply of cheap food of the “wrong kinds” (cereals and high-fructose corn syrup over fruits or legumes), and this oversupply may be a factor in spreading obesity (3–5). Although the main contributor to the global burden of disease still is underweight, more than 84% of the diseases tied to high body mass index, high cholesterol, high blood glucose, low fruit and vegetable intake, and physical inactivity occur in low-, and middle-income countries (6). The obesity epidemic already has spread to poorest households in the poorest nations (7).
What are developing country governments to do? Although agricultural policy's role in the obesity epidemic remains unproven empirically, that lack of verification does not prevent polemic from influencing the debate. Urged by donors to invest more in agriculture to enhance macroeconomic growth, governments also are concerned about the escalating costs associated with chronic diseases. This paper explores the links among economic growth, nutrition, and health conditioned on levels of public support for agriculture. Based on multiyear observations for 29 countries covering three continents, we investigate relationships between economic transformation and changing patterns of health, underpinned by global changes in food systems and dietary choices. The first section discusses multiple transitions that characterize developing economies today. The second section presents data used in the statistical analysis given in the third section. The last section offers conclusions and policy implications.
Structural Transformation and Societal Transition
According to Timmer and Akkus (8), all governments seek to raise productivity because “that is the only way to achieve higher standards of living and sustain reductions in poverty.” Although approaches vary, as do success rates, economic transformation involves three major processes: (i) a falling share of agriculture in economic output and employment, (ii) a rising share of urban population versus rural population, and (iii) rising economic activity in industry and services. These processes support investments in skills and education, lower transactions costs through integrated economic activities, and adoption of improved technologies that together support more efficient and productive allocation of resources.
The relative decline of agriculture during transformation is paradoxical but inevitable. Agriculture is an acknowledged engine of growth through its early contributions to rural employment, tax revenue, and foreign exchange (9, 10). Indeed, Timmer and Akkus (8) state that “no country has been able to sustain a rapid transition out of poverty without raising productivity in its agricultural sector.” However, this process leads to a decline in agriculture's role in the economy as industrial and service sectors grow rapidly. As Mellor (9) put it, “The faster agriculture grows, the faster its relative size declines.” The relative decline is driven by growth in productivity and output in urban-based industry, which draws labor from rural areas. As urban growth accelerates, rising national income usually is associated with gains in life expectancy, education, and living standards.
Income growth can bring unintended shifts in nutrition and health. An epidemiological transition mirrors economic transformation. (i) High fertility and high mortality both decline with reduced poverty and greater investments in health. (ii) Disease patterns change, with infectious diseases giving way to chronic diseases. (iii) Shifts in dietary patterns and physical activity reflect a transition in nutrition, namely, increased demand for processed foods, fats and oils, high-energy (sugary) drinks, and meat and dairy products, as well as adoption of more sedentary lifestyles. Such changes are happening globally at earlier stages of economic transformation than before, and the burden of obesity is shifting to the poor, including rural smallholder households (11).
The questions posed in the following analysis are (i) What are the associations between income growth, structural transformation, and nutrition outcomes? (ii) What role does policy support for agriculture play in determining patterns of sectoral growth? (iii) Do countries supporting agriculture avoid the growth in obesity?
Data
This analysis combines economic and health data to construct a panel for 29 developing countries observed between 1980 and 2007 (Table S1). Africa, which is particularly burdened by undernutrition and chronic poverty, is well represented in the sample with 47 of the 77 annual observations. The World Bank's World Development Indicators database offers economic and demographic data (available at http://data.worldbank.org/data-catalog/world-development-indicators). Diabetes prevalence derives from the International Diabetes Federation's Diabetes Atlas (available at http://da3.diabetesatlas.org/), and data on years lost to noncommunicable diseases come from the World Health Organization (available at http://www.who.int/whosis/en/index.html). The indicator used to represent relative policy support accorded to agriculture versus nonagriculture (described below) draws on the World Bank's Distortions to Agricultural Incentives Project (available at http://www.worldbank.org/agdistortions). Economic and health variables are available for many countries and years; however, the sample of national-level data on child nutrition is more limited, restricting the overall matched sample.
The dependent variables for anthropometric analyses are national-level percentage headcounts (prevalence rates) of child undernutrition/obesity computed by Bhagowalia (12) from Demographic and Health Surveys (available at http://www.measuredhs.com). The threshold for wasting is a weight-for-height ratio (whz) two SDs below the mean for the child's age (children aged 6–59 mo) in a well-nourished population. The resulting prevalence for wasting (whz less than −2) is computed by country and year. The same source was used for data on stunting (child height-for-age z-score two SDs below the reference mean for children age 6–59 mo) and on obesity (weight-for-height z scores one or more SDs above the mean). These data yield a total of 77 observations from 29 countries (Table S2).
Structural Transformation, Poverty, and Nutrition
As noted above, income growth in the structural transformation is associated with higher urban population, but income in agriculture grows also. Indeed, although income per capita grows in both sectors, along with average income per capita, the ratio of agricultural to nonagricultural income per capita more than triples in our data over the course of the structural transformation, increasing from around 0.1 when the rural population share is over 80% to nearly 0.35 when the rural population share falls to around 20%. [Similarly, Timmer (13) finds that this ratio declines as a function of aggregate gross domestic product (GDP) per capita before it increases and that this turning point has shifted over time to higher levels of income.] This increase in rural income per capita is consistent with increasing scarcity of rural labor and growing abundance of nonagricultural labor, as posited by early models of dualistic development (14).
The tendency toward convergence in sectoral incomes as the rural population declines also points to the importance of ensuring productivity growth in agriculture even as the economy is transforming out of agriculture. As the GDP grows rapidly, the rural population share falls rapidly enough to approach agriculture's share of GDP only at relatively high levels of national income, resulting in a lag in rural areas’ access to the benefits of rapid growth.
However, the gains from transformation go beyond enhanced earnings. One analysis of 12 countries from the 1970s to the 1990s (15) found that a 10% increase in national income resulted in a 5% decline in underweight children [i.e., children with a low weight-for-age, a composite measure of stunting (chronic impairment of linear growth among preschool children as measured by low height-for-age) and wasting (children having an acutely slender frame reflecting recent episodes of weight loss, measured as low weight-for-height]. The suggestion is that, although economic growth translates into gains for nutrition, such growth resolves only half the problem in the absence of interventions targeted to the poorest, who benefit least from economic growth in the short term.
Such relationships are tested here through the use of semiparametric regression. The approach relaxes the typical assumptions of linearity, estimating models of the form
| [1] |
where X includes a vector of control variables (that enter linearly), and g (.) is an undefined function relating the dependent variable to the key dependent variable (Z) in a given model.
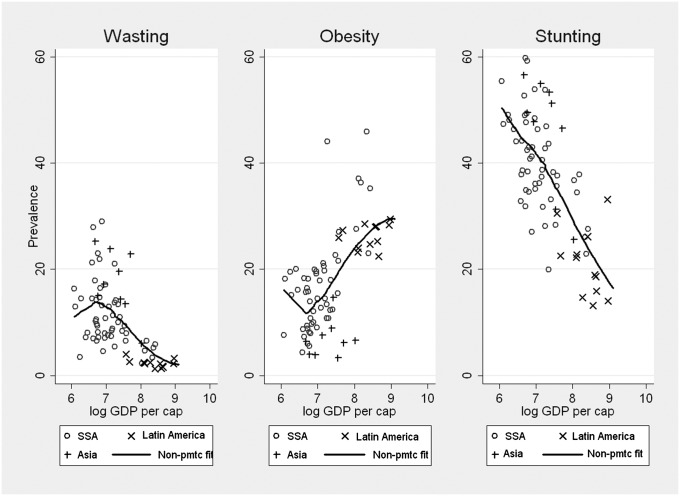
The current analysis for 29 countries extends previous work by showing that both stunting and wasting are associated with GDP growth, albeit in different ways (Fig. 1). Stunting declines with economic growth—from around 50% to less than 20%—as income rises by a factor of approximately 20. Unconditional on other potential determinants of stunting (of which there are many), the prevalence of stunting declines by an estimated 3.2% for every 10% increase in income per capita.* Wasting also responds to national economic growth but in a less-than-linear fashion. A 10% rise in income translates into a 7.4% fall in wasting.† Thus, continued income growth may generate further gains in nutrition as poverty declines. The regional contrasts in all three panels of Fig. 1 are notable. Latin American and Asian countries (excluding Japan) tend to cluster at the upper and lower boundaries of the dependent variable, with African countries spanning the nonparametric fitted path between them.
Fig. 1.
Undernutrition and overnutrition as a function of income per capita.
By contrast, improvements in undernutrition shown in Fig. 1 are paralleled by rising obesity. A 10% rise in income per capita translates into a 4.4% increase in obesity. (The unconditional elasticity estimate here is a lower bound, rising to 0.5 conditional on year and region.) This finding illustrates the quandary facing policymakers: There is a clear tradeoff in nutrition outcomes linked closely to structural transformation. Regional contrasts also are marked here, with relatively wealthy Latin American countries clustering at the high end of the obesity range, Asian countries clustered at lower income at the low end, and African countries tending toward the low end but with increasing prevalence of obesity in wealthier countries of the continent.
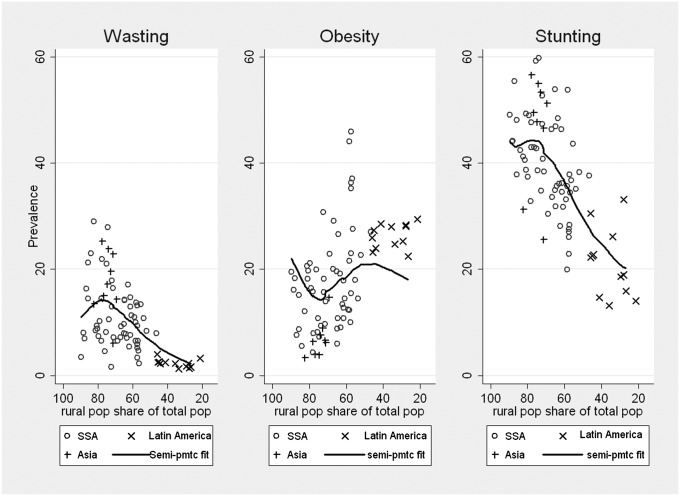
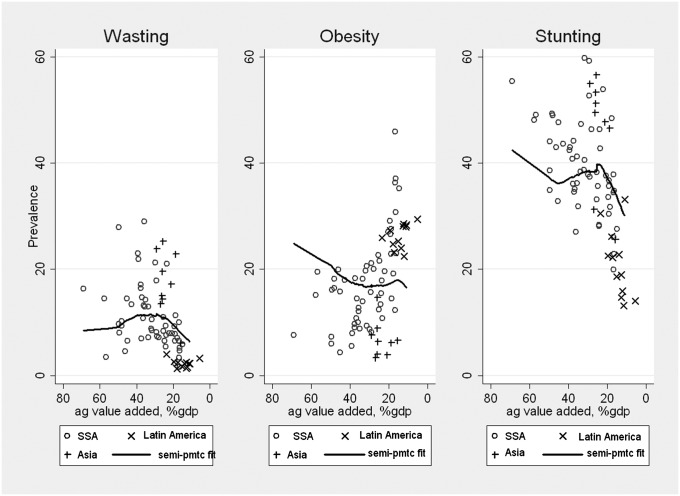
Importantly, obesity is not driven simply by a relocation of people to cities. Fig. 2 presents the same data on nutrition controlling for income per capita, but this time as a function of rural population share. Although stunting and wasting decline, the rate of growth in obesity remains relatively flat (on average) as the rural population share declines (and, by implication, income rises). These data suggest that obesity rises not simply as a byproduct of rural depopulation. (Also note in Fig. 2 the same type of regional clustering observed in Fig. 1.) Indeed, Fig. 3 shows that, although the structural transformation has two key dimensions (rural population share and the contribution of agriculture to GDP), the sectoral location of people seems to matter more than the sectoral structure of the economy in determining undernutrition. Despite the similarly high negative correlation of rural population share and agriculture share of GDP with income per capita (−0.78 and −0.82, respectively), controlling for income, nutritional outcomes relate to income and rural population share, but this pattern does not appear in the relationship between nutrition and agriculture's share of GDP.
Fig. 2.
Undernutrition and overnutrition as a function of the proportion of the rural population to the total population.
Fig. 3.
Undernutrition and overnutrition as a function of agriculture's share of GDP.
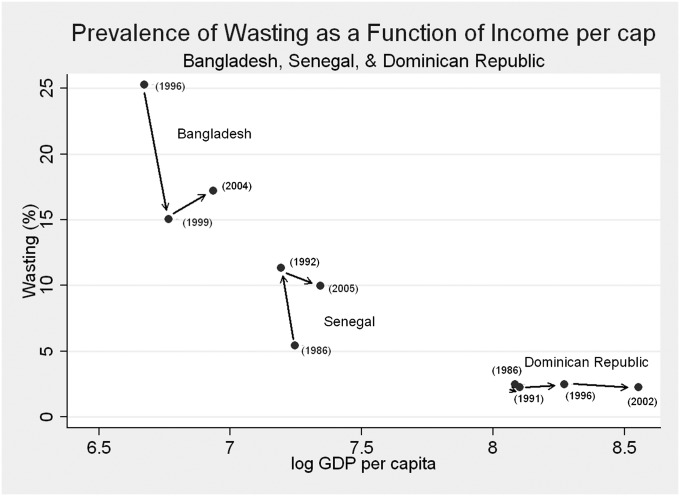
Although these general tendencies observed across countries and across years are robust, the particular experience of any individual country over time will vary idiosyncratically. We illustrate this diversity in Fig. 4, with representative countries from each region. Although income per capita increased consistently over time in Bangladesh (observed in 1996, 1999, and 2004), the prevalence of wasting declined dramatically between 1996 and 1999 but increased again between 1999 and 2004 despite the country's growth in income. By contrast, income in Senegal fell between 1986 and 1992. As expected, wasting increased over that same period and fell again as income in Senegal grew between 1992 and 2005 (although the trajectories during these two periods differed substantially). Finally, we observe consistent income growth in the Dominican Republic between 1986 and 2002, but this growth was not accompanied by reduction in the prevalence of wasting in that country. In other words, the correlates of nutritional outcomes are neither linear nor perfectly predictable, and many local factors play a role as codeterminants of a child's status. Wealth alone does not predict good nutrition.
Fig. 4.
Prevalence of wasting as a function of income per capita in selected countries.
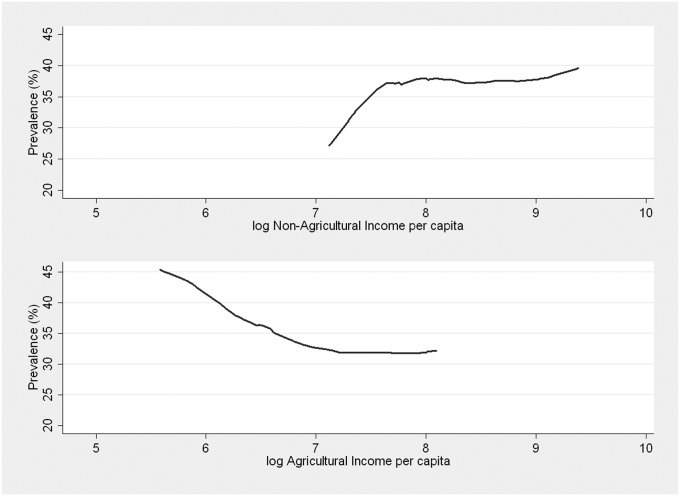
Nonetheless, income (as a metric of chronic poverty) remains consistently important, and the important role of sectoral income is highlighted by results shown in Fig. 5 , which control for overall income per capita, year, and rural population share (included to adjust for the fact that nutrition data are reported at national level, whereas incomes are sectoral). Stunting responds positively to rising income in the agriculture sector but less well to rising nonagriculture income. These data support the contention that “growth originating in agriculture, in particular the smallholder sector, is at least twice as effective in benefiting the poorest as growth from non-agriculture sectors” (3).
Fig. 5.
Prevalence of stunting as a function of agricultural and nonagricultural income per capita.
Such results offer some confirmation that policy support for agriculture as part of the process of structural transformation may help protect the poor and in so doing may enhance nutrition in a net sense, resolving undernutrition while seeking to prevent obesity. To test whether support for agriculture influences nutrition, we must specify an indicator of such policy support. For this purpose, we use an indicator of policy support for agriculture constructed by Anderson and Valenzuela (16) for the World Bank's Database of Agricultural Distortions. The relative rate of assistance (RRA) indicator measures the ratio of trade protection for agriculture to trade protection for nonagriculture by country and year, taking positive values when policy favors agriculture relative to nonagriculture. The RRA is limited to describing trade protection and does not allow us to distinguish effects of policy support for one type of crop or agricultural technology versus another, but that indicator does draw on the most complete database on agricultural policy decision-making currently available.
Having established that anthropometric outcomes are a function of both national income per capita and the rural population share, we now examine the role of agricultural policy as reflected in the RRA in mediating these effects. Column 1 in Table 1 presents the results of an ordinary least squares (OLS) regression of rural population share on income per capita, a dummy variable equal to 1 when RRA is greater than 0 (indicating relative support in favor of agriculture), and year. The structural transformation is reflected in the negative-slope estimate for log income per capita. In addition, however, the specification in column 1 suggests that the rural population share is lower by >5% at every level of income per capita when the policy environment supports agriculture relative to nonagriculture (e.g., a negative-shift effect).
Table 1.
Rural population share as a function of income per capita and agricultural policy
| Variables | (1) OLS | (2) System-GMM | (3) System-GMM |
| Log income per capita | −16.19* (3.018) | −15.79* ( 0.0723) | −14.76* (0.0868) |
| RRA possible dummy | −5.170 (3.532) | −5.425* (0.154) | 33.78* (1.513) |
| Log income × RRA possible dummy | −4.986* (0.191) | ||
| Year | −0.197†(0.103) | −0.200* (0.00749) | −0.171* (0.00809) |
| Constant | 577.9* (203.9) | 581.3* (14.89) | 515.2* (16.12) |
| Observations | 564 | 564 | 564 |
| R-squared | 0.636 | ||
| Number of countries | 24 | 24 | 24 |
Robust SEs are given in parentheses. Standard errors are clustered at country level.
*P < 0.01.
†P < 0.1.
Although this point estimate is not statistically significant in column 1, it becomes statistically significant when we address problems of endogeneity. Because the policy variable reflects a potentially endogenous choice variable, we reestimate this specification in column 2 using the system generalized method of moments (GMM) estimator of Blundell and Bond (17). This estimator, which also accommodates lagged dependent variables (excluded here), controls for fixed country effects and uses as instrumental variables appropriate lags and levels of the regressors themselves. This estimator thus addresses the potential endogeneity bias that arises from including a policy variable as an explanatory variable, although comparison of the estimates in columns 1 and 2 of Table 1 suggests that any bias in the OLS estimates was quite small. Indeed, the estimated coefficient on the policy dummy gains statistical significance in column 2. Column 3 expands the specification to include an interaction term between log income per capita and the dummy variable indicating positive support for agriculture. This interaction term allows the policy environment to change the rate at which rural population share declines as a function of income per capita. The result in column 3 indicates that rural population share falls about one-third more rapidly as a function of growth in income per capita when the policy environment favors agriculture. [The shift effect implied in column 3 is −3.40 (P = 0.000), when evaluated at the sample mean log income per capita.] These data suggest that structural transformation is accelerated in settings where positive policy support for agriculture facilitates the release of agricultural labor. These data further imply that, to the extent that declining rural population share is associated with reduced undernutrition, policy support for agriculture indirectly contributes to that reduction by accelerating the decline in rural population share.
Table 2.
Sectoral income as a function of agricultural policy, rural population share, and income per capita
| (1) System-GMM |
(2) System-GMM |
(3) System-GMM |
(4) System-GMM |
|
| Variables | Dependent variable: log agricultural income per capita | Dependent variable: log nonagricultural Income per capita | ||
| RRA possible dummy | 0.147* (0.00675) | 0.0398* (0.0140) | −0.0308* (0.00297) | 0.00140 (0.00653) |
| Log income per capita | 0.0532* (0.0146) | 0.0438* (0.00543) | ||
| Rural population share | −0.00133† (0.000624) | 0.000278‡ (0.000164) | ||
| Year | −1.98e-05 (0.000666) | −0.000455 (0.000636) | 0.000159 (0.000290) | 0.00167* (0.000301) |
| Dependent variable (t−1) | 0.916* (0.0164) | 0.956* (0.0167) | 0.957* (0.00635) | 1.011* (0.00525) |
| Constant | 0.175 (1.328) | 1.280 (1.302) | −0.280 (0.577) | −3.440* (0.612) |
| Observations | 469 | 469 | 469 | 469 |
| Number of countries | 23 | 23 | 23 | 23 |
SEs are given in parentheses.
*P < 0.01.
†P < 0.05.
‡P < 0.1.
The other key determinant of undernutrition is income per capita. We examined the effect of agricultural policy in mediating that effect, distinguishing as well between agricultural and nonagricultural income per capita. Table 2 presents the estimation results of two specifications for sectoral income per capita. One specification regresses sectoral income per capita against the RRA-positive dummy controlling for aggregate income per capita, and the other regresses sectoral income per capita against the RRA-positive dummy controlling for rural population share. We ran each of these specifications (using the same estimator as in Table 1 to address potential endogeneity bias) once with agricultural income and once with nonagricultural income as the dependent variables. (The separation of these specifications is motivated by the high degree of correlation between rural population share and aggregate income per capita.) The primary result presented in Table 2 is that policy support for agriculture relative to nonagriculture significantly increases agricultural income per capita (and either lowers or has no significant effect on nonagricultural income per capita), controlling for either rural population share or aggregate income per capita. This result highlights the role of agricultural policy in driving the previous finding that growth in agricultural income is particularly critical in reducing stunting. In addition, the finding in that a declining rural population share increases agricultural income per capita but decreases nonagricultural income per capita reinforces our earlier discussion of the effect of structural transformation on relative sectoral income.
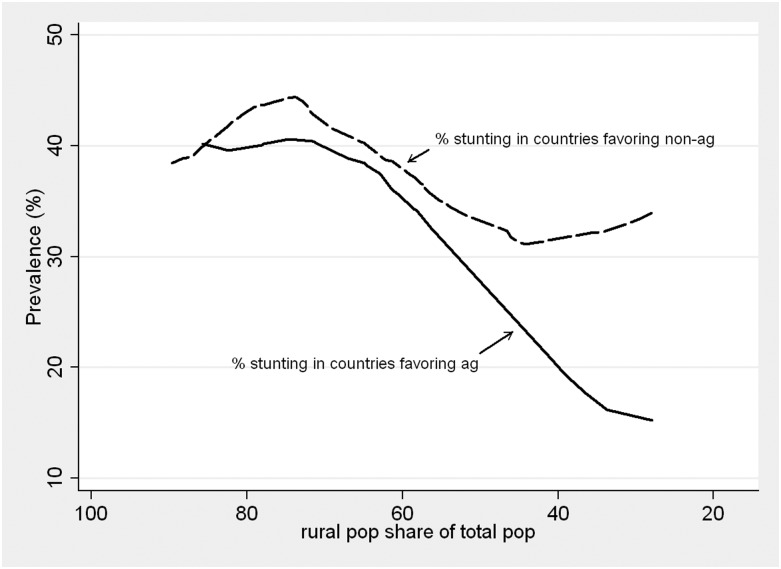
The results in Tables 1 and 2 describe plausible mechanisms through which policy support for agriculture may contribute to reduced undernutrition. Fig. 6 shows that, after controlling for income, stunting declines at a faster pace as transformation proceeds (here characterized by a declining share of population that is rural) in countries supporting agriculture than in those that do not.‡ The potential endogeneity of RRA (by which we split our sample) prevents us from claiming causality in this result. Nevertheless, the more rapid fall in stunting in countries favoring agriculture is an effect clearly associated with rapid increases in agricultural income. This result suggests that favoring agriculture as a policy decision can effectively accelerate poverty reduction and secure improvements in nutrition.
Fig. 6.
The effect of policy support for agriculture versus support for nonagriculture on the prevalence of stunting.
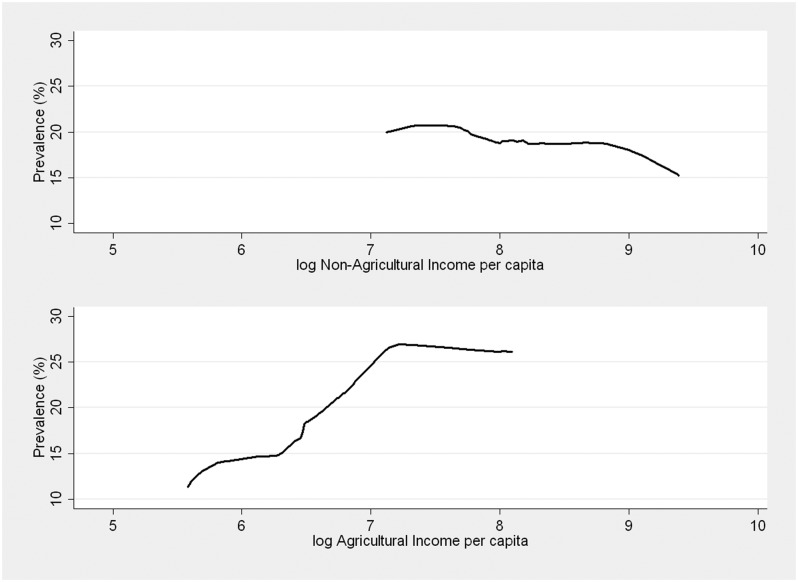
However, a downside to rapid rural income growth was alluded to earlier, namely, a rise in rural obesity. Fig. 7 shows that, after controlling for rural population share, obesity falls slightly as nonagricultural income rises but increases steeply as agriculture-based income rises. For example, a study of the impact of income growth in China after 1989 on dietary patterns showed that between 1989 and 1997 important changes in income took place and varied strongly by socioeconomic status (18). The structure of the Chinese diet shifted from high-carbohydrate foods to high-fat foods with high energy density, and poor households had the largest increase in detrimental effects (rising obesity) linked to increased income. Similarly, Mendez et al. (4) found that, in 36 developing countries, “the prevalence of overweight was significantly greater … than was that of underweight in both urban and rural areas.” It is possible that, when the rural population share is still high, policies favoring agriculture are not associated with high rates of obesity because rural incomes still are too low (transformation in productivity and employment has yet to take place), and integration of rural and urban areas still is weak. The prevalence of obesity too is driven by a (lagged) increase in rural incomes in favorable policy settings.
Fig. 7.
Prevalence of obesity as a function of agricultural and nonagricultural income per capita.
Thus, the policy choice designed to reduce economic and political stresses—supporting agriculture, thereby raising rural incomes and keeping the rural–urban income gap narrow—can be a double-edged sword. The policy succeeds in reducing poverty and manages to bring down stunting and wasting, with benefits for child life expectancy and future income-earnings potential. However, the same trends simultaneously sow the seeds of future health stresses in the form of obesity and chronic diseases.
The global rise of rural obesity does not appear to be distinct in etiology from urban trends. That is, the increasingly cheap supply of energy-dense foods, coupled with mechanized labor and transportation and changing patterns of leisure (notably television), result in new health and nutrition problems for rural households. Hossain et al. (19) report that “in the past 20 years, the rates of obesity have tripled in developing countries,” and that “90% of type 2 diabetes is attributable to excess weight.”
This result has implications for the health of individuals as well as for nations as a whole. Populations that (i) live longer than before, (ii) become more obese, and (iii) suffer both chronic and infectious diseases will place a heavy burden on health budgets. Diabetes is an example of an obesity-related chronic disease; global expenditures to treat and prevent diabetes are expected to exceed US $376 billion in 2010 and to reach almost US $500 billion by 2030 (20). India, the country currently with the largest population of people living with diabetes, is expected to spend around US $2.8 billion on diabetes in 2010 alone. [India, China, Indonesia, Pakistan, Brazil, and Bangladesh already are among the top 10 countries in terms of cases of diabetes (20).] A study of the nutrition transition in Indonesia (1992–2008) raises questions regarding the ability of the country's health system to cope with its aging population in the context of the rapid transition from infectious to chronic diseases (21).
Importantly, the World Health Organization has predicted that some of the largest impacts of diabetes and cardiovascular disease up to 2015 will be felt not only in growing economies such as India and Indonesia but also in poor countries like Tanzania and Myanmar (22). Thus, the largest economic burden will be not expenditures for treatment in countries that today spend less than US $10 per person on all forms of health care but rather will be the cost associated with disability and loss of life into future generations.
Conclusions
The three main findings presented here can be summarized thus: (i) Structural economic transformation is associated with poverty reduction, and the reduction is facilitated (especially in rural areas) if agriculture is supported during the process; (ii) poverty reduction strongly supports a reduction in child undernutrition (both stunting and wasting) when there is support for agriculture; because there are larger numbers of undernourished children in rural areas, and agricultural support increases rural incomes faster than urban incomes, the decline in undernutrition is more pronounced in rural settings; and (iii) even as undernutrition and poverty decline, the processes involved in economic transformation promote a surprisingly rapid increase in obesity, even in rural areas, and this increase brings with it the health and economic dangers associated with chronic diseases.
It is important to emphasize that declining rural population share linked to processes of economic transformation is accompanied by reductions in both stunting and wasting in both rural and urban settings, even when controlling for income per capita. That a similar decline is not found with respect to agriculture's share of GDP suggests that the effect of falling rural population share cannot be dismissed as an artifact of income growth. Closer examination shows that it is agricultural income per capita in particular (controlling for rural population share) that drives falling undernutrition. This significant result supports the argument that targeted support for smallholder agriculture in developing countries can make economic sense and also can contribute directly to improved rural well-being in terms of nutrition outcomes.
Although the inherent endogeneity of government choices makes causal claims difficult, our use of the Blundell and Bond (17) system GMM estimator provides at least some basis for concluding that a policy environment that supports agriculture (relative to nonagriculture) is at least correlated with an increase in agricultural incomes. In turn, we posit that agricultural income, in particular, is key to our finding that stunting is both lower and declines on a relatively steeper trajectory as a function of declining rural population in pro-agriculture policy settings. If such policy support for agriculture is targeted to enhancing smallholder productivity (rather than, say, to plantation/export cropping), poorer households are likely to obtain a larger share of the overall gains.
However, these benefits are double-edged. The prevalence of rural as well as urban obesity increases as households change patterns of diet and physical activity. Past increases in obesity, resulting at least in part from growth in agricultural incomes, help explain higher current rates of diabetes and future years of life lost to noncommunicable diseases.
Given that support for agriculture does not in itself prevent the rise of obesity and chronic disease, more research is needed to determine what kinds of support to agriculture have optimal net impacts on poverty, nutrition, and health simultaneously. Technical and policy support targeted to smallholder agriculture rather than to plantations or other high-productivity export-oriented activities, coupled with targeted health and nutrition interventions, could carry greater benefits for the poor. In other words, although it has been argued that health, trade, and agriculture sectors must work together against obesity (23), how this unified approach can be achieved remains a question for future research that will, by definition, need to be transdisciplinary. New metrics are needed to assess cumulative and net effects of multiple policy interactions rather than linear single policy–outcome relationships.§
Single-policy actions, whether in health, trade, or agriculture, are unlikely in isolation to achieve cross-sectoral gains that are essential to future economic growth. The interactions are complex and require more investigation, including attention to investments pursued by the private sector, not just by national governments. Choices made by policymakers must incorporate both the strategic plans of governments and corporate/private sector research and investment plans, because the latter increasingly influence the agenda at the smallholder level. Societal transition, supported by sustained structural transformation, will require policymakers to avoid the assumption that, with higher economic growth, other problems in health and nutrition will take care of themselves.
Supplementary Material
Acknowledgments
The authors are grateful to Barry Popkin and Edward Saltzman for facilitating access to data, to Peter Timmer for offering insights on key issues, and to the Special Editors of this PNAS Special Feature for extremely useful comments on an earlier draft.
Footnotes
The authors declare no conflict of interest.
This article is a PNAS Direct Submission.
*As an unconditional estimate, this prevalence is an upper bound (in absolute value terms) and estimated by regressing the log of stunting prevalence on log income per capita, thus obtaining an income elasticity of stunting at the mean of the cross-country income distribution. Note, however, that stunting in Fig.1 is essentially linear against income. Conditional on year and region, the estimate falls from −0.32 to −0.19.
†This estimate, too, represents an upper bound estimate based on no conditioning variables, estimated at the mean of the income distribution. Conditional on year and region this elasticity falls to −0.47 (from −0.74). The nonparametric line for wasting drops from a lower base than for stunting to give a larger percentage decrease.
‡Point estimates for the slopes (as distinct from the shift effect of a positive RRA) depicted nonparametrically in Fig. 5 suggest that the rate of decline in stunting is twice as steep in countries with supportive policy environments, although this difference in slopes falls short of being statistical significance (P = 0.14).
§Further research also is needed on economies of scale; that is, whether large countries such as India, China, Brazil, and Nigeria, with their large footprint in global food markets (via huge food imports), can afford to make different choices in support for their domestic agriculture, and whether this ability to make different choices results in a different sequencing of outcomes.
This article contains supporting information online at www.pnas.org/lookup/suppl/doi:10.1073/pnas.0913334108/-/DCSupplemental.
References
- 1.FAO (Food and Agriculture Organization of the United Nations) How to Feed the World in 2050. Rome: FAO; 2009. [Google Scholar]
- 2.World Bank . World Development Report 2008: Agriculture for Development. Washington, D.C.: World Bank; 2007. [Google Scholar]
- 3.Schoonover H, Muller M. Food without Thought: How U.S. Farm Policy Contributes to Obesity. Minneapolis: The Institute for Agriculture and Trade Policy; 2006. [Google Scholar]
- 4.Mendez MA, Monteiro CA, Popkin BM. Overweight exceeds underweight among women in most developing countries. Am J Clin Nutr. 2005;81:714–721. doi: 10.1093/ajcn/81.3.714. [DOI] [PubMed] [Google Scholar]
- 5.Bleich S, Cutler D, Murray C, Adams A. Why Is the Developed World Obese? National Bureau of Eeconimic Research Working Paper No. 12954. Cambridge, MA: National Bureau of Economic Research; 2007. [Google Scholar]
- 6.World Health Organization . Global Health Risks: Mortality and Burden of Disease Attributable to Selected Major Risks. Geneva: World Health Organization; 2009. [Google Scholar]
- 7.Popkin B. The World Is Fat: The Fads, Trends, Policies, and Products That Are Fattening the Human Race. London: Penguin Books; 2009. [Google Scholar]
- 8.Timmer P, Akkus S. The Structural Transformation as a Pathway out of Poverty: Analytics, Empirics and Politics. Working Paper Number 150. Washington, D.C: Center for Global Development; 2008. [Google Scholar]
- 9.Mellor J. The Economics of Agricultural Development. Ithaca, NY: Cornell Univ Press; 1966. [Google Scholar]
- 10.Chenery H, Syrquim M. Patterns of Development, 1950–1970. London: Oxford Univ Press; 1975. [Google Scholar]
- 11.Popkin BM, Gordon-Larsen P. The nutrition transition: Worldwide obesity dynamics and their determinants. Int J Obes Relat Metab Disord. 2004;28(Suppl 3):S2–S9. doi: 10.1038/sj.ijo.0802804. [DOI] [PubMed] [Google Scholar]
- 12.Bhagowalia P. The Distribution of Child Nutritional Status Across Countries and over Time. PhD dissertation. West Lafayette, IN: Purdue Univ; 2008. [Google Scholar]
- 13.Timmer P. A World Without Agriculture. The Structural Transformation in Historical Perspective. Washington: American Enterprise Institute Press; 2009. [Google Scholar]
- 14.Lewis W. Economic growth with unlimited supplies of labor. The Manchester School. 1954;22:139–191. [Google Scholar]
- 15.Haddad L, Alderman H, Appleton S, Song L, Yohannes Y. Reducing child malnutrition: How far does income growth take us? World Bank Econ Rev. 2003;17:107–131. [Google Scholar]
- 16.Anderson K, Valenzuela E. Estimates of Distortions to Agricultural Incentives, 1955 to 2007. 2008. core database at www.worldbank.org/agdistortions. Accessed August 2008.
- 17.Blundell R, Bond S. Initial conditions and moment restrictions in dynamic panel models. J Econom. 1998;87:115–143. [Google Scholar]
- 18.Du S, Mroz TA, Zhai F, Popkin BM. Rapid income growth adversely affects diet quality in China—particularly for the poor! Soc Sci Med. 2004;59:1505–1515. doi: 10.1016/j.socscimed.2004.01.021. [DOI] [PubMed] [Google Scholar]
- 19.Hossain P, Kawar B, El Nahas M. Obesity and diabetes in the developing world—a growing challenge. N Engl J Med. 2007;356:213–215. doi: 10.1056/NEJMp068177. [DOI] [PubMed] [Google Scholar]
- 20.IDB (International Diabetes Federation) The Diabetes Atlas. 4th Ed. Brussels: International Diabetes Federation; 2009. [Google Scholar]
- 21.Witoelar F, Strauss J, Sikoki B. Socioeconomic Success and Health in Later Life: Evidence from the Indonesia Family Life Survey. Working Paper 704. Santa Monica, CA: Rand Corporation; 2009. [Google Scholar]
- 22.Lefèbvre P, Silink M. Diabetes fights for recognition. Lancet. 2006;368:1625–1626. doi: 10.1016/S0140-6736(06)69671-2. [DOI] [PubMed] [Google Scholar]
- 23.Magnusson RS. Rethinking global health challenges: Towards a ‘global compact’ for reducing the burden of chronic disease. Public Health. 2009;123:265–274. doi: 10.1016/j.puhe.2008.12.023. [DOI] [PubMed] [Google Scholar]
Associated Data
This section collects any data citations, data availability statements, or supplementary materials included in this article.


