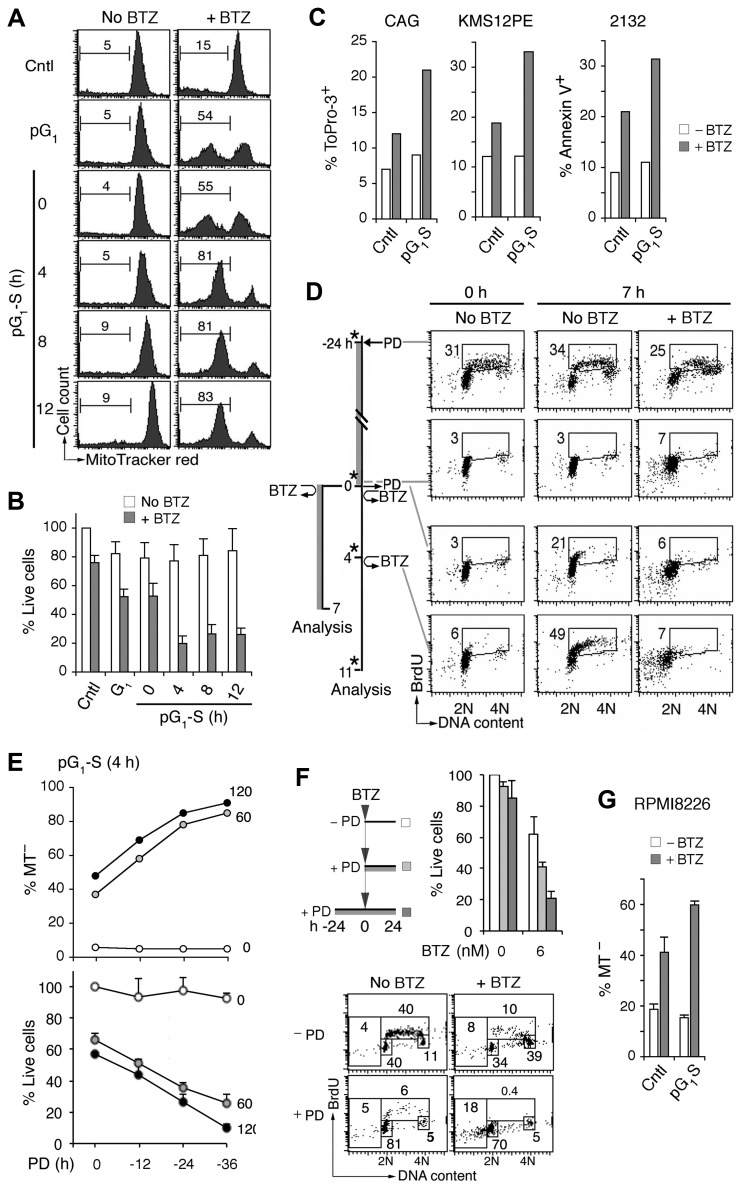
Figure 2.
Sensitization of myeloma cells to cytotoxic killing in pG1 and pG1-S. (A) MM1.S cells prolonged arrest in early G1 (pG1) by PD (24 hours), synchronized into S-phase for the time indicated (pG1-S), or without PD treatment (Cntl), were pulsed with bortezomib (BTZ, 60nM) for 1 hour or left untreated (No BTZ). Cell death was determined by the loss of MitoTracker Red (MT−) at 7 hours from BTZ pulsing. (B) “% Live cells” indicates the number of live cells relative to untreated Cntl cells determined after BTZ pulsing. (C) HMCL CAG and KMS12PE cells were pulsed with BTZ (120nM) for 1 hour in pG1-S (4 hours after PD withdrawal), and cell death was determined by ToPro-3 staining at 18 hours after BTZ pulsing. The 2132 cells were cultured similarly except that BTZ was used at 350nM and cell death was determined by annexin V staining. (D) FACS analysis of BrdU uptake and DNA content in pG1 and pG1-S MM1.S cells cultured as indicated in the schema. (E) MM1.S cells were pulsed with BTZ (1 hour, 60 or 120nM) at 4 hours after release from PD pretreatment for the time indicated. The percentages of live and dead cells were determined as in panel B, using cells untreated by PD or BTZ as a reference. (F) MM1.S cells were cultured with low BTZ with or without PD pretreatment as diagrammed, and analyzed for live cells as in panel E and BrdU uptake as in panel D. (G) RPMI8226 cells were cultured with 0.5μM PD for 24 hours and released into fresh media for 12 hours. The cells were then treated with BTZ (20nM) for 8 hours, and the percentage of MT− cells was determined. Data are representative of 5 independent experiments.

