

Abstract
Although it is well established that remembering an item will bring to mind memories of other semantically related items (Bousfield, 1953), the neural basis of this phenomenon is poorly understood. We studied how the similarity relations among items influence their retrieval by analyzing electrocorticographic recordings taken as 46 human neurosurgical patients studied and freely recalled lists of words. We first identified semantic components of neural activity that varied systematically with the meanings of each studied word, as defined by latent semantic analysis (Landauer and Dumais, 1997). We then examined the dynamics of these semantic components as participants attempted to recall the previously studied words. Our analyses revealed that the semantic components of neural activity were spontaneously reactivated during memory search, just before recall of the studied words. Further, the degree to which neural activity correlated with semantic similarity during recall predicted participants' tendencies to organize the sequences of their responses on the basis of semantic similarity. Thus, our work shows that differences in the neural correlates of semantic information, and how they are reactivated before recall, reveal how individuals organize and retrieve memories of words.
Introduction
According to distributed memory models, our knowledge concerning a given concept is represented by its similarity to other concepts stored in memory, where each concept may be defined as a set of abstract semantic attributes, each activated to varying degrees (Semon, 1923; Guthrie, 1935; Plaut and McClelland, 2010). Activating the representation of a concept entails activating its constituent semantic attributes. Because similar concepts are comprised of overlapping semantic attributes, activating the neural representation of a given concept will, in turn, partially activate representations of other similar concepts. In this way, distributed memory models provide an elegant explanation for a number of well known similarity effects observed in the psychological laboratory. For example, when asked to recall a previously studied list of words in any order, people tend to recall semantically similar words together even when they were studied in widely spaced list positions (Bousfield, 1953; Howard and Kahana, 2002). People also make faster transitions between recalls of semantically similar words (Patterson et al., 1971) and exhibit a striking tendency to incorrectly recall and recognize words that share a high degree of similarity with multiple study-list words (Deese, 1959; Roediger and McDermott, 1995; Kahana et al., 2007).
Whereas behavioral studies provide indirect evidence that the brain organizes conceptual representations by their semantic attributes, functional magnetic resonance imaging (fMRI) studies over the past decade have begun to more directly examine the neural representations of concepts. Early fMRI studies showed that viewing (Haxby et al., 2001; Cox and Savoy, 2003; Shinkareva et al., 2008) or thinking about (Polyn et al., 2005) words from similar taxonomic semantic categories evokes similar blood-oxygen level-dependent (BOLD) signatures. Over the past several years, researchers have gone beyond the neural representations of taxonomic categories [e.g., tools and dwellings (Shinkareva et al., 2008)] and have now begun to study the neural representations of individual concepts. Here we use the term “individual concept” to refer to a specific exemplar within a taxonomic category [e.g., “hammer” and “igloo” (Mitchell et al., 2008)]. This work has shown that one can use a word's semantic properties to make accurate predictions about its BOLD signature (Mitchell et al., 2008; Just et al., 2010) and that the neural response to a viewed object is attenuated when a similar object is viewed first (Yee et al., 2010). An additional finding of this line of research has been that the neural representations of individual concepts and taxonomic categories appear to be reasonably well conserved across individuals (Mitchell et al., 2008; Shinkareva et al., 2008; Just et al., 2010). In the present study, we first use electrocorticographic (ECoG) recordings to examine the neural representations of individual concepts as they are studied and recalled during a memory task. We then asked whether (and how) these conceptual representations varied across individuals according to the ways participants organized their recalls of random word lists.
Materials and Methods
Overview.
We examined ECoG recordings from 46 neurosurgical patients who were implanted with subdural electrode arrays and depth electrodes during presurgical evaluation of a treatment for drug-resistant epilepsy. We analyzed the recorded ECoG signals in terms of specific time-varying oscillatory components of neural activity (Fig. 1). Previous research has implicated oscillatory activity at a variety of frequencies in reflecting the identities of individual letters (Jacobs and Kahana, 2009) and object categories (Liu et al., 2009) during memory encoding and retrieval (Fell et al., 2001; Paller and Wagner, 2002; Osipova et al., 2006; Sederberg et al., 2007a) and in contextual reinstatement (Manning et al., 2011). As the ECoG signals were recorded, patients volunteered to participate in a free-recall memory experiment, in which they studied lists of common nouns and then attempted to recall them verbally in any order following a brief delay. Over several sessions, each participant studied and recalled words from dozens of different word lists.
Figure 1.

Illustration of behavioral and electrophysiological methods. a, After studying a list of 15 words and performing a brief distracter task, a participant recalls as many words as he can remember, in any order. b, During each study presentation, and just before each recall event, we calculate the z-transformed oscillatory power at each recording electrode for each of 50 log-spaced frequencies between 2 and 100 Hz (2 × 100.0347x for x ϵ {0, …, 49}). c, We use PCA to find a smaller number of orthogonal dimensions that jointly account for a large proportion of the variation in the data shown in b (PCA is performed for all study and recall events simultaneously). We select principal components that vary with the meanings of the presented words for further analysis (see Materials and Methods).
Our general approach is illustrated in Figure 1 and closely follows that used by Manning et al. (2011). For each study and recall event, we convolved the voltage traces for each electrode with Morlet wavelets (wave number = 4) to construct an N-dimensional vector containing, for each electrode, estimates of the mean oscillatory power at each of 50 log-spaced frequencies between 2 and 100 Hz (2 × 100.0347x for x ϵ {0, …, 49}) during each study event (200–1600 ms relative to the word's appearance on screen) and recall event (−1000–0 ms relative to the start of vocalization). We then used principal components analysis (PCA) to distill these highly correlated neural features into a smaller number of orthogonal components. We used the Kaiser criterion to choose, for each recording session, the principal components that explained a substantial proportion of the variance in the original N-dimensional vectors (Kaiser, 1960).
Participants.
We tested 46 native-English-speaking patients with drug-resistant epilepsy who had arrays of subdural and/or depth electrodes surgically implanted for 1 to 4 weeks to localize the sites of seizure onset (Table 1). The clinical team determined the placement of these electrodes with the goal of localizing suspected epileptogenic foci and identifying functional regions to be avoided in surgery. Our research protocol was approved by the appropriate institutional review boards and informed consent was obtained from the participants and their guardians. Data were collected as part of a long-term multicenter study; previously published articles describe separate analyses conducted on subsets of these data (Sederberg et al., 2003, 2007a,b; Manning et al., 2011; Lega et al., 2012).
Table 1.
Patient and task information
| ID | HOSP | Age | Sex | Hand | ELC | COM | L LEN | SES | List | REC | REP | PLI | ELI |
|---|---|---|---|---|---|---|---|---|---|---|---|---|---|
| 1 | BW | 33 | F | R | 64 | 59 | 20 | 1 | 15 | 55 | 2 | 26 | 12 |
| 2 | BW | 51 | F | R | 40 | 89 | 20 | 1 | 15 | 66 | 2 | 8 | 1 |
| 3 | BW | 32 | M | R | 32 | 48 | 15 | 3 | 39 | 212 | 5 | 9 | 4 |
| 4 | BW | 40 | M | R | 96 | 62 | 15 | 2 | 20 | 82 | 5 | 38 | 28 |
| 5 | BW | 44 | M | R | 16 | 24.5 | 15 | 2 | 20 | 58 | 1 | 12 | 19 |
| 6 | BW | 27 | M | R | 64 | 21 | 15 | 2 | 20 | 76 | 49 | 12 | 3 |
| 7 | BW | 38 | M | R | 104 | 72.67 | 15 | 3 | 30 | 136 | 3 | 30 | 15 |
| 8 | CH | 13 | F | R | 64 | 114 | 20 | 1 | 12 | 59 | 0 | 2 | 1 |
| 9 | CH | 12 | F | R | 104 | 146 | 20 | 1 | 15 | 39 | 0 | 0 | 2 |
| 10 | CH | 15 | M | L | 128 | 85.67 | 20 | 3 | 30 | 90 | 1 | 12 | 8 |
| 11 | CH | 17 | M | R | 64 | 92 | 20 | 3 | 45 | 178 | 20 | 27 | 17 |
| 12 | CH | 15 | M | R | 123 | 157 | 20 | 1 | 15 | 86 | 3 | 6 | 3 |
| 13 | CH | 11 | M | R | 104 | 148 | 20 | 2 | 30 | 104 | 3 | 2 | 3 |
| 14 | CH | 14 | F | R | 72 | 131 | 20 | 1 | 15 | 104 | 2 | 7 | 5 |
| 15 | CH | 8 | F | R | 86 | 137 | 20 | 2 | 30 | 159 | 5 | 18 | 10 |
| 16 | CH | 17 | M | R | 84 | 123 | 20 | 1 | 14 | 30 | 2 | 9 | 12 |
| 17 | CH | 17 | M | L | 124 | 110.5 | 20 | 4 | 60 | 116 | 2 | 104 | 13 |
| 18 | CH | 20 | F | R | 128 | 97 | 15 | 2 | 24 | 114 | 2 | 9 | 4 |
| 19 | CH | 14 | M | R | 94 | 70 | 15 | 3 | 30 | 94 | 0 | 18 | 13 |
| 20 | CH | 17 | M | L | 80 | 42.5 | 15 | 2 | 20 | 14 | 0 | 10 | 22 |
| 21 | CH | 19 | F | R | 125 | 54.5 | 15 | 2 | 17 | 47 | 2 | 10 | 1 |
| 22 | CH | 16 | M | R | 156 | 126 | 15 | 1 | 16 | 76 | 1 | 4 | 1 |
| 23 | CH | 12 | M | L | 84 | 67.5 | 15 | 2 | 20 | 52 | 9 | 12 | 25 |
| 24 | CH | 13 | M | R | 72 | 65.25 | 15 | 4 | 40 | 200 | 3 | 4 | 2 |
| 25 | TJ | 25 | M | R | 62 | 111.33 | 15 | 3 | 48 | 232 | 3 | 6 | 1 |
| 26 | TJ | 40 | F | R | 94 | 99.75 | 15 | 4 | 64 | 164 | 8 | 54 | 43 |
| 27 | TJ | 39 | M | L | 56 | 79 | 15 | 1 | 16 | 53 | 1 | 8 | 20 |
| 28 | TJ | 34 | F | R | 112 | 113.2 | 15 | 10 | 154 | 513 | 7 | 110 | 24 |
| 29 | TJ | 44 | M | R | 126 | 74 | 15 | 1 | 13 | 31 | 1 | 7 | 6 |
| 30 | TJ | 43 | M | R | 80 | 81.75 | 15 | 4 | 64 | 232 | 139 | 71 | 29 |
| 31 | TJ | 21 | M | R | 122 | 138 | 15 | 3 | 48 | 145 | 1 | 32 | 47 |
| 32 | TJ | 56 | M | R | 50 | 67 | 15 | 2 | 48 | 120 | 5 | 98 | 43 |
| 33 | TJ | 20 | M | R | 160 | 99 | 15 | 3 | 42 | 167 | 0 | 13 | 18 |
| 34 | TJ | 41 | M | R | 98 | 125 | 15 | 2 | 32 | 100 | 2 | 18 | 98 |
| 35 | TJ | 34 | F | R | 90 | 89.25 | 15 | 4 | 51 | 204 | 49 | 34 | 207 |
| 36 | UP | 38 | M | R | 62 | 53 | 15 | 4 | 40 | 135 | 3 | 68 | 24 |
| 37 | UP | 30 | M | R | 86 | 65 | 15 | 2 | 20 | 54 | 5 | 24 | 21 |
| 38 | UP | 43 | M | R | 66 | 36.33 | 15 | 3 | 18 | 31 | 22 | 12 | 33 |
| 39 | UP | 36 | M | R | 88 | 78.75 | 15 | 4 | 40 | 70 | 6 | 114 | 50 |
| 40 | UP | 25 | M | R | 62 | 60.25 | 15 | 4 | 40 | 135 | 2 | 1 | 2 |
| 41 | UP | 18 | F | R | 76 | 77.33 | 15 | 3 | 30 | 104 | 5 | 6 | 3 |
| 42 | UP | 27 | F | R | 48 | 75.5 | 15 | 2 | 32 | 104 | 2 | 43 | 20 |
| 43 | UP | 55 | F | L | 80 | 106 | 15 | 2 | 32 | 81 | 11 | 61 | 24 |
| 44 | UP | 18 | M | A | 100 | 90.67 | 15 | 3 | 48 | 253 | 7 | 8 | 3 |
| 45 | UP | 38 | F | R | 86 | 98 | 15 | 1 | 16 | 48 | 14 | 3 | 73 |
| 46 | UP | 40 | M | R | 58 | 93.75 | 15 | 4 | 64 | 304 | 1 | 14 | 9 |
This table provides the hospital (HOSP) at which each patient's data were collected (BW, Brigham and Women's Hospital, Boston, MA; CH, Children's Hospital Boston, Boston, MA; TJ, Thomas Jefferson University Hospital, Philadelphia, PA; UP, Hospital of the University of Pennsylvania, Philadelphia, PA), as well as each patient's age, gender (Sex), handedness or language mapping (Hand), number of implanted electrodes (ELC), and mean number of neural components selected for analysis across all sessions for that patient (COM). Information about the task includes the list length (L LEN) used for each participant, number of testing sessions (SES), and the number of lists each participant encountered across all sessions (List). Performance information includes the total number of correct recalls across all lists (REC), the total number of repeated recalls (REP), and the total number of incorrect recalls, which includes recalls of previously-presented words [prior list intrusions (PLI)] and recalls of words which were never presented [extra-list intrusions (ELI)]. In total, the 46 patients contributed 3970 electrodes and 4055 selected components, studying 24,760 words presented in 1552 lists.
Recording methods.
Subdural strip, grid, or depth electrodes (Ad-Tech) were implanted by neurosurgical teams solely for clinical purposes. The locations of the electrodes were determined using coregistered postoperative computed tomography and preoperative or postoperative MRIs by an indirect stereotactic technique. We then converted the electrode locations into MNI coordinates. ECoG signals were recorded referentially (using an electrode attached to the patient's skin as the reference) using a Bio-Logic, XLTek, Neurofile, or Nicolet EEG digital video-EEG system. Depending on the amplifier, signals were sampled at 200, 256, 500, 512, or 1024 Hz. Several hospitals applied bandpass filters to the recorded signals before writing to disk (Brigham and Women's Hospital: 0.5–60 Hz; Children's Hospital Boston: 0.3–50 Hz). Before analysis, the voltage traces recorded from each contact were re-referenced by subtracting the average signal recorded from all contacts on the same strip, grid, or depth electrode (after excluding contacts deemed by our clinical teams to be recording from epileptic tissue). Data were subsequently notch-filtered using a Butterworth filter with zero phase distortion at 60 Hz to eliminate electrical line and equipment noise. Where applicable (for Brigham and Women's Hospital and Children's Hospital Boston patients), frequencies outside of the filtered range were also excluded from further analysis. ECoG signals and behavioral events were aligned using synchronization pulses sent from the testing computer (mean precision <4 ms).
Behavioral methods.
Participants studied lists of 15 or 20 high-frequency nouns for a delayed free-recall task. Following a fixation cue, the computer displayed each word for 1600 ms followed by an 800–1200 ms blank interstimulus interval. Each word was displayed no more than once within a single testing session. For 18 s following list presentation, participants solved a series of single-digit addition problems of the form A + B + C = X. Participants were then given 45 s to recall the studied words in any order. Vocal responses, digitally recorded during the trial, were scored for subsequent analysis. Participants recalled 22.1 ± 1.1% (mean ± SEM) of the studied words. Repetitions and incorrect recalls (28.0 ± 3.0% of all responses) were excluded from our analyses, as were responses that occurred within 1 s of a prior vocalization.
Quantifying the degree of semantic clustering.
Several of our analyses use a measure of the degree to which participants clustered their recalls according to semantic similarity. This measure, termed the semantic clustering score, has been described previously (Polyn et al., 2009) and is calculated as follows. For each recall transition, we create a distribution of semantic similarity values [latent semantic analysis (LSA) cosθ] (Landauer and Dumais, 1997) between the just-recalled word and the set of words that have not yet been recalled. We next generate a percentile score by comparing the semantic similarity value corresponding to the next word in the recall sequence with the rest of the distribution. Specifically, we calculate the proportion of the possible similarity values that the observed value is greater than, since strong semantic clustering will cause the observed similarity values to be larger than average. When there is a tie, we score this as the percentile falling halfway between the two words. If the participant always chose the closest semantic associate, then their semantic clustering score would be 1. A semantic clustering score of 0.5 indicates no effect of semantic clustering. Each participant was assigned a semantic clustering score by taking the average of the percentile scores across all observed recall transitions.
Selecting candidate semantic components.
We sought to identify PCA-derived components of neural activity that might represent the semantic attributes of the studied words (Fig. 1c). Consider the lth list of a recording session. We first generated the set of unique pairs, disregarding order, of the presented words on the list (for a list of 15 words, this set contains 105 pairs). We then computed the semantic similarity (LSA cosθ) between the words in each pair. Let s⃗ denote the vector of semantic similarity values for each pair of words on the list.
We next examined each PCA-derived neural component (Fig. 1c). Let xi,nj denote the value of the ith neural component during the presentation of the njth word on the list. For each of the unique pairs of words on the list, we computed the absolute difference in the value of the ith neural component, |xi,m − xi,n|, where m and n each denote a word in a single unique pair. Let d⃗i denote the vector of absolute differences in the value of the ith neural component during the presentations of each pair of words on the list.
We computed the Pearson's correlation between s⃗ and − d⃗i to obtain a single correlation coefficient, ri, and an associated p value for each neural component. Following Manning et al. (2011), we chose to compute these correlations for each individual list (rather than combining across lists) to reduce the influence of slow drift in the ECoG activity and in the recording equipment that would limit our ability to directly compare neural patterns recorded during different parts of the experiment. We then used the Fisher z-prime transformation (a standard variance-stabilizing transform used when combining correlation coefficients) (Fisher, 1915; Hotelling, 1953) and the inverse Normal transformation to compute an across-list summary correlation coefficient, r̄i, and an associated p value, p̄i, for each neural component (Manning et al., 2011). We selected components with r̄i > 0 and p̄i < 0.05 for further analysis (see Results, below).
Results
Distributed memory models posit that concepts are represented by overlapping sets of semantic attributes. We identified PCA-derived components of neural activity that varied systematically with the semantic properties of the studied words in each of the 46 participants we examined (see Materials and Methods, above; Table 1). We found that certain frequencies tended to weight more heavily in the PCA coefficients of the selected components (repeated-measures ANOVA on mean coefficients for each participant across five frequency bands: F(4,45) = 8.13, p < 10−4). Post hoc t tests indicated that lower frequencies tended to dominate the selected components [δ (2–4 Hz) > θ (4–8 Hz), α (8–12 Hz), β (12–30 Hz), and γ (30–100 Hz): ts > 3, ps < 0.005; θ, α, and β > γ: ts > 2.6, ps < 0.015].
If the selected neural components (henceforth feature vectors) truly represent the semantic attributes of the studied words, one should observe a positive correlation between neural and semantic similarity each time the participants think of the studied words—not only during study (when the feature vectors were identified), but also during recall. We thus selected the feature vectors for further study. For each participant, we computed the cosine similarity (normalized dot product) between the feature vectors from each pair of recalls they made (if a participant recalled n words from a given list, then we computed (n2 − n)/2 cosine similarities for that set of recalls; Fig. 2a). We also computed the semantic similarity (LSA cosθ) between each pair of recalled words (Fig. 2b). Concatenating the similarities across lists, we regressed the neural similarities on the semantic similarities and obtained a t value for the β coefficient of the regression for each participant.
Figure 2.

Constructing similarity matrices a, Neural recordings are processed into sets of neural features. Each feature is the mean power at a specific frequency, recorded from a single electrode during a particular presentation or recall. After applying PCA to these neural features and selecting components that vary systematically with the meanings of the presented words (Fig. 1c), we construct a neural similarity matrix by measuring the cosine similarity between the feature vectors for each pair of recalled words. b, We use LSA (Landauer and Dumais, 1997) to estimate the similarity in meaning between each pair of words. We analyzed the Touchstone Applied Science Associates corpus to obtain word counts for each document in the corpus. After removing stop words and applying the singular value decomposition to the counts matrix (middle), we obtain LSA vectors for each word. We obtain a semantic similarity matrix by measuring the cosine similarity between the vectors for each pair of words.
If a participant shows a strong correspondence between neural and semantic similarity (as evidenced by a high t value in the regression), then we consider them to exhibit neural clustering in the sense that neural patterns associated with words that are similar in meaning (according to LSA) will be clustered nearby in their neural space (where each point in neural space is a pattern of neural activity). A low t value indicates that, for the given participant, words similar in meaning will be no closer in neural space than words that are not similar in meaning. Figure 3 shows neural and semantic similarity matrices for two participants. One might not expect to find a significant relation between neural and semantic similarity when aggregating data across all electrodes, given that semantic representations might be localized to specific brain regions. Nonetheless, a t test on the distribution of t values showed that the relation between neural and semantic similarity was reliably maintained during the 1 s interval leading up to vocalization of a recalled word (t(45) = 2.28, p = 0.03). Note that during the interval being measured, the words were neither being displayed onscreen nor vocalized by the participants. Rather, the neural patterns recorded just before recall reflect internally generated semantic representations.
Figure 3.
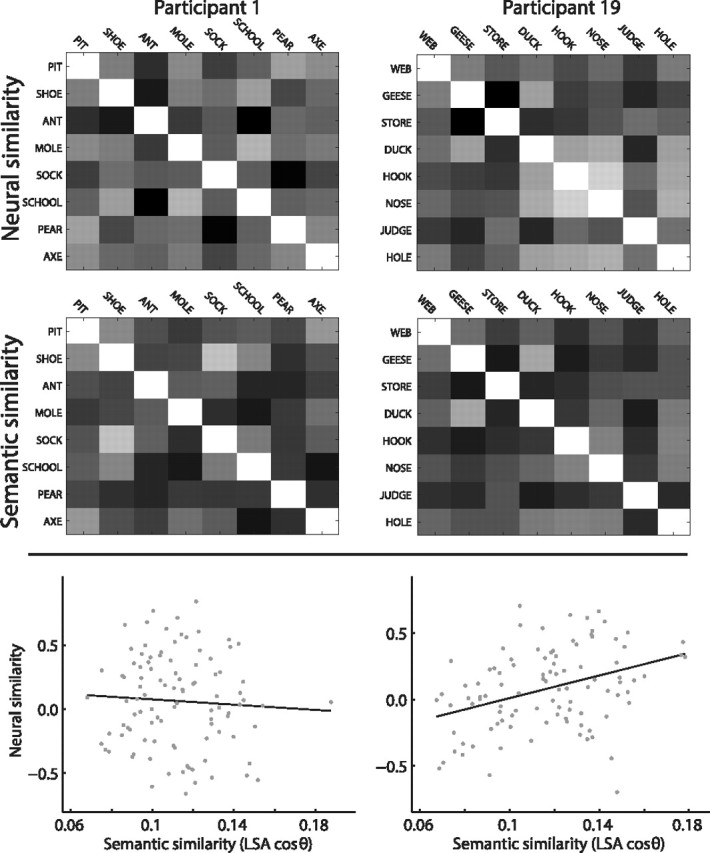
Comparing neural and semantic similarity. We obtain neural and semantic similarity matrices for each participant (Fig. 2). Example similarity matrices are shown in the top and middle rows (lighter shading indicates greater similarity). Participant 1 (left) does not show a reliable correspondence between neural and semantic similarity. The relation between neural and semantic similarity is shown in the scatterplot (bottom); each dot represents an average of 1% of the pairwise similarities for the words that the participant recalled (100 dots total; correlation between neural and semantic similarity: r = −0.06, p = 0.54). Participant 19 (right) shows a strong correspondence between neural and semantic similarity (r = 0.37, p < 10−3).
A number of studies have shown that certain brain regions play a particularly strong role in representing semantic information during cognition. For example, Broca's and Wernicke's areas in the inferior frontal and superior temporal lobe, respectively, are well known for their role in semantic processing (Démonet et al., 1992); the prefrontal cortex and temporal lobe have been found to support semantic clustering during free recall (Long et al., 2010); and the occipital lobe is activated during visual recall (Le Bihan et al., 1993). To test whether the semantic information we measured was specific to particular brain regions, we repeated our semantic feature selection process for electrodes in each of the following brain regions: temporal lobe, medial temporal lobe, hippocampus, frontal lobe, prefrontal cortex, parietal lobe, and occipital lobe (Fig. 4a). Any participant with at least one electrode in a given region of interest was included in the analysis for that region. We found that semantic components (selected during encoding and measured just before recall) varied with the meanings of recalled words in the temporal lobe (t(45) = 2.88, p = 0.006), frontal lobe (t(41) = 3.56, p = 0.001), prefrontal cortex (t(41) = 3.33, p = 0.002), and occipital lobe (t(26) = 3.64, p = 0.001). The medial temporal lobe (t(41) = −0.17, p = 0.86), hippocampus (t(17) = 0.47, p = 0.64), and parietal lobe (t(31) = −0.16, p = 0.88) did not show such patterns.
Figure 4.

Neural activity predicts clustering during recall. a, Each dot marks the location of a single electrode from our dataset in MNI space. We divided our dataset into seven ROIs: temporal lobe (Temp; 1358 electrodes), medial temporal lobe (MTL; 524 electrodes), hippocampus (Hippo; 130 electrodes), frontal lobe (FR; 1369 electrodes), prefrontal cortex (PFC; 984 electrodes), parietal lobe (Par; 336 electrodes), and occipital lobe (Occ; 102 electrodes). b, The height of each bar indicates the correlation, across participants, between semantic clustering during recall (see Materials and Methods) and the correlation between neural and semantic similarity. Each bar corresponds to a single ROI (same color scheme as in a). The bar marked “All” indicates this correlation for all electrodes in the dataset. Error bars denote ± SEM, estimated as (1 − r2)/. The symbols indicate the p values for each correlation: #p < 0.1, *p < 0.05, **p < 0.01.
To localize the semantic representations, for each pair of regions we performed paired t tests between the distributions of t values from the regressions of neural similarity on semantic similarity for all participants with electrodes in both regions. When compared with either medial temporal or hippocampal electrodes, we found that temporal, frontal, and occipital electrodes all showed reliably stronger semantic effects (ps < 0.05 for all tests). Note that the temporal lobe electrodes we analyzed were a superset of the medial temporal lobe electrodes, which were in turn, a superset of the hippocampal electrodes. Nonetheless, the temporal lobe as a whole exhibited stronger effects than either the medial temporal lobe or hippocampus alone. We also found that prefrontal electrodes exhibited stronger semantic effects than parietal electrodes (t(28) = 2.28, p = 0.03). Together, our results suggest that semantic information is most strongly represented by temporal, prefrontal, and occipital networks, and less so by medial temporal and parietal networks.
Having identified a set of candidate semantic representations, we hypothesized that subtle differences in the structure of these neural patterns would be reflected in how participants organized their recalls. For example, suppose that participant A organizes her memories primarily based on the meanings of the studied words, whereas participant B organizes his memories based on the shapes of the objects represented by the words. One might expect participant A (but not B) to successively recall words such as apple and banana if both words had appeared on the studied list. In contrast, participant B would be more likely to successively recall apple and ball. According to distributed memory models, participant A's conceptual representations should favor attributes related to the meanings of the words, whereas participant B's should favor attributes related to the shapes of the objects the words represent. More generally, we hypothesized that participants exhibiting strong correlations between neural and semantic similarity would also semantically cluster their recalls. To test this hypothesis, we examined the t values from the regressions of neural similarity on semantic similarity (one t value per participant). We also computed the degree to which each participant clustered their recalls by semantic similarity using their semantic clustering score (see Materials and Methods, above). We then computed the correlation between these measures of neural and behavioral organization separately for electrodes in each region we examined (Fig. 4). We found significant correlations between neural and behavioral clustering in the temporal lobe (r = 0.33, p = 0.02), frontal lobe (r = 0.42, p = 0.006), and prefrontal cortex (r = 0.49, p = 0.001). As reported above, across the 18 participants who had hippocampal electrodes, patterns of hippocampal oscillatory activity did not reliably correlate with semantic similarity, suggesting that the hippocampus does not represent the meanings of words. Interestingly, we found that this overall pattern obscures the variability in the effect across participants. Although this variability could simply reflect measurement noise, we found that the degree to which participants exhibited correlations between neural and semantic similarity in their hippocampal electrodes predicted their tendencies to semantically cluster their recalls (r = 0.45, p = 0.06). This is consistent with a model whereby the hippocampus is involved in organizing or retrieving the memories of the words, but not in representing them per se. However, although the occipital lobe activity varied with the meanings of recalled words, we found no evidence that this activity was modulated by semantic clustering (r = 0.00, p = 0.99). This indicates that occipital lobe structures represent the meanings of the studied words but do not organize these conceptual representations in memory.
To gain additional insight into our results, let us suppose that all neural activity of a given participant during the experiment is represented by the boxed diagram in Figure 5 (left). As indicated in the figure, a subset of the neural patterns exhibited by the participant is involved in representing the meanings of the list words (red circle), and an overlapping subset of patterns underlies the sequences of recalls the participant makes (blue circle). Our analysis captures only a subset of these patterns (yellow circle). Across-participant differences in the central segment (D) give rise to the observed correlation between neural and behavioral clustering (Fig. 4b). However, this correlation can be explained either by differences in the way participants represent words (i.e., driven by the patterns represented by the red circle) or differences in the neural patterns that drive behavior (blue circle). In this way, our finding that neural and behavioral clustering are correlated is consistent with two general interpretations. One interpretation is that, whereas the neural representations of concepts are roughly conserved across individuals, the ways people organize the memories of the studied words are not conserved: some people semantically cluster their recalls and others do not. The second possible interpretation is more subtle. Our measure of semantic clustering relies on LSA, a model-based approach that makes assumptions about which words are similar in meaning. It is possible that the LSA-derived similarities match some participants' individual notions of which words are similar better than others. Under this interpretation, even if all participants clustered their recalls only according to the meanings of the words, it would appear as though not all participants were doing so, simply because we were using the wrong measure of similarity for some of the participants. According to this second interpretation, the observed correlation between neural and semantic clustering is driven by differences in how the words themselves are represented, rather than by differences in participants' strategies (for further discussion of this issue, see Manning and Kahana, 2012).
Figure 5.

Interpreting components of neural activity. The box on the left represents the full pattern of neural activity exhibited by a given participant (i) during the experiment. A subset of these neural patterns is related to the meanings of the words on the list (red circle) and an overlapping subset of patterns underlies the sequences of recalls the participant will make after each list (blue circle). The yellow circle represents the patterns of activity captured by our analysis (Fig. 1). Our feature selection framework identifies neural patterns in segments C and D. Segment C represents selected components of neural activity that do not appear to be behaviorally relevant (e.g., occipital lobe). Segments A and D represent all neural patterns in the participant's brain that contribute to semantic clustering, but our analysis (and recording methods) only captures patterns in segment D (e.g., prefrontal cortex, lateral temporal lobe). Segments B and D represent all behaviorally relevant neural patterns captured by our analysis. Neural patterns in segment B (e.g., hippocampus; for additional details, see Results) contain information about the order in which the participant will recall the words on the list, but do not appear to represent the meanings of the presented words.
To help distinguish between these two interpretations, we used a second measure of semantic similarity based on word association spaces (WAS) (Steyvers et al., 2004). Whereas LSA similarity is derived from an automated analysis of a large text corpus (Landauer and Dumais, 1997), WAS similarity is derived from a series of free association experiments in which participants were given a cue word and responded with the first word that came to mind (Nelson et al., 2004; Steyvers et al., 2004). For the words presented to participants in our study, these two measures of semantic similarity are reliably, though weakly, correlated (r = 0.26, p < 10−3; Spearman's ρ = 0.18, p < 10−3). We found that the degree to which participants clustered their recalls by LSA- and WAS-derived similarity (semantic clustering score; see Materials and Methods, above) were reliably correlated (r = 0.30, p = 0.04). Further, the degree to which participants exhibited correlations between their neural activity and LSA-derived semantic similarity also predicted the degree to which their neural activity and WAS-derived semantic similarity were correlated (r = 0.40, p = 0.006). Because our analyses yield similar results using both measures of semantic similarity, this provides some evidence that the observed correlation between neural and semantic clustering is driven by across-participant differences in the way relations between the words are organized, rather than the way individual words are represented. This finding is also in agreement with recent fMRI studies showing that the neural representations of words are conserved across individuals (Mitchell et al., 2008; Shinkareva et al., 2008; Just et al., 2010).
Discussion
The preceding analyses advance our understanding of how our brains represent, store, and retrieve conceptual information in two critical areas. First, we demonstrate that the patterns of neural activity in temporal, prefrontal, and occipital cortices just before recall of a word reflect the similarity of that word to other recalled words. This lends direct support for the hypothesis that concepts are represented by distributed patterns of neural activity, and extends this hypothesis to apply to conceptual representations spontaneously retrieved during memory search. Second, whereas previous studies have shown that the neural representations of individual concepts are conserved across individuals (Mitchell et al., 2008; Shinkareva et al., 2008; Just et al., 2010), we found that individual differences in how concepts are represented in temporal and frontal (but not occipital) cortices can be used to predict the order in which an individual will recall a list of words. This indicates that temporal and frontal networks organize conceptual information by representing relationships among stored concepts. Our approach is closely related to representational similarity analysis (Kriegeskorte et al., 2008) in that we use the similarities in neural patterns evoked by different words to gain insights into the relation between neural activity and behavior rather than examining the neural patterns directly.
Clustering effects
Our study examined the degree to which participants semantically organize their memories. However, it is also well known that participants organize remembered information according to the temporal context in which the information was learned (Kahana, 1996; Howard and Kahana, 1999; Polyn and Kahana, 2008). Indeed, Manning et al. (2011) showed that the same general approach used in the present study can be used to track the neural representations of the temporal contexts in which words are studied. We identified patterns of neural activity that changed gradually over the course of a studied list. These gradually changing neural patterns were reinstated just before recall. Further, the degree to which this phenomenon was observed in individual participants predicted the degree to which they would successively recall words presented at neighboring positions on the studied lists.
Another link between our study and that of Manning et al. (2011) concerns the anatomical specificity of the neural signatures of temporal and semantic clustering. Manning et al. (2011) found neural signatures of temporal context reinstatement and temporal clustering in temporal and frontal cortices. In the present study, we also found neural signatures of semantic reinstatement and semantic clustering in temporal and frontal cortices. In addition, we found evidence that semantic information in the occipital lobe is reactivated just before recall, although these occipital reactivations did not predict semantic clustering.
Together, these studies are consistent with a model whereby occipital cortex represents the meanings of each newly studied word. These representations are then communicated to the temporal and frontal lobes, where memories are organized by meaning and tagged with the temporal context in which the word was studied. These memories can be retrieved by internally generated semantic or temporal (episodic) cues. An important goal for future studies will be to clarify the extent to which the semantic and episodic pathways for recall interact. Our general approach could be adapted to study the interaction between semantic and temporal clustering, or almost any other form of memory organization, simply by adjusting the way in which neural features are selected (Fig. 1c) and by measuring the extent to which individual participants relied on the organizational scheme of interest (analogous to semantic clustering score in the present study).
“Mind reading” using neuroimaging techniques
Several recent neuroimaging studies have made important progress toward interpreting neural patterns as meaningful stimuli and thoughts. These studies can be divided into two general groups: sensorimotor decoding and semantic decoding. We next briefly review this line of research as it relates to our present work.
Sensorimotor decoding
Hubel and Wiesel (1962)'s classic studies uncovered systematic mappings from simple retinal images to patterns of firing in individual neurons in (cat) primary visual cortex. However, the way in which complex images are represented in primary (and higher) visual cortices is less well understood. Recent advances in inferring complex retinal images from patterns of neural activity in human visual cortex come from a series of fMRI studies. Rather than explicitly accounting for the known retinotopy in early visual cortex, Miyawaki et al. (2008) decomposed presented 10 × 10 binary patches into linear combinations of rectangular basis images. They then used multivariate fMRI signals in early visual cortex to predict the degree to which each basis image was activated while viewing each image. After training, their decoder was able to reconstruct the viewed patches from observed fMRI signals with well-above-chance accuracy. A similar approach was taken by Kay et al. (2008). Participants viewed a large number of grayscale natural images, and the fMRI signals recorded during each viewing were used to estimate the receptive fields of each voxel in visual areas V1, V2, and V3. The participants then viewed a new set of 120 previously unseen images, and the researchers showed that their trained model could use the observed fMRI signals to predict which image was being viewed. In exciting extensions of this work, similar approaches were used to decode movie clips (Nishimoto et al., 2011) and spoken words (Pasley et al., 2012).
In addition to decoding sensory inputs to the brain, researchers have also begun to decode intended movements from electrical patterns recorded from the brains of paralyzed patients. Although the topographic organization of the primary motor cortex is relatively well understood (Grünbaum and Sherrington, 1901; Penfield and Boldrey, 1937), modern brain–computer interfaces are often driven by brain oscillations that the patient learns to modulate, or by the P300 EEG response (for review, see Donoghue, 2002).
Semantic decoding
Whereas sensorimotor decoding studies attempt to infer sensory inputs or motor outputs from patterns of neural activity, the goal of semantic decoding is to infer the meanings represented by the recorded patterns. Just as the above visual and auditory decoding studies attempt to decode arbitrary stimuli from observed patterns of neural activity using a trained set of basis images (or spectral features), several recent semantic decoding studies also rely on basis features. In a study by Mitchell et al. (2008), participants viewed pictures of 60 common nouns. The researchers came up with a set of 25 semantic attributes including words like “eat,” “manipulate,” and “run.” Using co-occurrence statistics derived from a large text corpus, the researchers predicted the patterns of BOLD activations associated with each of the semantic attributes. By combining these predicted activation patterns, the researchers estimated the patterns that would be evoked by previously unseen words with surprising accuracy. [A similar approach was taken by Just et al. (2010) using just three semantic attributes.]
Our study draws inspiration from Mitchell et al.'s (2008) work by identifying components of neural activity that appear to represent semantic attributes. However, whereas stimulus-specific patterns in the above sensorimotor and semantic decoding studies were evoked by viewing images on a computer screen, the neural patterns in our study emerged spontaneously during memory search. In addition, whereas the above studies attempted to use neural activity to infer which stimulus was being viewed, our goal was to infer how representations of the studied stimuli were organized in participants' memories.
Concluding remarks
Psychologists have long known that the ability to learn new information is closely linked with the ability to organize that information in relation to one's prior knowledge (Postman, 1967; Tulving, 1968). Evidence for this relation between learning and organization comes from the finding that people recall randomly structured study materials in a highly organized manner, with this organization reflecting both the semantic similarities among items and the similarities in their encoding contexts (Klein et al., 2005). Whereas previous brain imaging studies have documented striking neural correlates of item similarity, the critical question of whether these neural correlates of similarity determine the organization of newly learned information remains largely unanswered.
The present study demonstrates that spontaneously reactivated patterns of neural activity in human frontal and temporal cortices, as well as hippocampus, predict the way participants cluster their recalls according to the semantic similarities among the studied words. From these results, and parallel findings concerning the neural correlates of temporal clustering (Manning et al., 2011; Howard et al., 2012) a portrait of the brain mechanisms underlying memory organization is beginning to emerge. An intriguing feature of this portrait is that medial temporal lobe regions, including hippocampus, which do not appear to be strongly implicated in representing the semantic similarities among items, do appear to be critical for predicting how those similarities influence the organization of retrieval. Other regions, such as occipital cortex, do appear to represent similarities among studied items, but do not appear to be critical for the organization of retrieval.
Footnotes
This work was supported by National Institutes of Health Grants MH088118, MH61975, and MH55687. We thank Geoffrey Aguirre, David Brainard, Joshua Jacobs, Lynn Lohnas, Nicole Long, Alan Osman, Saul Sternberg, and Alan Stocker for useful discussions, and Talia Manning for help with illustrations. The content is solely the responsibility of the authors and does not necessarily represent the official views of our supporting organizations.
References
- Bousfield WA. The occurrence of clustering in the recall of randomly arranged associates. J Gen Psychol. 1953;49:229–240. [Google Scholar]
- Cox DD, Savoy RL. Functional magnetic resonance imaging (fMRI) “brain reading”: detecting and classifying distributed patterns of fMRI activity in human visual cortex. Neuroimage. 2003;19:261–270. doi: 10.1016/s1053-8119(03)00049-1. [DOI] [PubMed] [Google Scholar]
- Deese J. On the prediction of occurrence of particular verbal intrusions in immediate recall. J Exp Psychol. 1959;58:17–22. doi: 10.1037/h0046671. [DOI] [PubMed] [Google Scholar]
- Démonet J, Chollet F, Ramsay S, Cardebat D, Nespoulous J, Wise R, Rascol A, Frackowiak R. The anatomy of phonological and semantic processing in normal subjects. Brain. 1992;115:1753–1768. doi: 10.1093/brain/115.6.1753. [DOI] [PubMed] [Google Scholar]
- Donoghue JP. Connecting cortex to machines: recent advances in brain interfaces. Nat Neurosci. 2002;5:1085–1088. doi: 10.1038/nn947. [DOI] [PubMed] [Google Scholar]
- Fell J, Klaver P, Lehnertz K, Grunwald T, Schaller C, Elger CE, Fernández G. Human memory formation is accompanied by rhinal-hippocampal coupling and decoupling. Nat Neurosci. 2001;4:1259–1264. doi: 10.1038/nn759. [DOI] [PubMed] [Google Scholar]
- Fisher RA. Frequency distribution of the values of the correlation coefficient in samples from an indefinitely large population. Biometrika. 1915;10:507–521. [Google Scholar]
- Grünbaum AS, Sherrington CS. Observations on the physiology of the cerebral cortex of some of the higher apes. Proc Roy Soc Lond. 1901;69:206–209. [Google Scholar]
- Guthrie ER. The psychology of learning. New York: Harper; 1935. [Google Scholar]
- Haxby JV, Gobbini MI, Furey ML, Ishai A, Schouten JL, Pietrini P. Distributed and overlapping representations of faces and objects in ventral temporal cortex. Science. 2001;293:2425–2430. doi: 10.1126/science.1063736. [DOI] [PubMed] [Google Scholar]
- Hotelling H. New light on the correlation coefficient and its transforms. J Royal Stat Soc B Stat Meth. 1953;15:193–232. [Google Scholar]
- Howard MW, Kahana MJ. Contextual variability and serial position effects in free recall. J Exp Psychol Learn Mem Cogn. 1999;25:923–941. doi: 10.1037//0278-7393.25.4.923. [DOI] [PubMed] [Google Scholar]
- Howard MW, Kahana MJ. When does semantic similarity help episodic retrieval? J Mem Lang. 2002;46:85–98. [Google Scholar]
- Howard MW, Viskontas IV, Shankar KH, Fried I. Ensembles of human MTL neurons “jump back in time” in response to a repeated stimulus. Hippocampus. 2012 doi: 10.1002/hipo.22018. In press. [DOI] [PMC free article] [PubMed] [Google Scholar]
- Hubel DH, Wiesel TN. Receptive fields, binocular interaction and functional architecture in the cat's visual cortex. J Physiol. 1962;160:106–154. doi: 10.1113/jphysiol.1962.sp006837. [DOI] [PMC free article] [PubMed] [Google Scholar]
- Jacobs J, Kahana MJ. Neural representations of individual stimuli in humans revealed by gamma-band ECoG activity. J Neurosci. 2009;29:10203–10214. doi: 10.1523/JNEUROSCI.2187-09.2009. [DOI] [PMC free article] [PubMed] [Google Scholar]
- Just MA, Cherkassky VL, Aryal S, Mitchell TM. A neurosemantic theory of concrete noun representation based on underlying brain codes. PLoS One. 2010;5:e8622. doi: 10.1371/journal.pone.0008622. [DOI] [PMC free article] [PubMed] [Google Scholar]
- Kahana MJ. Associative retrieval processes in free recall. Mem Cognit. 1996;24:103–109. doi: 10.3758/bf03197276. [DOI] [PubMed] [Google Scholar]
- Kahana MJ, Zhou F, Geller AS, Sekuler R. Lure-similarity affects visual episodic recognition: detailed tests of a noisy examplar model. Mem Cognit. 2007;35:1222–1232. doi: 10.3758/bf03193596. [DOI] [PMC free article] [PubMed] [Google Scholar]
- Kaiser HF. The application of electronic computers to factor analysis. Educ Psychol Meas. 1960;20:141–151. [Google Scholar]
- Kay KN, Naselaris T, Prenger RJ, Gallant JL. Identifying natural images from human brain activity. Nature. 2008;452:352–355. doi: 10.1038/nature06713. [DOI] [PMC free article] [PubMed] [Google Scholar]
- Klein KA, Addis KM, Kahana MJ. A comparative analysis of serial and free recall. Mem Cognit. 2005;33:833–839. doi: 10.3758/bf03193078. [DOI] [PubMed] [Google Scholar]
- Kriegeskorte N, Mur M, Bandettini P. Representational similarity analysis: connecting the branches of systems neuroscience. Front Syst Neurosci. 2008;2:4. doi: 10.3389/neuro.06.004.2008. [DOI] [PMC free article] [PubMed] [Google Scholar]
- Landauer TK, Dumais ST. Solution to Plato's problem: the latent semantic analysis theory of acquisition, induction, and representation of knowledge. Psychol Rev. 1997;104:211–240. [Google Scholar]
- Le Bihan D, Turner R, Zeffiro TA, Cuénod CA, Jezzard P, Bonnerot V. Activation of human primary visual cortex during visual recall: a magnetic resonance imaging study. Proc Natl Acad Sci U S A. 1993;90:11802–11805. doi: 10.1073/pnas.90.24.11802. [DOI] [PMC free article] [PubMed] [Google Scholar]
- Lega BC, Jacobs J, Kahana M. Human hippocampal theta oscillations and the formation of episodic memories. Hippocampus. 2012;22:748–761. doi: 10.1002/hipo.20937. [DOI] [PubMed] [Google Scholar]
- Liu H, Agam Y, Madsen JR, Kreiman G. Timing, timing, timing: fast decoding of object information from intracranial field potentials in human visual cortex. Neuron. 2009;62:281–290. doi: 10.1016/j.neuron.2009.02.025. [DOI] [PMC free article] [PubMed] [Google Scholar]
- Long NM, Oztekin I, Badre D. Separable prefrontal cortex contributions to free recall. J Neurosci. 2010;30:10967–10976. doi: 10.1523/JNEUROSCI.2611-10.2010. [DOI] [PMC free article] [PubMed] [Google Scholar]
- Manning JR, Kahana MJ. Interpreting semantic clustering effects in free recall. Memory. 2012 doi: 10.1080/09658211.2012.683010. [DOI] [PMC free article] [PubMed] [Google Scholar]
- Manning JR, Polyn SM, Baltuch GH, Litt B, Kahana MJ. Oscillatory patterns in temporal lobe reveal context reinstatement during memory search. Proc Natl Acad Sci U S A. 2011;108:12893–12897. doi: 10.1073/pnas.1015174108. [DOI] [PMC free article] [PubMed] [Google Scholar]
- Mitchell TM, Shinkareva SV, Carlson A, Chang KM, Malave VL, Mason RA, Just MA. Predicting human brain activity associated with the meanings of nouns. Science. 2008;320:1191. doi: 10.1126/science.1152876. [DOI] [PubMed] [Google Scholar]
- Miyawaki Y, Uchida H, Yamashita O, Sato MA, Morito Y, Tanabe HC, Sadato N, Kamitani Y. Visual image reconstruction from human brain activity using a combination of multiscale local image decoders. Neuron. 2008;60:915–929. doi: 10.1016/j.neuron.2008.11.004. [DOI] [PubMed] [Google Scholar]
- Nelson DL, McEvoy CL, Schreiber TA. The University of South Florida free association, rhyme, and word fragment norms. Behav Res Methods Instrum Comput. 2004;36:402–407. doi: 10.3758/bf03195588. [DOI] [PubMed] [Google Scholar]
- Nishimoto S, Vu AT, Naselaris T, Benjamini Y, Yu B, Gallant JL. Reconstructing visual experience from brain activity evoked by natural movies. Curr Biol. 2011;21:1641–1646. doi: 10.1016/j.cub.2011.08.031. [DOI] [PMC free article] [PubMed] [Google Scholar]
- Osipova D, Takashima A, Oostenveld R, Fernández G, Maris E, Jensen O. Theta and gamma oscillations predict encoding and retrieval of declarative memory. J Neurosci. 2006;26:7523–7531. doi: 10.1523/JNEUROSCI.1948-06.2006. [DOI] [PMC free article] [PubMed] [Google Scholar]
- Paller KA, Wagner AD. Observing the transformation of experience into memory. Trends Cogn Sci. 2002;6:93–102. doi: 10.1016/s1364-6613(00)01845-3. [DOI] [PubMed] [Google Scholar]
- Pasley BN, David SV, Mesgarani N, Flinker A, Shamma SA, Crone NE, Knight RT, Chang EF. Reconstructing speech from human auditory cortex. PLoS Biol. 2012;10:e1001251. doi: 10.1371/journal.pbio.1001251. [DOI] [PMC free article] [PubMed] [Google Scholar]
- Patterson KE, Meltzer RH, Mandler G. Inter-response times in categorized free recall. J Verb Learn Verb Behav. 1971;10:417–426. [Google Scholar]
- Penfield W, Boldrey E. Somatic motor and sensory representation in the cerebral cortex of man as studied by electrical stimulation. Brain. 1937;60:389–443. [Google Scholar]
- Plaut DC, McClelland JL. Locating object knowledge in the brain: comments on Bowers's (2009) attempt to revive the grandmother cell hypothesis. Psychol Rev. 2010;117:284–288. doi: 10.1037/a0017101. [DOI] [PubMed] [Google Scholar]
- Polyn SM, Kahana MJ. Memory search and the neural representation of context. Trends Cogn Sci. 2008;12:24–30. doi: 10.1016/j.tics.2007.10.010. [DOI] [PMC free article] [PubMed] [Google Scholar]
- Polyn SM, Natu VS, Cohen JD, Norman KA. Category-specific cortical activity precedes retrieval during memory search. Science. 2005;310:1963–1966. doi: 10.1126/science.1117645. [DOI] [PubMed] [Google Scholar]
- Polyn SM, Norman KA, Kahana MJ. A context maintenance and retrieval model of organizational processes in free recall. Psychol Rev. 2009;116:129–156. doi: 10.1037/a0014420. [DOI] [PMC free article] [PubMed] [Google Scholar]
- Postman L. The effect of interitem associative strength on the acquisition and retention of serial lists. J Verb Learn Verb Behav. 1967;6:721–728. [Google Scholar]
- Roediger HL, McDermott KB. Creating false memories: remembering words not presented in lists. J Exp Psychol Learn Mem Cogn. 1995;21:803–814. [Google Scholar]
- Sederberg PB, Kahana MJ, Howard MW, Donner EJ, Madsen JR. Theta and gamma oscillations during encoding predict subsequent recall. J Neurosci. 2003;23:10809–10814. doi: 10.1523/JNEUROSCI.23-34-10809.2003. [DOI] [PMC free article] [PubMed] [Google Scholar]
- Sederberg PB, Schulze-Bonhage A, Madsen JR, Bromfield EB, Litt B, Brandt A, Kahana MJ. Gamma oscillations distinguish true from false memories. Psychol Sci. 2007a;18:927–932. doi: 10.1111/j.1467-9280.2007.02003.x. [DOI] [PMC free article] [PubMed] [Google Scholar]
- Sederberg PB, Schulze-Bonhage A, Madsen JR, Bromfield EB, McCarthy DC, Brandt A, Tully MS, Kahana MJ. Hippocampal and neocortical gamma oscillations predict memory formation in humans. Cereb Cortex. 2007b;17:1190–1196. doi: 10.1093/cercor/bhl030. [DOI] [PubMed] [Google Scholar]
- Semon RW. Mnemic psychology. In: Duffy B, translator. [Original work published 1909] London: George Allen and Unwin; 1923. [Google Scholar]
- Shinkareva SV, Mason RA, Malave VL, Wang W, Mitchell TM, Just MA. Using fMRI brain activation to identify cognitive states associated with perception of tools and dwellings. PLoS One. 2008;3:e1394. doi: 10.1371/journal.pone.0001394. [DOI] [PMC free article] [PubMed] [Google Scholar]
- Steyvers M, Shiffrin RM, Nelson DL. Word association spaces for predicting semantic similarity effects in episodic memory. In: Healy AF, editor. Cognitive psychology and its applications: festschrift in honor of Lyle Bourne, Walter Kintsch, and Thomas Landauer. Washington, DC: American Psychological Association; 2004. [Google Scholar]
- Tulving E. Theoretical issues in free recall. In: Dixon TR, Horton DL, editors. Verbal behavior and general behavior theory. Englewood Cliffs, NJ: Prentice-Hall; 1968. pp. 2–36. [Google Scholar]
- Yee E, Drucker DM, Thompson-Schill SL. fMRI-adaptation evidence of overlapping neural representations for objects related in function or manipulation. Neuroimage. 2010;50:753–763. doi: 10.1016/j.neuroimage.2009.12.036. [DOI] [PMC free article] [PubMed] [Google Scholar]