

Abstract
Background and Purpose
Central nervous system (CNS) vascular malformations (VMs) result from abnormal vasculo- and/or angiogenesis. Cavernomas and arteriovenous malformations (AVMs) are also sites of active inflammation. The aim of this study was to determine whether magnetic resonance imaging (MRI) detection of VMs can be improved by administration of ferumoxytol iron oxide nanoparticle, which acts as a blood pool agent at early time points and an inflammatory marker when taken up by tissue macrophages.
Methods
Nineteen patients (11 men, 8 women; mean age, 47.5 years) with CNS VMs underwent 3T MRI both with gadoteridol and ferumoxytol. The ferumoxytol-induced signal changes on the T1-, T2-, and susceptibility-weighted images were analyzed at 25 minutes (range, 21–30 minutes) and 24 hours (range, 22–27 hours).
Results
Thirty-five lesions [capillary telangiectasia, n=6; cavernoma, n=21; developmental venous anomaly (DVA), n=7; AVM, n=1] were seen on the pre- and post-gadoteridol images. The post-ferumoxytol susceptibility-weighted sequences revealed five additional VMs (three capillary telangiectasias, two cavernomas) and demonstrated further tributary veins in all patients with DVAs. The 24-hour T1 and T2 ferumoxytol-related signal abnormalities were inconsistent among patients and within VM types. No additional area of T1 or T2 enhancement was noted with ferumoxytol compared with gadoteridol in any lesion.
Conclusions
Our findings indicate that the blood pool agent ferumoxytol provides important information about the number and true extent of VMs on the susceptibility-weighted MRI. The utility of ferumoxytol as a macrophage imaging agent in the visualization of inflammatory cells within and around the lesions warrants further investigation.
Keywords: magnetic resonance imaging, ultrasmall superparamagnetic iron oxide nanoparticles, ferumoxytol, central nervous system, vascular malformations
Introduction
Vascular malformations (VMs) of the brain and spinal cord have typically been classified into four major types: capillary telangiectasias, cavernomas, developmental venous anomalies (DVAs), and arteriovenous malformations (AVMs).1,2 Their pathogenesis involves abnormal vasculo- and/or angiogenesis.3,4 Cavernomas and AVMs are also sites of active inflammation.4 Various inflammatory cells (e.g. neutrophils, macrophages) and mediators (e.g. cytokines) have been shown to be present in these subtypes of VMs and have been demonstrated to contribute to lesion progression and rupture.4 Improved detection and characterization of VMs is important not just because certain types can cause serious neurological symptoms1 but they are commonly mistaken for disease, resulting in inappropriate therapy.
Currently, magnetic resonance imaging (MRI) is the best modality to assess VMs.1,2 Susceptibility-weighted imaging (SWI) employs a fully velocity-compensated high-resolution 3D gradient echo (GRE) acquisition that uses magnitude and filtered-phase information, both separately and in combination, to create new sources of contrast.5 This sequence was recently found to be superior to T1- and T2-weighted MRI in detection of VMs.5
Ferumoxytol (Feraheme®, AMAG Pharmaceuticals Inc., Cambridge, MA, USA), an ultrasmall superparamagnetic iron oxide (USPIO) nanoparticle, developed for iron-replacement therapy primarily in patients with chronic kidney disease, has seen increasing off-label utility in various MRI applications.6 The semisynthetic carbohydrate-coated ferumoxytol has a hydrodynamic diameter of 30 nm and a long blood half-life of approximately 14 hours.7 Ferumoxytol is confined to the vascular compartment at early time points but subsequently becomes an inflammatory marker as it leaks across permeable vessels and is taken up by tissue macrophages hours to day(s) after administration.6 It is considered to be a negative contrast material due to its strong T2* effect, but ferumoxytol also has intrinsic T1 shortening properties that can produce positive signal using appropriate pulse sequences.6 Susceptibility-weighted MRI has an exquisite sensitivity to USPIOs because of T2* influencing factors.8 Iron oxide nanoparticles increase the visibility of both normal and tumor microvessels in the brain on T2*-weighted scans.9,10 On the other hand, for the evaluation of intracellularly trapped USPIOs in patients with central nervous system (CNS) malignancies, the 24-hour T1-weighted spin echo (SE) and T2-weighted images were found to be the most helpful.11
The role of USPIO-enhanced MRI in patients with CNS VMs has not previously been investigated. We hypothesized that ferumoxytol would improve the detection of VMs using SWI, while changes in signal intensity and morphology of the lesions over time on the T1- and T2-weighted sequences could provide important information about the inflammatory cell component of VMs.
Subjects and Methods
Study Population
Between March 2008 and June 2010, 11 patients with known CNS VMs were prospectively enrolled in this study (protocol #1562). Additionally, eight patients who underwent MRI with ferumoxytol for brain tumor evaluation and were incidentally diagnosed with intracranial VMs (protocol #1562 or #813), were retrospectively included in the analysis.
Patients who were pregnant or lactating; had contraindication to MRI examination (e.g. pacemaker); had known allergic or hypersensitivity reactions to parenteral iron, dextran, iron-dextran, or iron-polysaccharide preparations; had known or suspected iron overload (e.g. hemochromatosis, history of multiple transfusions); had hepatic insufficiency or liver cirrhosis were excluded. HIV-positive patients on combination antiretroviral therapy were also ineligible because of the potential for pharmacokinetic interactions with ferumoxytol. The protocols were sponsored by the National Institute of Health and were approved by the Oregon Health and Science University Institutional Review Board. All participants provided written informed consent.
MRI Examination
The scans were performed on a 3T whole-body MRI system (either TIM Trio, Siemens Medical Solutions, Erlangen, Germanyor Achieva, Philips Healthcare, Best, The Netherlands) with a body radio frequency (RF) coil transmit and a 12-channel phased array head (Siemens), or an 8-channel sensitivity-encoding head (Philips), or a spine matrix RF receiver coil (Siemens).
Protocol #1562 consisted of imaging on three consecutive days. On the first day, T1-, T2-, and susceptibility-weighted pre- and postcontrast images were acquired using gadoteridol gadolinium (III) chelate (ProHance®, Bracco Diagnostic Inc., Princeton, NJ, USA; 0.1 mmol/kg). On the following day, the same MRI sequences were obtained with ferumoxytol, which was given over 20 minutes at a constant dose of 510 mg diluted to a final volume of 34 mL of saline regardless of body weight. On the third day, the sequences were repeated in identical spatial orientation to detect ferumoxytol-induced signal changes at 24 hours. Patient 19, whose estimated glomerular filtration rate was less than 30 mL/min/1.73m2, underwent only a two-day MRI with ferumoxytol, and was not studied with gadoteridol due to the risk for developing nephrogenic systemic fibrosis.
Patients on protocol #813 underwent MRI examination on two consecutive days. On day 1, axial T1-, T2-, and susceptibility-weighted precontrast and susceptibility-weighted postcontrast images were acquired using ferumoxytol, which was injected intravenously at a dose of 1 mg/kg diluted 1:1 with normal saline and was followed by gadoteridol administration (0.1 mmol/kg) within 15 minutes (mean, 13.5 minutes; range, 11–15 minutes). After the T1-weighted post-gadoteridol sequences, additional diluted ferumoxytol was given at a dose of 3 mg/kg. The patients were rescanned 24 hours later for the assessment of delayed ferumoxytol-caused signal changes.
Multiple time points were all completed in the same MRI instrument for each participant. The patients were monitored closely for two hours after ferumoxytol administration and were followed-up for one month.
Brain MRI Acquisition Parameters
Image Analysis
The ferumoxytol-caused signal changes were assessed at two time points: 25 minutes (range, 21–30 minutes) and 24 hours (range, 22–27 hours). Any signal intensity change exceeding the signal intensity of normal white matter on the ferumoxytol-enhanced T1-weighted images was termed as USPIO-induced signal increase (hyperintensity). Any signal intensity drop below the signal intensity of normal white matter on the post-ferumoxytol T1-, T2-, or susceptibility-weighted images was rated as USPIO-induced signal loss (hypointensity). The gadoteridol and ferumoxytol-enhanced images from each patient were evaluated in a matched-pair fashion and were analyzed by two neuroradiologists in consensus. The categorization of VMs on MRI was based on previously established and well-accepted standards.1,2,5 The 3–5-mm hypointense lesions seen only on the post-ferumoxytol susceptibility-weighted sequences were considered as a capillary telangiectasia if they had an irregular border and/or an arborizing (tree-like) appearance, otherwise they were recorded as a cavernoma.
Results
A total of 19 patients (11 men, 8 women; mean age, 47.5 years; age range, 9–74 years) were included in the analysis. Six patients had a capillary telangiectasia, one had both capillary telangiectasias and cavernomas, four had only cavernomas, seven had a DVA, and one patient had a spinal cord AVM. Thirty-five lesions were detected on the pre- and post-gadoteridol images, while 40 were seen on the ferumoxytol sequences. Patient demographics, number, location, and clinical presentation of the VMs are shown in Table 1. All of the image sets from each of the 19 evaluated patients were technically adequate for assessment. There were no adverse events attributed to either contrast material.
Table 1.
Patient demographics, number, location, and clinical presentation of the vascular malformations
| Patient Number/Gender/Age (years) | Protocol Number | Vascular Malformation | Lesion Number | Lesion Location | Clinical Presentation | |
|---|---|---|---|---|---|---|
| with/without Gd (n=35) | with Fe (n=40) | |||||
| 1/F/57 | 1562 | Telangiectasia | 1 | 1 | Pons | Headaches |
| 2/M/67 | 1562 | Telangiectasia | 1 | 1 | Pons | Headaches |
| 3/F/46 | 1562 | Telangiectasia | 1 | 1 | Pons | Headaches |
| 4/M/31 | 1562 | Telangiectasia | 1 | 1 | Right Cerebellar Hemisphere | Headaches, Dizziness |
| 5/M/53 | 1562 | Telangiectasia | 1 | 1 | Pons | Incidental Finding (Brain Tumor Follow-Up) |
| 6/M/59 | 1562 | Telangiectasia | 0 | 1 | Mesencephalon | Incidental Finding (Brain Tumor Follow-Up) |
| 7/F/30 | 1562 | Telangiectasia | 1 | 3 | Mesencephalon, Right Basal Ganglia, Vermis | Headaches, Dizziness |
| Cavernoma | 2 | 2 | Mesencephalon | |||
| 8/F/43 | 1562 | Cavernoma | 1 | 1 | Medulla Oblongata | Left Facial Numbness and Pain |
| 9/M/33 | 1562 | Cavernoma | 15 | 17 | Bilateral Cerebral Hemispheres | Headaches |
| 10/F/63 | 1562 | Cavernoma | 2 | 2 | Right Frontal Lobe, Left Temporal Lobe | Headaches |
| 11/M/74 | 1562 | Cavernoma | 1 | 1 | Left Frontal Lobe | Incidental Finding (Brain Tumor Follow-Up) |
| 12/M/30 | 1562 | DVA | 1 | 1 | Left Frontal Lobe | Headaches |
| 13/F/72 | 1562 | DVA | 1 | 1 | Right Frontal Lobe | Headaches |
| 14/F/39 | 813 | DVA | 1 | 1 | Left Frontal Lobe | Incidental Finding (Brain Tumor Follow-Up) |
| 15/F/61 | 813 | DVA | 1 | 1 | Right Temporal Lobe | Incidental Finding (Brain Tumor Follow-Up) |
| 16/M/64 | 813 | DVA | 1 | 1 | Left Cerebellar Hemisphere | Incidental Finding (Brain Tumor Follow-Up) |
| 17/M/12 | 813 | DVA | 1 | 1 | Left Cerebellar Hemisphere | Incidental Finding (Brain Tumor Follow-Up) |
| 18/M/9 | 813 | DVA | 1 | 1 | Right Temporal Lobe | Incidental Finding (Brain Tumor Follow-Up) |
| 19/M/60 | 1562 | AVM | 1* | 1 | Spinal Cord | Bilateral Lower Extremity Weakness |
F, female; M, male; Gd, gadoteridol; Fe, ferumoxytol; DVA, developmental venous anomaly; AVM, arteriovenous malformation
The patient had chronic kidney disease, therefore only ferumoxytol was used.
Capillary Telangiectasias
Seven patients with nine lesions were studied in this group (Table 1). Six out of nine capillary telangiectasias demonstrated both gadoteridol enhancement and 24-hour ferumoxytol-induced signal changes (Figure 1 and 2). Early 25-minute T1 and T2 signal abnormalities were noted only in one patient following ferumoxytol administration (Figure 2). Ferumoxytol resulted either in a signal increase (5/9) or in a signal drop-out (1/9) on the T1-weighted images at 24 hours. Five lesions became iso- and one hypointense on the T2-weighted sequences 24 hours after ferumoxytol injection. All capillary telangiectasias showed prominent signal loss with ferumoxytol on the susceptibility-weighted images (Figure 1–3A,B). Three out of nine lesions were incidental findings and were visible only on the susceptibility-weighted sequences and only with ferumoxytol (Figure 3A,B).
Figure 1. Capillary telangiectasia.
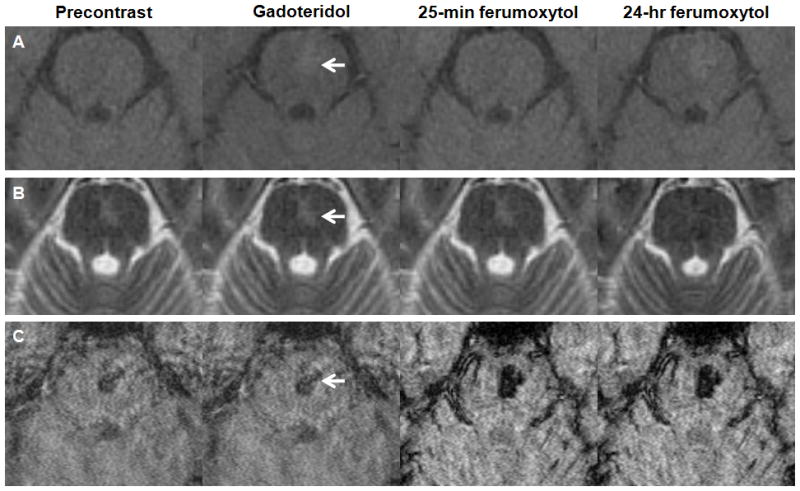
A–C, Axial T1- (A), T2- (B), and susceptibility-weighted images (C) obtained before, after gadoteridol, 25 minutes, and 24 hours after ferumoxytol administration. The gadoteridol and the 24-hour ferumoxytol T1-weighted MRI show a faint enhancing lesion in the pons (arrow). The capillary telangiectasia is isointense on the T2-weighted ferumoxytol images at 24 hours. The lesion demonstrates prominent signal loss on the susceptibility-weighted ferumoxytol scans.
Figure 2. Cavernoma and capillary telangiectasia.
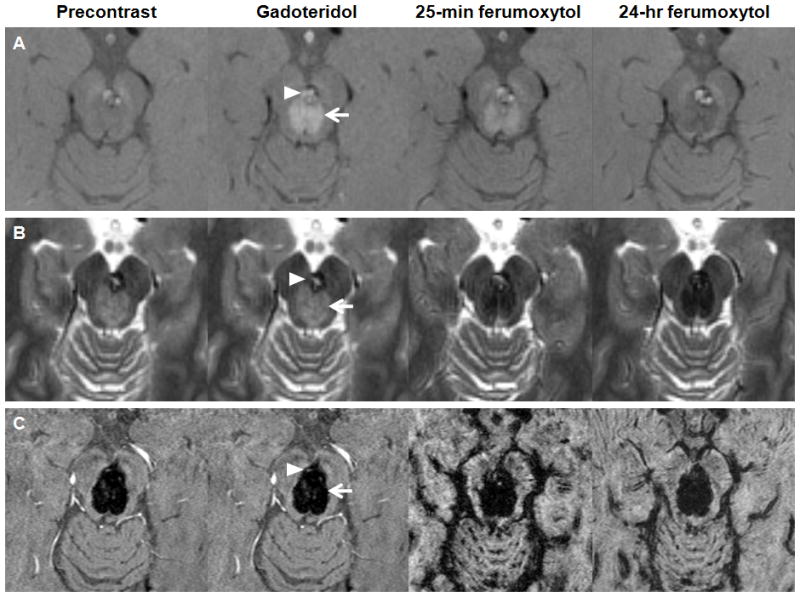
A–C, Axial T1- (A), T2- (B), and susceptibility-weighted images (C) obtained before, after gadoteridol, 25 minutes, and 24 hours after ferumoxytol administration. The gadoteridol MRI shows enhancing lesions: a capillary telangiectasia (arrow) and a cavernoma (arrowhead) in the mesencephalon. The capillary telangiectasia is hyperintense at 25 minutes and hypointense at 24 hours on the T1-weighted images. The cavernoma, which has a T1 iso-, T2 hyperintense core and a T2 hypointense rim on the precontrast images, shows signal increase at 25 minutes and mixed ferumoxytol-related signal changes at 24 hours on the T1-weighted scans. Both lesions demonstrate signal loss on the T2- and susceptibility-weighted ferumoxytol images.
Figure 3. Susceptibility-weighted images of patient 6, 7, and 9.
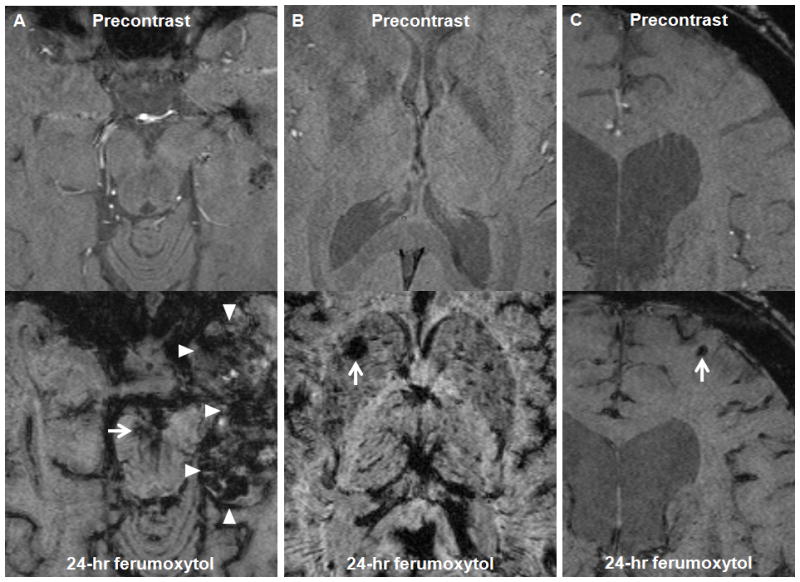
A–C, Axial susceptibility-weighted images of patient 6 (A), 7 (B), and 9 (C) obtained before and 24 hours after ferumoxytol administration. A, The ferumoxytol MRI shows a small capillary telangiectasia in the mesencephalon (arrow), while the precontrast image does not. Areas of decreased signal intensity are observed within the left temporal lobe tumor (arrowheads) 24 hours after ferumoxytol administration. B, The ferumoxytol MRI shows a capillary telangiectasia in the right basal ganglia (arrow), while the precontrast image does not. C, The ferumoxytol MRI shows a small cavernoma in the left anterior frontal lobe (arrow), while the precontrast image does not.
Cavernomas
Five patients had cavernomas. A total of 21 lesions were noted with gadoteridol and an additional two lesions were found on the post-ferumoxytol susceptibility-weighted sequences (Table 1, Figure 3C). Eighteen out of 23 lesions presented as a 2–4-mm hypointensities on the T2- and/or susceptibility-weighted scans. Five cavernomas, which had a T1 iso-, T2 hyperintense core and a T2 hypointense rim on the precontrast images, showed mixed ferumoxytol-related signal changes on the T1-weighted images at 24 hours, in addition to the T2-and susceptibility-weighted signal loss. In this group of cavernomas, four out of five lesions demonstrated 25-minute T1 signal increase, among them, one had T2 signal decrease as well (Figure 2).
Developmental Venous Anomalies
Seven patients, each with an isolated DVA were evaluated in this group (Table 1). The T1-weighted MRI scans with both contrast agents showed typical caput medusae appearance of DVAs: classic small cluster of tributary veins draining into a dilated collector vein. The lesions were visible on both the pre- and post-ferumoxytol T2- and susceptibility-weighted images, but the ferumoxytol scans demonstrated additional tributary veins in all patients compared with the precontrast sequences (Figure 4). The ferumoxytol-induced signal loss was more prominent at 25 minutes, than at 24 hours.
Figure 4. Developmental venous anomaly.
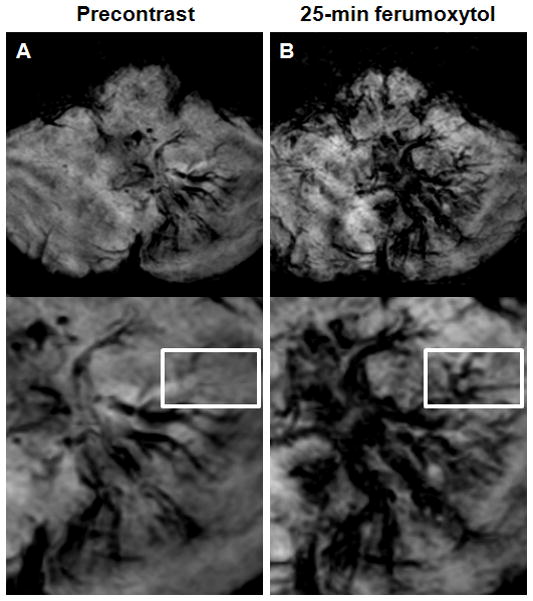
A–B, Axial susceptibility-weighted images obtained before (A) and 25 minutes after ferumoxytol administration (B). Albeit the left cerebellar lesion is visible on both the pre- and post-ferumoxytol susceptibility-weighted images, but the ferumoxytol scan demonstrates additional tributary veins (rectangle) compared with the precontrast sequence.
Arteriovenous Malformation
Patient 19, who had chronic kidney disease, presented with a 6-month history of progressive lower extremity weakness. The patient underwent spine MRI examination without gadolinium administration prior to enrollment in the ferumoxytol study. The noncontrast T2-weighted images showed abnormally increased intrinsic cord signal extending from the conus to upper thoracic levels. Dorsal flow voids were also visible (Figure 5B). The abnormal tangle of blood vessels on the spinal cord was hyperintense on the T1-weighted scans and hypointense on the T2- and T2*-weighted images after ferumoxytol administration (Figure 5D). Similarly to the DVAs, the ferumoxytol-induced signal loss at 25 minutes was the most prominent. Thoracic spinal angiography revealed a dural arteriovenous fistula at T10 along with prominent venous dilatation.
Figure 5. Spinal cord arteriovenous malformation.
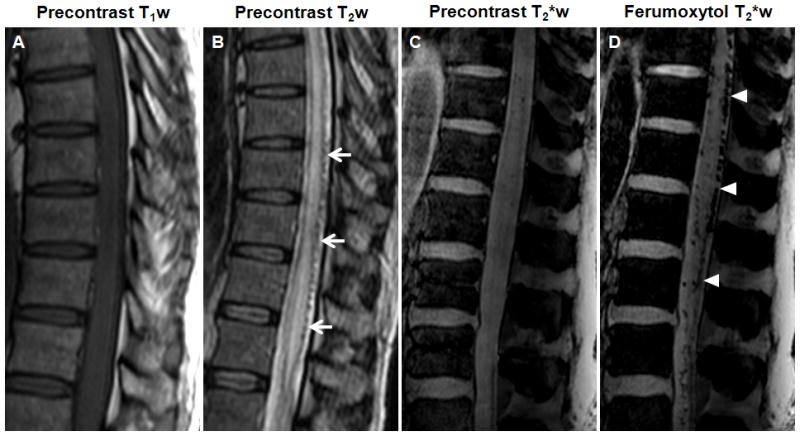
A–D, Sagittal T1- (A), T2-(B), and T2*-weighted images (C) obtained before and T2*-weighted images obtained 25 minutes after ferumoxytol administration (D). The T2-weighted image shows abnormally increased intrinsic cord signal. Dorsal flow voids are visible (arrows). The abnormal tangle of blood vessels on the spinal cord is hypointense with ferumoxytol on the T2*-weighted images (arrowheads).
Discussion
Susceptibility-weighted imaging is a relatively new technique that exploits the T2* relaxation differences between deoxygenated venous and oxygenated arterial blood, as well as the susceptibility-induced phase differences between veins and surrounding tissues, thus enhancing the signal loss in the venous structures.12 The utility of SWI in the evaluation of low-flow venous malformations, such as capillary telangiectasias, cavernomas, and DVAs is without question.13,14 In the case of AVMs, because of their rapid blood flow, SWI is mainly restricted to the delineation of small lesions without hemorrhage.5 The ferumoxytol-induced susceptibility effects shorten the transverse T2 and T2* relaxation times and cause a hypointense (dark) signal on the T2*-sensitive sequences, such as SWI.6 These USPIO-related signal changes have been shown to be valuable in the assessment of glioma microvascularity.10 Our data indicate that ferumoxytol also enhances the visibility of VMs. In our study, the post-ferumoxytol susceptibility-weighted images revealed five VMs (three capillary telangiectasias, two cavernomas) that were completely unnoticeable on the pre- and post-gadoteridol images, and demonstrated additional tributary veins in all patients with DVAs. It should be noted, that a small unruptured cavernoma might mimic a capillary telangiectasia on the susceptibility-weighted sequences. The lack of gadoteridol enhancement and ferumoxytol-induced T1 and T2 signal changes makes it very difficult to differentiate them from each other. We considered a lesion as a capillary telangiectasia if it had an irregular border and/or an arborizing (tree-like) appearance, but it cannot be excluded that they were actually occult cavernomas.
In contrast to the USPIO-related signal loss on the susceptibility-weighted images, the presence of T1 and T2 signal abnormalities varied among and within VM types, which can be due to differences in vessel size and intraluminal flow rate. We also noted intralesional discrepancy between the existence of T1- and T2-weighted ferumoxytol enhancement in some telangiectasias and cavernomas. One possible explanation for this finding is the known dose- dependency of USPIO-induced signal changes. Whereas iron oxide nanoparticles result in T2 shortening at higher concentrations, their T1 shortening effect peaks at lower concentrations,15 thus at doses applied in this study, the iron accumulation was not concentrated enough to cause decreased T2 signal in all lesions.
We have previously reported in patients with glioblastoma multiforme that both the intensity and volume of ferumoxytol enhancement increase with time.11 In these subjects, the USPIO-related signal intensity peaked at 24 to 28 hours, and at that time the ferumoxytol enhancement also extended beyond the tumor border delineated by gadoteridol.11 The iron staining of biopsy samples, obtained from brain tumor patients who underwent image-guided surgery, demonstrated that the iron oxide nanoparticles had been trapped by peritumoral macrophages and reactive astrocytes 24 to 36 hours after their administration.16 Based on these observations, we hypothesized that the 24-hour ferumoxytol scans would provide information about the inflammatory cell component of VMs. However, in patients with DVAs and in case of the spinal cord AVM, the ferumoxytol was still in the intraluminal space at 24 hours. In those cavernomas, that had both 25-minute and 24-hour signal abnormalities, no change in the volume and morphology of ferumoxytol enhancement was noted between the two time points. Moreover, no additional area of T1 or T2 enhancement was seen with ferumoxytol compared with gadoteridol in any of the lesions. It is unclear whether these findings indicate that there was ferumoxytol uptake in the phagocytic cells but at low concentrations or that there were few macrophages to endocytose the USPIOs. Alternatively, the evaluation of intra- and perilesional macrophages in cavernomas and AVMs may require later time points than in the high-grade glioma study. The interpretation of post-ferumoxytol T1- and T2-weighted images in patients with capillary telangiectasias is challenging. Five out of nine lesions had only 24-hour ferumoxytol enhancement, and there was just one capillary telangiectasia which had both 25-minute and 24-hour ferumoxytol-related signal abnormalities. No definite explanation can be given for this observation. Since capillary telangiectasias are typically devoid of reactive astrocytes and macrophages17 we speculate that the absence of 25-minute enhancement and presence of 24-hour signal changes represent delayed wash-in and wash-out of the large molecular weight ferumoxytol.
The dose of USPIO agent has a substantial impact on image quality.9,18 The most important limitation of this study is that two different ferumoxytol doses were applied. In 14 out of our 19 participants ferumoxytol was injected at a constant dose of 510 mg (approximately 7 mg/kg in case of a 70-kg patient), while in five patients it was given at a dose of 4 mg/kg. High doses are advantageous in the evaluation of tissue uptake of USPIOs on the T1- and T2-weighted sequences, but can result in some loss of resolution of venous structures due to a decrease in the signal-to-noise ratio on the T2*-weighted images, and vice versa with low doses.8 The blooming effect of USPIO nanoparticles (the USPIO-enhanced region may be much larger than the area of nanoparticle uptake) is also dose-dependent, therefore the optimization of ferumoxytol dose for the visualization of VMs on the susceptibility-weighted images is crucial and currently underway.
Conclusions
We have shown here that the blood pool agent ferumoxytol improves the detection of CNS VMs on the susceptibility-weighted MRI. As ferumoxytol has a good biocompatibility profile, has no known long-term toxicity, and in contrast to the gadolinium-based contrast agents it can be safely given to patients with decreased renal function it seems to be a promising tool for the diagnosis and follow-up of VMs. The utility of ferumoxytol as a macrophage imaging agent in the visualization of inflammatory cells within and around the lesions requires further investigation.
Supplementary Material
Acknowledgments
Sources of Funding:
This work was supported by National Institute of Health grants National Cancer Institute CA137488, National Institute of Neurological Disorders and Stroke NS53468, American Recovery and Reinvestment Act CA137488-15S1 and an National Cancer Institute-Fredrick Cancer Research and Development Center Contract to EAN.
Footnotes
Disclosures: AMAG Pharmaceuticals, Inc. provided the study drug ferumoxytol free of charge. OHSU has received a sponsored research agreement from AMAG to conduct clinical trials of MRI with ferumoxytol. None of the authors has financial interest in this agent or in its developer AMAG.
References
- 1.Brown RD, Jr, Flemming KD, Meyer FB, Cloft HJ, Pollock BE, Link ML. Natural history, evaluation, and management of intracranial vascular malformations. Mayo Clin Proc. 2005;80:269–281. doi: 10.4065/80.2.269. Review. [DOI] [PubMed] [Google Scholar]
- 2.Krings T, Lasjaunias PL, Hans FJ, Mull M, Nijenhuis RJ, Alvarez H, Backes WH, Reinges MH, Rodesch G, Gilsbach JM, Thron AK. Imaging in spinal vascular disease. Neuroimaging Clin N Am. 2007;17:57–72. doi: 10.1016/j.nic.2007.01.001. Review. [DOI] [PubMed] [Google Scholar]
- 3.Gault J, Sarin H, Awadallah NA, Shenkar R, Awad IA. Pathobiology of human cerebrovascular malformations: basic mechanisms and clinical relevance. Neurosurgery. 2004;55:1–16. discussion 16–17. Review. [PubMed] [Google Scholar]
- 4.Leblanc GG, Golanov E, Awad IA, Young WL. Biology of Vascular Malformations of the Brain NINDS Workshop Collaborators. Biology of vascular malformations of the brain. Stroke. 2009;40:e694–702. doi: 10.1161/STROKEAHA.109.563692. Review. [DOI] [PMC free article] [PubMed] [Google Scholar]
- 5.Sehgal V, Delproposto Z, Haacke EM, Tong KA, Wycliffe N, Kido DK, Xu Y, Neelavalli J, Haddar D, Reichenbach JR. Clinical applications of neuroimaging with susceptibility-weighted imaging. J Magn Reson Imaging. 2005;22:439–450. doi: 10.1002/jmri.20404. Review. [DOI] [PubMed] [Google Scholar]
- 6.Weinstein JS, Varallyay CG, Dosa E, Gahramanov S, Hamilton B, Rooney WD, Muldoon LL, Neuwelt EA. Superparamagnetic iron oxide nanoparticles: diagnostic magnetic resonance imaging and potential therapeutic applications in neurooncology and central nervous system inflammatory pathologies, a review. J Cereb Blood Flow Metab. 2010;30:15–35. doi: 10.1038/jcbfm.2009.192. Review. [DOI] [PMC free article] [PubMed] [Google Scholar]
- 7.Neuwelt EA, Hamilton BE, Varallyay CG, Rooney WR, Edelman RD, Jacobs PM, Watnick SG. Ultrasmall superparamagnetic iron oxides (USPIOs): a future alternative magnetic resonance (MR) contrast agent for patients at risk for nephrogenic systemic fibrosis (NSF)? Kidney Int. 2009;75:465–474. doi: 10.1038/ki.2008.496. Review. [DOI] [PMC free article] [PubMed] [Google Scholar]
- 8.Kennan RP, Zhong J, Gore JC. Intravascular susceptibility contrast mechanisms in tissues. Magn Reson Med. 1994;31:9–21. doi: 10.1002/mrm.1910310103. [DOI] [PubMed] [Google Scholar]
- 9.Yang M, Christoforidis GA, Figueredo T, Heverhagen JT, Abduljalil A, Knopp MV. Dosage determination of ultrasmall particles of iron oxide for the delineation of microvasculature in the Wistar rat brain. Invest Radiol. 2005;40:655–660. [PMC free article] [PubMed] [Google Scholar]
- 10.Christoforidis GA, Yang M, Kontzialis MS, Larson DG, Abduljalil A, Basso M, Yang W, Ray-Chaudhury A, Heverhagen J, Knopp MV, Barth RF. High resolution ultra high field magnetic resonance imaging of glioma microvascularity and hypoxia using ultra-small particles of iron oxide. Invest Radiol. 2009;44:375–383. doi: 10.1097/RLI.0b013e3181a8afea. [DOI] [PMC free article] [PubMed] [Google Scholar]
- 11.Neuwelt EA, Várallyay CG, Manninger S, Solymosi D, Haluska M, Hunt MA, Nesbit G, Stevens A, Jerosch-Herold M, Jacobs PM, Hoffman JM. The potential of ferumoxytol nanoparticle magnetic resonance imaging, perfusion, and angiography in central nervous system malignancy: a pilot study. Neurosurgery. 2007;60:601–611. doi: 10.1227/01.NEU.0000255350.71700.37. discussion 611–612. [DOI] [PubMed] [Google Scholar]
- 12.Haacke EM, Xu Y, Cheng YC, Reichenbach JR. Susceptibility weighted imaging (SWI) Magn Reson Med. 2004;52:612–618. doi: 10.1002/mrm.20198. [DOI] [PubMed] [Google Scholar]
- 13.Lee BC, Vo KD, Kido DK, Mukherjee P, Reichenbach J, Lin W, Yoon MS, Haacke M. MR high-resolution blood oxygenation level-dependent venography of occult (low-flow) vascular lesions. AJNR Am J Neuroradiol. 1999;20:1239–1242. [PMC free article] [PubMed] [Google Scholar]
- 14.Reichenbach JR, Jonetz-Mentzel L, Fitzek C, Haacke EM, Kido DK, Lee BC, Kaiser WA. High-resolution blood oxygen-level dependent MR venography (HRBV): a new technique. Neuroradiology. 2001;43:364–369. doi: 10.1007/s002340000503. [DOI] [PubMed] [Google Scholar]
- 15.Neuwelt EA, Weissleder R, Nilaver G, Kroll RA, Roman-Goldstein S, Szumowski J, Pagel MA, Jones RS, Remsen LG, McCormick CI, Shannon EM, Muldoon LL. Delivery of virus-sized iron oxide particles to rodent CNS neurons. Neurosurgery. 1994;34:777–784. doi: 10.1227/00006123-199404000-00048. [DOI] [PubMed] [Google Scholar]
- 16.Hunt MA, Bagó AG, Neuwelt EA. Single-dose contrast agent for intraoperative MR imaging of intrinsic brain tumors by using ferumoxtran-10. AJNR Am J Neuroradiol. 2005;26:1084–1088. Review. [PMC free article] [PubMed] [Google Scholar]
- 17.Castillo M, Morrison T, Shaw JA, Bouldin TW. MR imaging and histologic features of capillary telangiectasia of the basal ganglia. AJNR Am J Neuroradiol. 2001;22:1553–1555. [PMC free article] [PubMed] [Google Scholar]
- 18.Allkemper T, Bremer C, Matuszewski L, Ebert W, Reimer P. Contrast-enhanced blood-pool MR angiography with optimized iron oxides: effect of size and dose on vascular contrast enhancement in rabbits. Radiology. 2002;223:432–438. doi: 10.1148/radiol.2232010241. [DOI] [PubMed] [Google Scholar]
Associated Data
This section collects any data citations, data availability statements, or supplementary materials included in this article.