Abstract
Purpose: To determine the geometric and dose attenuation characteristics of a new commercially available CT-compatible LDR tandem and ovoid (T&O) applicator using Monte Carlo calculation and 3D dosimetry.
Methods: For geometric characterization, we quantified physical dimensions and investigated a systematic difference found to exist between nominal ovoid angle and the angle at which the afterloading buckets fall within the ovoid. For dosimetric characterization, we determined source attenuation through asymmetric gold shielding in the buckets using Monte Carlo simulations and 3D dosimetry. Monte Carlo code MCNP5 was used to simulate 1.5 × 10⁹ photon histories from a 137Cs source placed in the bucket to achieve statistical uncertainty of 1% at a 6 cm distance. For 3D dosimetry, the distribution about an unshielded source was first measured to evaluate the system for 137Cs, after which the distribution was measured about sources placed in each bucket. Cylindrical PRESAGE® dosimeters (9.5 cm diameter, 9.2 cm height) with a central channel bored for source placement were supplied by Heuris Inc. The dosimeters were scanned with the Duke Large field of view Optical CT-Scanner before and after delivering a nominal dose at 1 cm of 5–8 Gy. During irradiation the dosimeter was placed in a water phantom to provide backscatter. Optical CT scan time lasted 15 min during which 720 projections were acquired at 0.5° increments, and a 3D distribution was reconstructed with a (0.05 cm)3 isotropic voxel size. The distributions about the buckets were used to calculate a 3D distribution of transmission rate through the bucket, which was applied to a clinical CT-based T&O implant plan.
Results: The systematic difference in bucket angle relative to the nominal ovoid angle (105°) was 3.1°–4.7°. A systematic difference in bucket angle of 1°, 5°, and 10° caused a 1% ± 0.1%, 1.7% ± 0.4%, and 2.6% ± 0.7% increase in rectal dose, respectively, with smaller effect to dose to Point A, bladder, sigmoid, and bowel. For 3D dosimetry, 90.6% of voxels had a 3D γ-index (criteria = 0.1 cm, 3% local signal) below 1.0 when comparing measured and expected dose about the unshielded source. Dose transmission through the gold shielding at a radial distance of 1 cm was 85.9% ± 0.2%, 83.4% ± 0.7%, and 82.5% ± 2.2% for Monte Carlo, and measurement for left and right buckets, respectively. Dose transmission was lowest at oblique angles from the bucket with a minimum of 56.7% ± 0.8%, 65.6% ± 1.7%, and 57.5% ± 1.6%, respectively. For a clinical T&O plan, attenuation from the buckets leads to a decrease in average Point A dose of ∼3.2% and decrease in D2cc to bladder, rectum, bowel, and sigmoid of 5%, 18%, 6%, and 12%, respectively.
Conclusions: Differences between dummy and afterloading bucket position in the ovoids is minor compared to effects from asymmetric ovoid shielding, for which rectal dose is most affected. 3D dosimetry can fulfill a novel role in verifying Monte Carlo calculations of complex dose distributions as are common about brachytherapy sources and applicators.
Keywords: LDR tandem and ovoid, brachytherapy, 3D dosimetry, PRESAGE, Monte Carlo
INTRODUCTION
We describe the commissioning of a brachytherapy applicator for which we have incorporated 3D dosimetry measurements into the commissioning process. Traditionally, Monte Carlo simulations are used to calculate dose about brachytherapy sources and attenuation through applicators, with the calculation being verified by point dose measurements. Alternatively, 3D dosimetry has the ability to provide 3D spatial dose information at high resolution which could be especially useful to verify Monte Carlo calculations in instances of dose distributions that are complex or have high gradients as is often the case about brachytherapy sources and applicators. A number of methods have been developed to measure 3D dosimetric distributions, including radiochromic, polymer, and Fricke gel dosimeters.1, 2, 3, 4 In these systems, the dose distribution is recorded by a large volume dosimeter, after which it can be analyzed with one of a number of imaging systems.5, 6, 7 A novel optical tomography system at our institution can be used to analyze PRESAGE® (Heuris Inc., NJ) dose distributions with submillimeter voxel size using the Duke Large field of view Optical CT-Scanner (DLOS).8, 9 PRESAGE is a polyurethane based dosimeter that is solid and transparent. Some of its advantages include being machinable, moldable, and insensitive to oxygen exposure, which are especially important for brachytherapy measurements requiring a channel in the dosimeter for source placement. These, along with the minimal optical scatter afforded by DLOS and the high spatial resolution achievable with PRESAGE, make this system well suited for brachytherapy measurements.8 This system has been used extensively for external beam radiotherapy1, 2 and in a few cases, to measure the dose distribution about a brachytherapy source.10, 11 Verification of the attenuation characteristics of brachytherapy applicators is a natural extension of previously reported applications of the PRESAGE/DLOS 3D dosimetry system.
The applicator for which we describe the commissioning is a CT-compatible LDR tandem and ovoid applicator that has recently become commercially available (Weeks CT Mini-Ovoid Applicator Set, Radiation Products Design Inc, Albertville, MN). CT-compatibility has been shown to be warranted for LDR intracavitary brachytherapy applicators by retrospective studies showing a lack of correlation between 3D dose-volume analysis with dose to Point A as defined by International Commission on Radiation Units (ICRU) Report No. 38.12, 13, 14 A prototype of the applicator was originally designed by Weeks et al.,15, 16, 17 and incorporated aluminum and high temperature plastic components to minimize imaging artifacts. However, differences exist between it and the new commercial applicator which have not yet been characterized.
The main difference between the new (commercially available) applicator and its original prototype is a change in the shielding material in the afterloading buckets from tungsten to gold. The ovoids of the CT-compatible applicator provide an asymmetric dose distribution to shield organs at risk. To avoid imaging artifacts, this shielding material is found within the afterloading buckets rather than the caps or ovoids. Since these afterloading buckets are small (0.55 cm outer diameter), and have a complex shape with highly varied shielding, the high spatial resolution achievable with 3D dosimetry makes it an ideal dose measurement system to verify the attenuative properties calculated using Monte Carlo simulations.
MATERIALS AND METHODS
Geometrical characterization
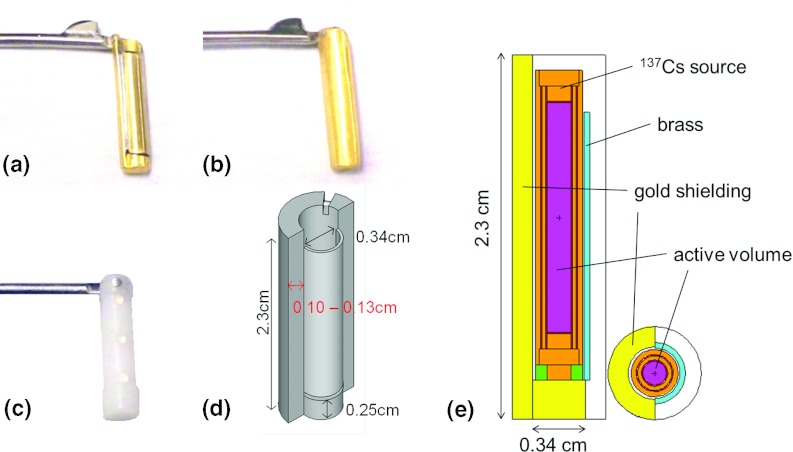
The external shape of the CT-compatible applicator is intentionally designed to be the same as the Fletcher–Suit–Delclos (FSD) applicator18 so as to not appreciably change the insertion procedures or treatment dosimetry. The device consists of four curved tandems (15°, 30°, 45°, and 60°) and minicolpostats with optional caps with outer diameters 2.0, 2.5, and 3.0 cm. The ovoid heads and caps are made of high temperature plastic while the colpostat handle and separation mechanism are made of stainless steel. Because of the high density shielding in the afterloading buckets, dummy buckets are used during imaging that do not include high density metal. The buckets used for afterloading of the sources in the ovoids are shown in Fig. 1; they are asymmetrically gold-shielded with a 0.036 cm brass covering on the unshielded side. In the radial direction, the gold shielding attenuates the dose over a span of 180° (see Fig. 1), the center of which is offset 45° relative to the ovoid handle so as to preferentially lower the dose to bladder and rectum. The CT-compatible dummy buckets are made of plastic and have three stainless steel BBs (0.016 cm diameter) embedded into the bucket for seed localization [Fig. 1c]. The steel BB positions correspond to the center and either end of the active volume of 137Cs sources with an active length of 1.35 cm.
Figure 1.
Afterloading buckets with asymmetric gold shielding. Shown is the unshielded side with brass covering (a), gold shielded side (b), CT-compatible dummy bucket (c), 3D illustration (not to scale) of afterloading bucket (d), and geometry of bucket and source used for Monte Carlo simulations (e).
The physical dimensions of the CT-compatible applicator were quantified. The physical dimensions of the tandems, ovoids, and afterloading buckets were verified via digital caliper measurements and radiography, and were compared to the vendor's specifications and to the published specifications for the Weeks prototype device.16, 17 The gold-shielded and dummy (CT-compatible) buckets were also inserted into the ovoid and radiographed to verify positioning. Differences between the commercial and prototype Weeks device include: (1) change of shielding material from tungsten (density = 17 g/cm3) to 24 K gold (density = 19.3 g/cm3) for increased shielding and fixation of the brass layer; (2) change of aluminum tandem inner and outer diameters from 0.45 cm and 0.65 cm to 0.50 cm and 0.80 cm, respectively. In addition, the surface of the original tandems was anodized aluminum, while the new commercial tandems have a teflon coating to avoid flaking of the surface material. For the commercial applicator, gold was chosen as the shielding material over tungsten because it has a higher density and hence can provide increased shielding of organs at risk, and the brass layer can be brazed directly to the gold which eliminated attachments fastened by glue in the original prototype.
After a preliminary investigation, a systematic difference between the expected and actual angle at which the afterloading buckets hang within the ovoids (nominally 105°) was found. Thus, a more thorough evaluation was performed using radiography to measure the bucket angle for a number of ovoid orientations chosen to represent clinically expected extremes: (1) with the ovoid pointing down and the ovoid handle level at 0°, (2) with the ovoid pointing down and the ovoid handle inclined at ±14°, and (3) with the ovoid laying sideways and the ovoid handle level at 0°. The measurements were made six times for each orientation with a dummy source placed in the bucket. The dummy buckets were removed and replaced in the ovoid after each measurement. For comparison, the measurements were repeated using the CT-compatible dummy buckets. The clinical dosimetric effect of a systematic difference in bucket angle within the ovoids was quantified for two patient geometries, which utilized a 45° tandem and 2.0 cm ovoid caps. The patients were prescribed doses of 35 and 40 Gy to Point A delivered in 58 h and 50 h, respectively. Dosimetric indices chosen for comparison were the dose to Point A as defined by ICRU 38 (Ref. 19) as well as the minimum dose to the hottest 2 cc (D2cc) of the bladder, rectum, bowel, and sigmoid. The treatment planning software (TPS) used for this evaluation was Brachyvision version 10.0 (Varian Medical Systems, Inc., Palo Alto, CA) which did not account for tissue heterogeneities or attenuation of the ovoid source by the gold buckets.
Dosimetric characterization
As part of the commissioning process, we used Monte Carlo simulations to quantify the attenuation of the dose by the applicator tandems and afterloading buckets for a standard LDR 137Cs source (model 67-6520 by Isotope Product Laboratories).20 For the afterloading buckets, we also measured the attenuation through the buckets with the 3D dosimetry system.1, 2, 21
Monte Carlo calculation
The Monte Carlo radiation transport code MCNP5 was used for all the simulations.22 The photoatomic cross sections were based on EPDL97 (Refs. 23 and 24) and the photon spectra were from the National Nuclear Data Center (NNDC) (Ref. 25) with 137Cs photon emission probability. The 137Cs source was simulated with radiation emissions originating from a solid 0.152 cm diameter and 1.48 cm long right cylinder of Cs2O surrounded by stainless steel walls with a combined thickness of 0.0584 cm to approximate the model 67-6520 137Cs source by the Isotope Product Laboratories. Dose distributions were simulated in 30 × 30 × 30 cm3 liquid water using the *F4 FMESH tally card in both transverse (X-Y plane mesh = 600 × 600) and longitudinal (X-Z plane mesh = 600 × 600) plane with tally grid of (0.05 cm)3. The cutoff photon energy was set to 0.01 MeV and electron scoring was not performed in the simulations since its contribution was negligible. For each Monte Carlo run, 1.5 × 10⁹ photon histories were simulated. These calculations took about 15 h on a 2.3 GHz laptop with the Windows XP operating system. Typical statistical uncertainties (k = 1) in the longitudinal plane were 1% at a distance of 6 cm and 5% for a distance of 15 cm from the central axis. Figure 1e shows the geometry of the bucket and source used for Monte Carlo simulations.
Calculations were performed with and without simulating the presence of the aluminum tandem and attenuating bucket surrounding the source. The radial thickness of the gold shielding is specified by the manufacturer as 0.13 ± 0.01 cm. However, for our applicator [marked in red in Fig. 1d], we measured a thickness of 0.10 ± 0.01 cm. Due to the discrepancy, calculations were performed with both thicknesses. Per discussion with the vendor (Radiation Products Design Inc., Albertville, MN), the gold buckets shrink after casting, which leads to variation in bucket size with most casts falling within a range of 0.117 cm–0.122 cm. The thin brass covering on the unshielded side of the bucket was accounted for in the calculations, while the notch in the gold shielding was not.
3D dosimetry
Current PRESAGE dosimeters are tissue equivalent (effective Z = 7.4) and have been used for photon energies as low as 225 kV; Monte Carlo based simulations have also shown it to be suitable for dose measurements for 137Cs.10, 26 In addition to this, we evaluated the PRESAGE/DLOS system for measurements of 137Cs by first measuring the 3D dose distribution about an unshielded source, after which the distribution was measured about sources placed within the attenuating buckets. Cylindrical polymer based PRESAGE dosimeters1, 2, 21 (9.5 cm diameter, 9.2 cm height) were manufactured. The cylindrical dosimeters were designed to measure dose out to a radial distance of 4 cm, and had a channel (0.35 cm diameter for unshielded source, 0.58 cm diameter for buckets) drilled in the center to nearly midway through the dosimeter. An optical CT pre-irradiation scan of the dosimeter was acquired using the DLOS scanning system8 with the channel being filled with and the entire dosimeter being immersed in a refractive fluid consisting of a combination of octyl salicylate and mineral oil for the scan. The fluid was then removed and a 137Cs source (model 67-6520 by Isotope Product Laboratories) (Ref. 20) or a 137Cs sourced within an afterloading bucket was inserted into the dosimeter channel. During irradiation the dosimeter was placed within a water phantom large enough to provide sufficient backscatter (40 × 40 × 40 cm3) and an unattenuated dose of 5.3 Gy at 1 cm was delivered for the unshielded source and 7.8 Gy at 1 cm when the source was placed in the ovoid buckets. A postirradiation optical CT scan was immediately acquired with the same refractive fluid inserted in the channel again and the dosimeter immersed. The 3D dose distribution was reconstructed with a (0.05 cm)3 isotropic voxel size with no median filtering. All optical CT scans were acquired with 720 projections at 0.5° increments, and were flood and dark field corrected with an acquisition time of ∼15 min.
The purpose of measuring the 3D dose distribution about the unshielded source was to evaluate the 3D dose measurement system for 137Cs prior to using the system to evaluate the buckets. The distribution was registered manually with the calculation using published American Association of Physicist in Medicine (AAPM) Task Group 43 (TG-43) parameters for the source.20 A region of interest (ROI) was defined using morphological operators to exclude pixels near and outside the dosimeter surface as well as any points within the dosimeter having a zero dose reading due to imperfections. A 3D γ-index analysis27 was used to compare the measurement and calculation including all voxels within the ROI.
The distributions about the source within the buckets were registered manually with the source distribution calculated using TG-43 parameters20 and the ratio of the dose about the bucket to the dose expected for an unshielded source was calculated using
| (1) |
where r, θ, and ϕ are cylindrical coordinates, I(r, θ, ϕ) is the pixel intensity value from the PRESAGE measurement at the given coordinates, ϕref is the angle passing through the reference point at which the distribution is normalized and is directed through the brass directly opposite the gold shielding, and p(1 cm, 90°, ϕref) is the calculated transmission through the brass from the Monte Carlo calculation and is equal to 0.9930 ± 0.0003. GL(r, θ), gL(r), and F(r, θ) are the geometry, radial dose, and anisotropy functions from TG-43.28 The ratio in Eq. 1 was calculated for both the left and right buckets.
The dosimetric effect of the bucket attenuation on the prescription point (Point A) and clinical organs at risk was evaluated for a single tandem and ovoid implant. The clinical plan consisted of a 35 Gy implant with three sources in the tandem (air kerma strength = 108.6, 80.6, and 80.6 cGy cm2/h) and one source per ovoid (air kerma strength = 107.8 and 108.3 cGy cm2/h). It is our departmental practice that when MR images are not available, the dose is prescribed to Point A, rather than the HRCTV as recommended by the Groupe Européen de Curiethérapie (GEC) and the European Society for Therapeutic Radiology and Oncology (ESTRO).14, 29 The ratio calculated in Eq. 1 from the PRESAGE measurement was used to account for attenuation through the afterloading buckets. Since the 3D distribution of the transmission rate through the bucket varies much less than the raw measured dose, it is better suited to identify voxels with invalid signal caused by the presence of the central channel, noise, or physical imperfections in the dosimeter. Therefore, voxels with transmission rates in the 3D distribution that were outside of the expected range (<40%, >200%), as well as voxels at a large radius (>3 cm) or outside the dosimeter were estimated as being the nearest valid measured transmission values along the line intersecting the center of the source and the point of interest. Attenuation of the tandem, and high density plastic ovoids and caps were not accounted for.
RESULTS
Geometric characterization
For the evaluation of bucket geometric uncertainty, the mean difference ± standard deviation between the angle of the dummy bucket and the nominal ovoid angle (105°) over all four orientations was −0.4° ± 0.4° for the right ovoid and 0.1° ± 0.5° for the left ovoid. In contrast, the difference between the gold bucket and the ovoid angle was 3.1° ± 0.7° for the right ovoid and 4.7° ± 0.7° for the left ovoid, with little difference between orientations. Here, a negative angle indicates extension away from the ovoid handle. The maximum difference for the right and left gold buckets were 4.7° and 6.1°, respectively.
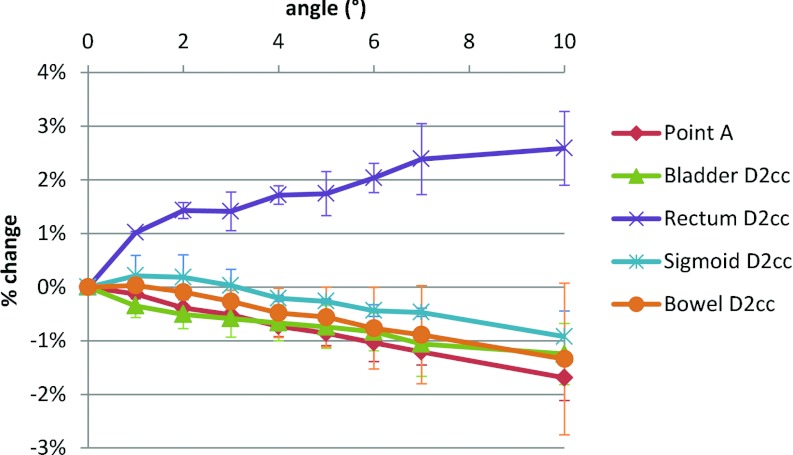
Figure 2 shows the percent change in various dose indices as a function of the difference in angle between dummy and afterloading buckets for the two patient geometries evaluated. Figure 2 shows that D2cc of the rectum increases with angle while nearly all other indices decrease. Also, D2cc for rectum changed by the largest magnitude with a 1% increase occurring for 1° and a 2% increase occurring for ≥5°. For all other indices, a 1% change occurred only at angles ≥5°. Hence, even the maximum observed angle discrepancies have only a modest dosimetric effect, with the change in dose to Point A being −0.8 ± 0.2% and a maximum change in bladder and rectum D2cc of −1.0% and +2.3%, respectively.
Figure 2.
Change in dose to Point A, and to the D2cc for bladder, rectum, bowel, and sigmoid calculated using the TPS as a function of systematic difference in planned and actual angle of buckets within the ovoids.
Dosimetric characterization
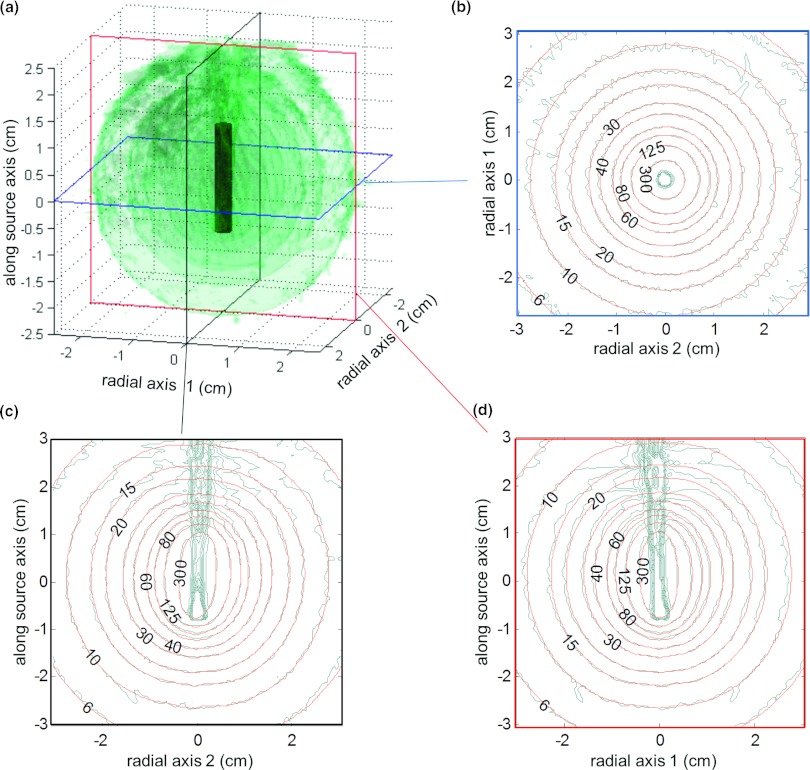
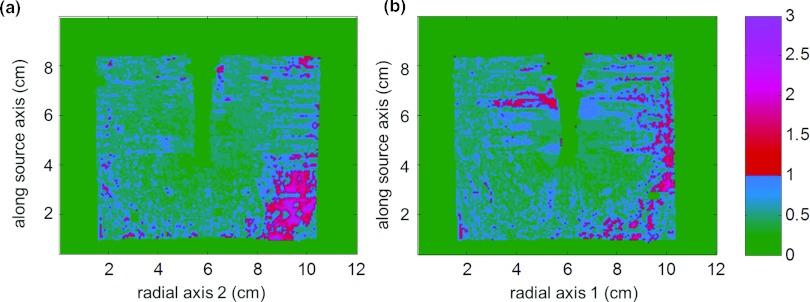
Figure 3a shows a number of transparent 3D isodose clouds surrounding the model of the unshielded 137Cs source using PRESAGE. Figure 3 also shows 2D isodose distributions in the axial (b), coronal (c), and sagittal (d) planes for the PRESAGE measurement (blue/uneven), overlaid with the TG-43-based dose calculation20 (red/smooth). For the 3D γ-index analysis,27 90.6% of voxels had a γ-index <1.0 when using criteria of 0.1 cm and 3% of the local signal. Figure 4 illustrates the coronal (a) and sagittal (b) planes of the the γ-index. In calculating the γ-index, 3% of the local signal (rather than 3% of the global maximum) was used as the dose agreement criteria because of the large variation in dose with distance from the source. The standard deviation of the dose measurement at 1 cm and 3 cm was 3.1% and 8.0% of the local signal, respectively.
Figure 3.
(a) PRESAGE measured 3D dose [(0.05 cm)3 resolution] around an unshielded 137Cs source–isodose surfaces [24, 34, 58, and 103 cGy/h for an air kerma strength (AKS) of 72 cGy·cm2/h]. Axial (b), coronal (c), and sagittal (d) planes are shown which include comparison of measured data (blue/uneven) with TG-43 calculations (Ref. 20) (red/smooth).
Figure 4.
Coronal (a) and sagittal (b) planes of γ-index comparing PRESAGE measured 3D dose [(0.05 cm)3 resolution] about an unshielded 137Cs source to TG-43 calculation (Ref. 20). Criteria used for γ-index was 0.1 cm and 3% of local signal, for which 90.4% of voxels were <1.0.
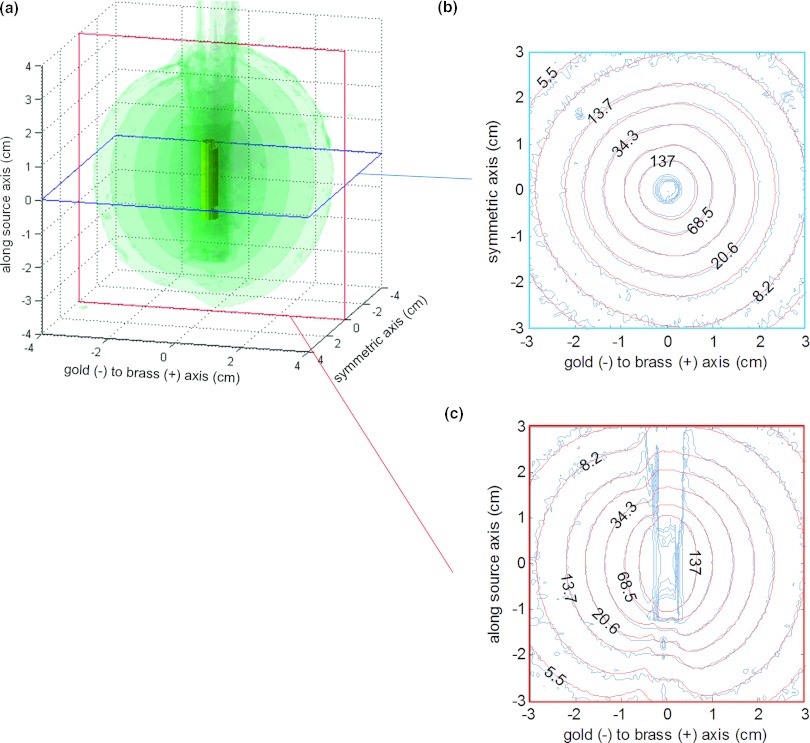
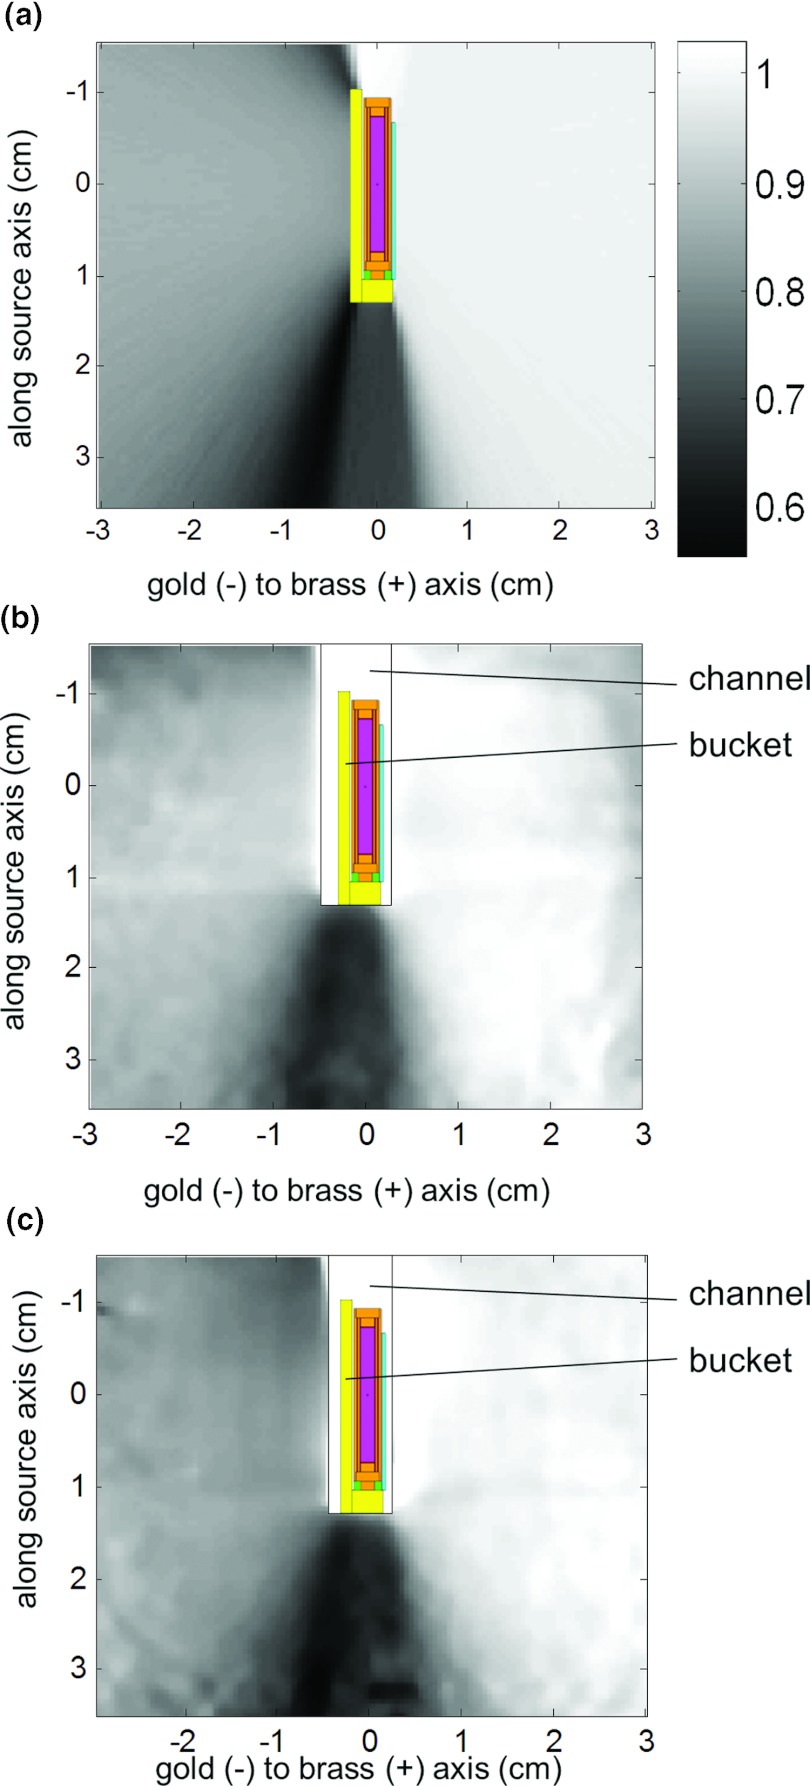
Table 1 shows the measured and calculated transmissions through the tandem and afterloading buckets. Figure 5 shows a number of transparent 3D isodose clouds surrounding the model of the afterloading bucket measured using PRESAGE (a), along with the sagittal (b) and axial (c) 2D isodose distributions for the PRESAGE measurement (blue/uneven) and Monte Carlo calculation (red/smooth). As expected, the isodose lines are influenced by shielded areas and the largest effect occurs at above and below the bucket where the path length of the source through the gold is longest. Figure 6 shows the transmission rate calculated using Monte Carlo (a) and using the PRESAGE measurements for the left (b) and right (c) buckets. The minimum calculated transmission through the bucket was 56.7% ± 0.8%, while the minimum measured transmission was 65.6% ± 1.7% for the left bucket and 57.5% ± 1.6% for the right bucket. The minimum measured transmission occurred at an oblique angle below the bucket.
Table 1.
Mean (±standard deviation) of calculated and measured dose transmission at a radial distance of 1 cm through tandem and afterloading buckets.
| Transmission (mean ± standard deviation) |
||
|---|---|---|
| Monte Carlo | PRESAGE | |
| Tandem | 99.6% ± 0.2% | … |
| Bucket (0.10 cm gold shielding) | 85.9% ± 0.2% | Left: 83.4% ± 0.7% |
| Right: 82.5% ± 2.2% | ||
| Bucket (0.13 cm gold shielding) | 82.3% ± 0.3% | … |
| Bucket (brass) | 99.3% ± 0.1% | … |
Figure 5.
(a) PRESAGE measured 3D dose [(0.05 cm)3 resolution] around afterloading bucket–isodose surfaces (3.4, 6, 13, 26, and 45 cGy/h for AKS = 72 cGy·cm2/h). Axial (b) and sagittal (c) planes are shown which include comparison of measured data (blue/uneven) with Monte Carlo calculation (red/smooth).
Figure 6.
Transmission rate calculated by Monte Carlo (a), and measured using 3D dosimetry for the left bucket (b) and right bucket (c), with overlay of source/bucket geometry. Scale bar applies to Figs. 5a, 5b, 5c.
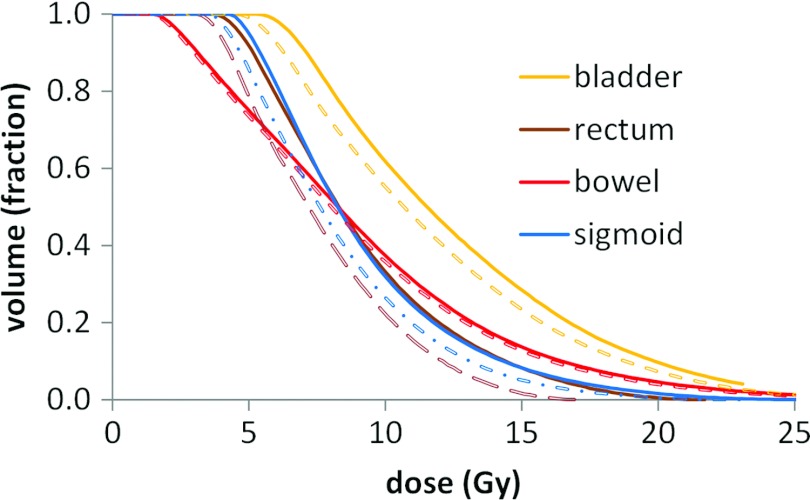
The change in D2cc and median dose to the bladder, rectum, bowel, and sigmoid is shown in Table 2 when accounting for attenuation due to shielding in the afterloading bucket. For this particular patient the dose metrics decreased most for rectum and sigmoid. The dose to left and right Point A decreased 3.4% and 3.0% due to the bucket attenuation, as the tandem and ovoid source strength was not adjusted to account for their inherent attenuation. The dose volume histogram (DVH) for the organs at risk is shown in Fig. 7.
Table 2.
Change in D2cc and median dose for clinical T&O when accounting for attenuation from the buckets.
| Bladder | Rectum | Bowel | Sigmoid | ||
|---|---|---|---|---|---|
| D2cc (Gy) | Unattenuated | 24.4 | 16.6 | 29.4 | 20.2 |
| Attenuated | 23.3 | 13.6 | 27.7 | 17.9 | |
| % difference | −5% | −18% | −6% | −12% | |
| Dmedian (Gy) | Unattenuated | 11.5 | 8.3 | 7.9 | 7.9 |
| Attenuated | 10.3 | 7.0 | 7.8 | 7.4 | |
| % difference | −10% | −16% | −2% | −7% |
Figure 7.
Dose volume histogram of organs at risk for a single LDR tandem and ovoid patient with (dashed lines) and without (solid lines) accounting for attenuation of the ovoid sources by afterloading buckets.
DISCUSSION
While LDR brachytherapy is not currently as prevalent in the United States as it has been historically, it is still widely used. LDR has the unique advantage of a consolidated treatment schedule which is, at times, preferable over HDR for physicians at our clinic, especially if patients have a long commute to the clinic, or would otherwise not comply with several HDR treatments. This evaluation is applicable for clinical implementation of the CT-compatible applicator at the many institutions still using LDR. Furthermore, the use of 3D dosimetry in commissioning of brachytherapy applicators is a technique that may be applied to HDR as well.
There have been a few reported cases in which 3D dosimetry has been used to verify the attenuation characteristics of brachytherapy applicators.30, 31 3D dosimetry for these cases was performed using polymer gels, the oxygen sensitivity of which can limit sensitivity at low doses31 and necessitates use of an airtight container. The airtight container may also limit ability to measure dose near the applicator surface, depending on applicator geometry and container construction. Also MR based dose reconstruction requires a tradeoff between acquisition time, spatial resolution, and reconstruction volume. The advantages offered by PRESAGE/DLOS such as irradiation in a channel open to air and the small voxel size (0.05 cm)3 of the reconstructed image made it a good fit for 3D dosimetry measurement about the small afterloading buckets evaluated in this study.
Our results show that the angle of the bucket within the source is systematically different by a few degrees from the ovoid angle or the dummy buckets placed at the time of CT. This may be accounted for during the planning process by rotating the source relative to the dummy bucket. However, the overall dosimetric difference to Point A is typically within 1%, which is a smaller effect than that of the gold bucket attenuation. Furthermore, the increase in D2cc to rectum was between 2% and 3% for angles up to 10°, which is more than offset by the decrease in rectal dose due to shielding in the bucket. Hence, during routine clinical practice this effect may be ignored with little clinical impact.
Most brachytherapy TPS do not currently account for dose differences caused by tissue and applicator heterogeneity for 137Cs sources. Instead, as with conventional LDR brachytherapy, the attenuation of the dose by the tandem is accounted for by multiplying the source strength by the transmission factor. The attenuation of the dose by the ovoid shielding is typically not accounted for when considering target dose, since there is little shielding in the direction of the target volume. Modern dose calculation methods capable of accounting for tissue and applicator heterogeneities such as Monte Carlo or using discrete ordinates to directly solve the transport equation are becoming more available in commercial TPS due to increased potential computing power.32 In the future, these methods may also become available for LDR brachytherapy. The data presented in this study can be used in clinical practice when accounting for dose attenuation of this specific applicator.
Two of the main challenges of 3D dosimetry for brachytherapy are high dose gradients and the large dose range with increasing measurement volume. For example, our comparison of the measured and published distribution about an unshielded source included voxels with distances from the source center ranging from 0.25 cm to 6.5 cm, leading to a very large dose range with the maximum expected voxel dose being over 320 times greater than the minimum expected voxel dose. Despite such a broad dose range, greater than 90% of voxels had a passing 3D γ-index. As shown in Fig. 4, in general, the area with larger gamma indices is located far from the source (near the inferior edge of the dosimeter) which implies noise due to low dose being the limiting factor. However, this is not the only effect as there are some areas with moderately high gamma indices near the source as seen in Fig. 4b. The γ-index is typically used for external beam radiotherapy and applications with regions of relatively uniform signal. Here, we have applied it to brachytherapy, where large dose gradients occur. Because of this, we used a stringent distance criterion of 0.1 cm and a dose criterion based on the local signal rather than a global maximum. As the dose agreement criteria for this analysis was 3% of the local signal, it automatically accounts for the large range in dose values. For the distribution about the buckets, differences from the unshielded distribution that were predicted by Monte Carlo were also visualized using 3D dosimetry in Figs. 56.
We found that a discrepancy existed between the engineering specification and the actual thickness of the gold shielding. Due to this, we calculated the expected attenuation through the gold for both the specified and measured thickness, which resulted in a 3.6% difference in attenuation. Interestingly, the attenuation of the gold at the central axis of the source measured using PRESAGE was within the values calculated for the two thicknesses by Monte Carlo.
CONCLUSION
3D dosimetry can serve a novel and valuable role in the measurement of dose distributions about clinical brachytherapy applicators, with the chief advantage being the ability to verify high-spatial resolution dose distributions calculated using Monte Carlo simulations.
ACKNOWLEDGMENTS
Research efforts at Duke University and Rider University were partially supported by National Institutes of Health (NIH) Grant No. R01 CA100835-01. The authors would like to thank Andrew Thomas for his initiations and helpful discussions, and also to the reviewers for very constructive feedback. John Adamovics is the owner of Heuris Inc.
References
- Guo P., Adamovics J., and Oldham M., “A practical three-dimensional dosimetry system for radiation therapy,” Med. Phys. 33, 3962–3972 (2006). 10.1118/1.2349686 [DOI] [PMC free article] [PubMed] [Google Scholar]
- Sakhalkar H. S., Adamovics J., Ibbott G., and Oldham M., “A comprehensive evaluation of the PRESAGE/optical-CT 3D dosimetry system,” Med. Phys. 36, 71–82 (2009). 10.1118/1.3005609 [DOI] [PMC free article] [PubMed] [Google Scholar]
- McJury M., Oldham M., Cosgrove V. P., Murphy P. S., Doran S., Leach M. O., and Webb S., “Radiation dosimetry using polymer gels: methods and applications,” Br. J. Radiol. 73, 919–929 (2000). [DOI] [PubMed] [Google Scholar]
- Baldock C., De Deene Y., Doran S., Ibbott G., Jirasek A., Lepage M., McAuley K. B., Oldham M., and Schreiner L. J., “Polymer gel dosimetry,” Phys. Med. Biol. 55, R1–R63 (2010). 10.1088/0031-9155/55/5/R01 [DOI] [PMC free article] [PubMed] [Google Scholar]
- Oldham M., Siewerdsen J. H., Shetty A., and Jaffray D. A., “High resolution gel-dosimetry by optical-CT and MR scanning,” Med. Phys. 28, 1436–1445 (2001). 10.1118/1.1380430 [DOI] [PubMed] [Google Scholar]
- Hilts M. and Duzenli C., “Image filtering for improved dose resolution in CT polymer gel dosimetry,” Med. Phys. 31, 39–49 (2004). 10.1118/1.1633106 [DOI] [PubMed] [Google Scholar]
- Maryanski M. J., Schulz R. J., Ibbott G. S., Gatenby J. C., Xie J., Horton D., and Gore J. C., “Magnetic resonance imaging of radiation dose distributions using a polymer-gel dosimeter,” Phys. Med. Biol. 39, 1437–1455 (1994). 10.1088/0031-9155/39/9/010 [DOI] [PubMed] [Google Scholar]
- Thomas A., Newton J., Adamovics J., and Oldham M., “Commissioning and benchmarking a 3D dosimetry system for clinical use,” Med. Phys. 38, 4846–4857 (2011). 10.1118/1.3611042 [DOI] [PMC free article] [PubMed] [Google Scholar]
- Oldham M., “3D dosimetry by optical-CT scanning,” J. Phys.: Conf. Ser. 56, 58–71 (2006). 10.1088/1742-6596/56/1/006 [DOI] [PMC free article] [PubMed] [Google Scholar]
- Gorjiara T., Hill R., Kuncic Z., and Baldock C., “Water equivalency evaluation of PRESAGE dosimeters for dosimetry of Cs-137 and Ir-192 brachytherapy sources,” J. Phys.: Conf. Ser. 250, 012093 (2010). 10.1088/1742-6596/250/1/012093 [DOI] [Google Scholar]
- Pierquet M., Craciunescu O., Steffey B., Song H., and Oldham M., “On the Feasibility of verification of 3D dosimetry near brachytherapy sources using PRESAGE/optical-CT,” J. Phys.: Conf. Ser. 250, 012091 (2010). 10.1088/1742-6596/250/1/012091 [DOI] [PMC free article] [PubMed] [Google Scholar]
- Pelloski C. E., Palmer M., Chronowski G. M., Jhingran A., Horton J., and Eifel P. J., “Comparison between CT-based volumetric calculations and ICRU reference-point estimates of radiation doses delivered to bladder and rectum during intracavitary radiotherapy for cervical cancer,” Int. J. Radiat. Oncol. Biol. Phys. 62, 131–137 (2005). 10.1016/j.ijrobp.2004.09.059 [DOI] [PubMed] [Google Scholar]
- Shin K. H., Kim T. H., Cho J. K., Kim J. Y., Park S. Y., Kim D. Y., Chie E. K., Pyo H. R., and Cho K. H., “CT-guided intracavitary radiotherapy for cervical cancer: Comparison of conventional point A plan with clinical target volume-based three-dimensional plan using dose-volume parameters,” Int. J. Radiat. Oncol. Biol. Phys. 64, 197–204 (2006). 10.1016/j.ijrobp.2005.06.015 [DOI] [PubMed] [Google Scholar]
- Potter R., Haie-Meder C., Van Limbergen E., Barillot I., De Brabandere M., Dimopoulos J., Dumas I., Erickson B., Lang S., Nulens A., Petrow P., Rownd J., and Kirisits C., “Recommendations from gynaecological (GYN) GEC ESTRO working group (II): Concepts and terms in 3D image-based treatment planning in cervix cancer brachytherapy-3D dose volume parameters and aspects of 3D image-based anatomy, radiation physics, radiobiology,” Radiother. Oncol. 78, 67–77 (2006). 10.1016/j.radonc.2005.11.014 [DOI] [PubMed] [Google Scholar]
- Weeks K. J. and Dennett J. C., “Dose calculation and measurements for a CT compatible version of the Fletcher applicator,” Int. J. Radiat. Oncol. Biol. Phys. 18, 1191–1198 (1990). 10.1016/0360-3016(90)90457-U [DOI] [PubMed] [Google Scholar]
- Weeks K. J. and Montana G. S., “Three-dimensional applicator system for carcinoma of the uterine cervix,” Int. J. Radiat. Oncol. Biol. Phys. 37, 455–463 (1997). 10.1016/S0360-3016(96)00496-8 [DOI] [PubMed] [Google Scholar]
- Weeks K. J., Montana G. S., and Bentel G. C., “Design of a plastic minicolpostat applicator with shields,” Int. J. Radiat. Oncol. Biol. Phys. 21, 1045–1052 (1991). 10.1016/0360-3016(91)90748-S [DOI] [PubMed] [Google Scholar]
- Haas J. S., Dean R. D., and Mansfield C. M., “Fletcher-Suit-Delclos gynecologic applicator: Evaluation of a new instrument,” Int. J. Radiat. Oncol. Biol. Phys. 9, 763–768 (1983). 10.1016/0360-3016(83)90246-8 [DOI] [PubMed] [Google Scholar]
- International Commission on Radiation Units and Measurements, “Dose and volume specifications for reporting intracavitary therapy in gynecology,” Report No. 38 (Oxford University Press, Oxford, UK, 1985).
- Meigooni A. S., Wright C., Koona R. A., Awan S. B., Granero D., Perez-Calatayud J., and Ballester F., “TG-43 U1 based dosimetric characterization of model 67-6520 Cs-137 brachytherapy source,” Med. Phys. 36, 4711–4719 (2009). 10.1118/1.3224462 [DOI] [PubMed] [Google Scholar]
- Thomas A. and Oldham M., “Fast, large field-of-view, telecentric optical-CT scanning system for 3D radiochromic dosimetry,” J. Phys.: Conf. Ser. 250, 012007 (2010). 10.1088/1742-6596/250/1/012007 [DOI] [PMC free article] [PubMed] [Google Scholar]
- X-5 Monte Carlo Team, “MCNP—A General Monte Carlo N-Particle Transport Code,” version 5, Los Alamos National Laboratory, Los Alamos, NM, 2003.
- White M. C., “Photoatomic Data Library MCPLIB04: A New Photoatomic Library Based On Data from ENDF/B-VI Release 8,” Los Alamos National Laboratory Report No. LAUR-03-1019, 2003.
- Cullen D. E., Hubbell J. H., and Kissel L., “EPDL97: The Evaluated Photon Data Library, '97 Version,” Lawrence Livermore National Laboratory Report No. UCRL-50400 Rev. 5, 19 September 1997.
- “NUDAT 2.4,” National Nuclear Data, Center Brookhaven National Laboratory, 2009 (available URL: http://www.nndc.bnl.gov/nudat2/index.jsp). Last accessed 1 June 2012.
- Newton J., Oldham M., Thomas A., Li Y., Adamovics J., Kirsch D. G., and Das S., “Commissioning a small-field biological irradiator using point, 2D, and 3D dosimetry techniques,” Med. Phys. 38, 6754–6762 (2011). 10.1118/1.3663675 [DOI] [PMC free article] [PubMed] [Google Scholar]
- Ju T., Simpson T., Deasy J. O., and Low D. A., “Geometric interpretation of the gamma dose distribution comparison technique: Interpolation-free calculation,” Med. Phys. 35, 879–887 (2008). 10.1118/1.2836952 [DOI] [PubMed] [Google Scholar]
- Rivard M. J., Coursey B. M., DeWerd L. A., Hanson W. F., Huq M. S., Ibbott G. S., Mitch M. G., Nath R., and Williamson J. F., “Update of AAPM Task Group No. 43 Report: A revised AAPM protocol for brachytherapy dose calculations,” Med. Phys. 31, 633–674 (2004). 10.1118/1.1646040 [DOI] [PubMed] [Google Scholar]
- Potter R., Dimopoulos J., Kirisits C., Lang S., Haie-Meder C., Briot E., Dumas I., Van Limbergen E., De Brabandere M., Nulens A., Erickson B., Rownd J., and Petrow P., “Recommendations for image-based intracavitary brachytherapy of cervix cancer: The GYN GEC ESTRO Working Group point of view: In regard to Nag et al. [Int. J. Radiat. Oncol. Biol. Phys. 60, 1160–1172 (2004)],” Int. J. Radiat. Oncol. Biol. Phys. 62, 293–295 (2005). 10.1016/j.ijrobp.2005.01.036 [DOI] [PubMed] [Google Scholar]
- Petrokokkinos L., Zourari K., Pantelis E., Moutsatsos A., Karaiskos P., Sakelliou L., Seimenis I., Georgiou E., and Papagiannis P., “Dosimetric accuracy of a deterministic radiation transport based 192Ir brachytherapy treatment planning system. Part II: Monte Carlo and experimental verification of a multiple source dwell position plan employing a shielded applicator,” Med. Phys. 38, 1981–1992 (2011). 10.1118/1.3567507 [DOI] [PubMed] [Google Scholar]
- Fragoso M., Love P. A., Verhaegen F., Nalder C., Bidmead A. M., Leach M., and Webb S., “The dose distribution of low dose rate Cs-137 in intracavitary brachytherapy: Comparison of Monte Carlo simulation, treatment planning calculation and polymer gel measurement,” Phys. Med. Biol. 49, 5459–5474 (2004). 10.1088/0031-9155/49/24/005 [DOI] [PubMed] [Google Scholar]
- Rivard M. J., Venselaar J. L., and Beaulieu L., “The evolution of brachytherapy treatment planning,” Med. Phys. 36, 2136–2153 (2009). 10.1118/1.3125136 [DOI] [PubMed] [Google Scholar]


