Introduction
Quantitative analysis of myocardial perfusion SPECT (MPS) studies has become a mainstay in nuclear cardiology practice. Software tools developed by several groups are now commercially available and are routinely used. These programs can automatically compute several important clinical parameters, such as amount of hypoperfusion at stress and rest. What is the value of these tools to a nuclear cardiology practitioner or a clinical researcher? How do they compare to visual analysis? What are their limitations? In this review, we look at the standard features of such quantitative tools, compare it with the visual scoring technique, and discuss particular strengths of quantitative approach. We also highlight several possible challenges in applying quantitative analysis and discuss some recent software developments, which can mitigate these difficulties.
OVERVIEW OF BASIC METHODS
Several quantitative measures of myocardial perfusion can be derived automatically by software. The standard processing sequence is as follows: automatic 3D segmentation the left ventricle (1) (2), extraction the myocardial count density samples to polar map coordinates (typically by computing the maximal values for a given polar map pixel), and analysis of the polar map samples by the comparison of to average local values in the normal population (3, 4). Site-or protocol-specific normal limits can be created using studies of low-likelihood patients. The use of common polar map coordinates for all subjects allows inter-subject comparison of count intensities. The quantification of perfusion is relative in nature and therefore image counts in each study need to be normalized to a common level before the comparisons are made. A local measure of the hypoperfusion severity can be defined as the number of standard deviations below the lower normal threshold for a given myocardial location. Consequently, polar maps can be plotted with severity mapped to a colour scale, or as so called “blackout maps” where all pixels below normal limits are highlighted. An example of such quantitative polar maps is shown in Figure 1.
Figure 1.
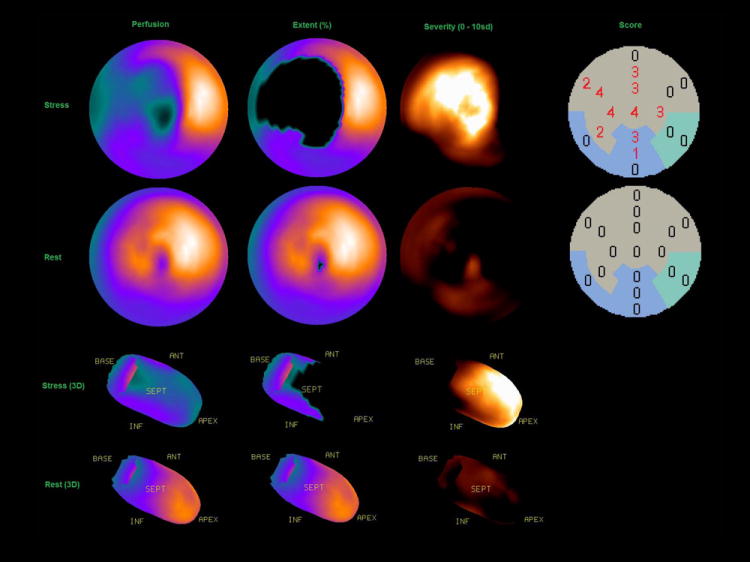
An example of quantitative polar map displays of extent, severity and automatically generated scores with stress (top) and rest (bottom).
The local samples of hypoperfusion can be aggregated into regional (per vascular territory) or global (per ventricle) measures. Myocardial perfusion defect extent (“defect extent”) can be expressed as a percentage of the pixels in the polar map, for which severity is greater than predefined statistical threshold (for example 2.5 standard deviations of the inter-subject normal perfusion sample). A parameter, which combines pixel-based defect extent and severity and estimates an overall magnitude of hypoperfusion, termed “total perfusion deficit” TPD has been developed (3). TPD can be computed for the entire myocardium, or separately for each vascular territory. In addition, segmental perfusion scores for the AHA 17-segment model can be derived, based on the average defect severity in a given segment. Segments are assigned computed severity scores according to a 5-point scale: (0 = normal; 1 = mildly abnormal; 2 = moderately abnormal; 3 = severely abnormal; 4 = absent) (5). Segmental scores can be summed per region or for the whole myocardium and the summed stress score (SSS), the summed rest score (SRS), and the summed difference score (SDS) can be derived, analogous to the scheme employed in the visual scoring (6).
Standard tools with the above general functionality (but with some differences in the computational analysis methods) are available commercially from several vendors. Several validation studies for these techniques have been reported, with angiography as a gold standard (7, 8). Similarly, relative quantification can be also applied to PET perfusion quantification (9) In-depth description of specific approaches has been provided in a series of comprehensive reviews authored by the major groups (10-13)
STRENGTHS
Reproducibility
An important strength of quantitative analysis is the inherent reproducibility of the measurements. Lower variability directly translates to improved detection of true differences in hypoperfusion. The reproducibility of quantitative perfusion analysis has been investigated with stress/and rest SPECT acquisition repeated on the same day with the same injection (14). The quantitative analysis was compared to standard visual perfusion scoring. Blinded visual analysis of stress and rest scans was performed by an expert reader, who repeated the scoring of the same data after 6 months. Quantitative measures of stress, rest and ischemic (stress-rest) defects were significantly more reproducible than the visual scores (respective repeatability coefficients 3.3% vs. 4.8%, 1.8% vs. 3.8%, 3.2% vs. 4.3%, all p < 0.002). The Bland-Altman plots comparing the quantitative and visual reads are shown in (Figure 2). Similarly, superior reproducibility of quantitative measures was demonstrated in a small (n=31) population of stable patients with scans repeated after 9-22 months. Quantitative analysis (TPD) was compared to consensus visual read (two independent expert readers with over-read of discordance by a third expert) repeated after 6 months with the same display defaults. This type of setup represents the case for the best possible visual intra-observer reproducibility. Repeatability coefficients were 6.1%, 6.4%, and 5.7% for the quantitative analysis of stress, rest and ischemic TPD vs. 10.1%, 11.8%, and 9.0% for the visual scoring of the % abnormal myocardium. These comparisons demonstrate clearly the advantage of the quantitative perfusion analysis over visual segmental scoring.
Figure 2.
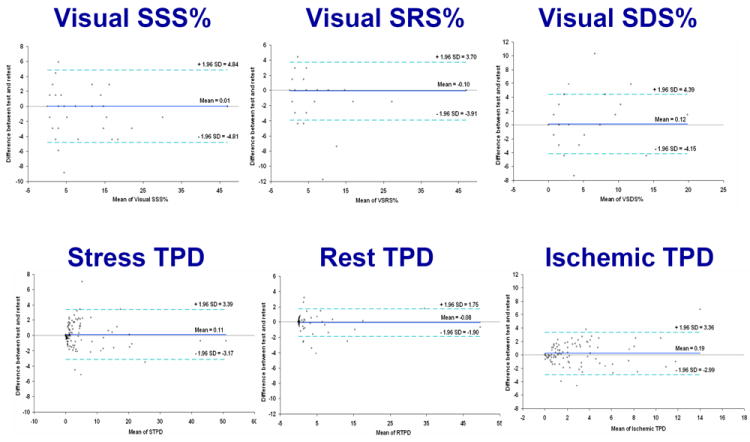
Visual (top) versus automatic (bottom) reproducibility of perfusion analysis. Stress (left column), rest (middle column), and ischemic (right column) measures are shown. (Reproduced with permission from (14))
Diagnostic Accuracy
Quantitative analysis of myocardial perfusion can rival the diagnostic accuracy of visual observers in the detection of coronary artery disease (CAD). In one study, standard quantitative approach has been found to achieve performance better than or equivalent to clinical visual assessment in the detection of >=50% stenosis as measured by the area under the receiver-operator-characteristics (ROC) curve (15) (Figure 3). Similar results were demonstrated recently in a larger population with blind clinical reads for the blinded expert scoring with and without clinical information (16). One difficulty in comparing the diagnostic accuracy of the visual observers and quantitative analysis is that during a typical clinical reading session, physician integrates of all the available information, such as patient history, with image data. Nevertheless, equivalence to visual diagnostic performance was demonstrated, even if all clinical information was available to the visual readers.
Figure 3.
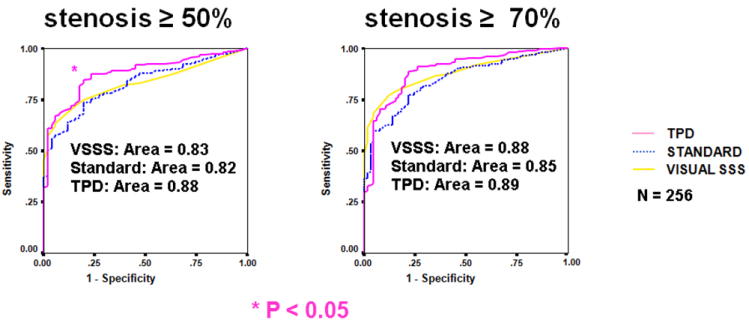
Diagnostic accuracy of quantitative software vs. visual analysis. ROC curves for detection of CAD (≥ 50% and ≥ 70% stenosis cutoff) for (TPD), previous automated analysis (standard quantification [STD]), and visual scoring (VIS) for the overall test population (n = 256). (Reproduced with permission from (3))
Quantitative prediction of risk
Possibly of even greater importance than the ability to predict coronary stenosis, is the potential to objectively quantify risk of cardiac events including the risk of cardiac death by MPS. Although a number of seminal studies clearly demonstrated the incremental prognostic value of MPS (17-23), they relied on the clinical visual scoring rather than on quantitative measures. The particular advantage of quantitative analysis in this context is the independence from the clinical information. Quantitative MPS parameters separated from the clinical variables could be easily incorporated by computer algorithms into more comprehensive risk scores (17). Only few publications to date have used automatic quantification in prognostic studies. Leslie et al used quantitative analysis for predicting cardiac death or acute myocardial infarction in a cohort (24). However, they did not directly compare prognostic powers of visual and quantitative analysis because they used categorized model derived from clinical reports with only normal/abnormal visual assessment. In a recent case-control study, visual and quantitative analysis has been directly compared to evaluate the prognostic value of automated quantitative hypoperfusion parameters derived from adenosine stress MPS for predicting sudden or cardiac death (25). By ROC analysis, the automatically derived stress TPD and blind visual reads (with or without clinical information) had similar predictive capabilities (Figure 4). Based on these findings, we should expect equivalence of visual and quantitative scores in other prognostic comparisons.
Figure 4.
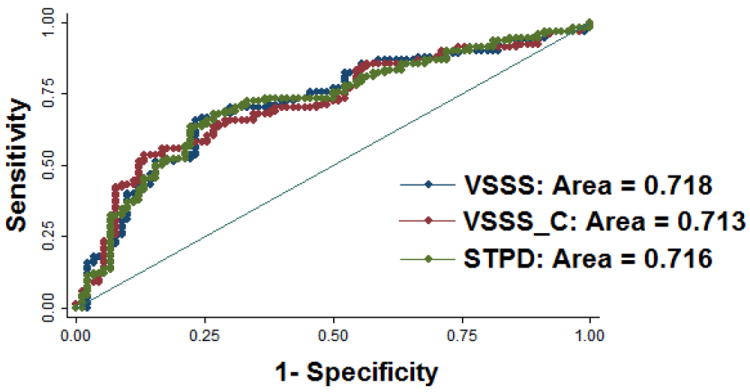
Prediction of cardiac death by quantitative software and visual analysis. ROC curves for evaluating the prognosis power from Cox proportional hazard model including clinical and perfusion parameters. Red ROC curve is the result from the Cox model including clinical and visual perfusion parameters without clinical information and computer quantifications’ aids; blue ROC curve is the result from the Cox model including clinical and visual perfusion parameters with aids of clinical information and computer scores; green ROC curve is the result from the Cox model including the same clinical parameters as in the Cox model for generating red ROC curve and quantitative perfusion parameter. There was no difference in the area-under-the-curve when comparing quantitative and visual determination of myocardial perfusion. (Reproduced with permission from (25))
Analysis of subtle changes
A particularly useful application for the quantitative analysis may be the estimation of subtle perfusion changes. Perfusion changes can be evaluated between stress and rest scans to determine the amount of ischemia. Changes can be also measured between serial scans of the same patient to estimate the progression or regression of the disease. In a widely cited COURAGE trial, quantitative analysis of perfusion was performed with QPS software from Cedars-Sinai Medical Center to compare the changes in ischemia measured by MPS before and after medical therapy and percutaneous coronary intervention (PCI) (26). Greater reduction of ischemia (-2.7%) was shown in the group with PCI therapy than in the group with medical therapy alone (-0.5; p < 0.0001) (Figure 5). Such small group differences may be much harder to demonstrate with visual scoring due to greater inter and intra-observer variability. Consequently, clinical trials based on visual analysis may require considerably larger patient cohorts to show significant differences between study groups.
Figure 5.
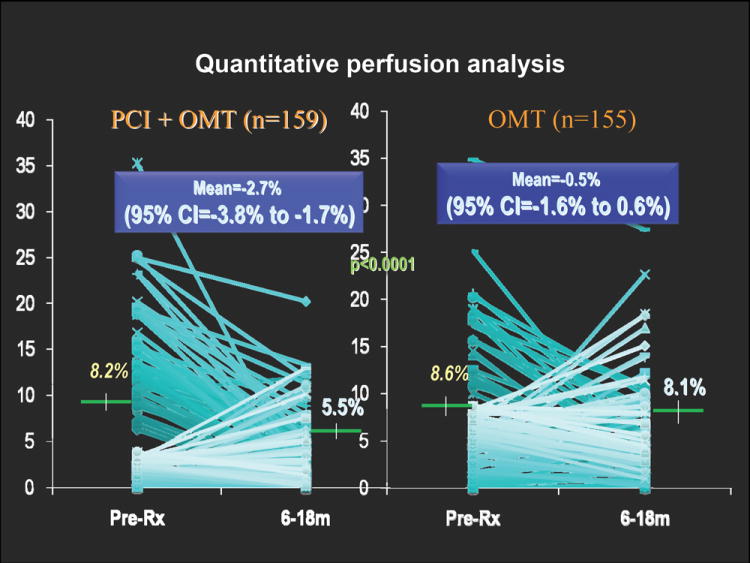
Comparison of inducible ischemia with MPS pretreatment and after 6 to 18 months of optimal medical therapy (OMT) with or without percutaneous coronary intervention (PCI) in COURAGE trail. (Modified with permission from (26))
Conversely, quantitative analysis can be used to demonstrate agreement rather than differences between groups of studies. In a recent study, regadenoson-adenosine and adenosine-adenosine serial data were compared with 4DM software by Mahmarian et al. (27). The authors found good agreement in quantitative stress and ischemia measurements between these two protocols. Over 90% of patients randomized to either group had < 5% absolute difference in quantitative defect size in repeat scan. This is in contrast to another study of similar data with visual analysis based on ischemia categories, where the agreement between the studies was relatively low at 62% (adenosine–adenosine) and 63% (adenosine–regadenoson) (28). Because of the improved reproducibility, the quantitative analysis would have been much more sensitive in discerning any possible changes between these protocols, if they existed.
Ischemia analysis
Perfusion change analysis can be also applied in the same patient study for the estimation of ischemia from the stress/rest data pairs. The visual assessment of the amount of ischemia may be challenging for the visual observer because there can be differences in stress and rest alignment. Additionally, the display may not be normalized optimally to detect subtle changes between rest and stress. Globally, the quantitative ischemia estimate can be performed by simple subtraction of stress and rest quantitative TPD values as was done in the COURAGE trial (26). This standard approach has shown good reproducibility and repeatability (14, 29).
Nevertheless, in efforts to further improve the quantitative analysis of changes, new software methods have been proposed to analyze the stress/rest studies in pairs, eliminating errors associated with multiple comparisons to normal limits and variations in contour placements. A method for automatic quantification of local myocardial perfusion stress–rest changes by 3D registration and stress-rest normalization has been proposed, guaranteeing the same contour of the left ventricle and the same orientation for the stress and rest studies (30). When compared for prediction of stenosis, the area under the receiver operating characteristic curve (0.88 +/- 0.03) was significantly better for the new algorithm than that obtained by the previous quantitative method (0.82 +/- 0.03). One advantage of such an approach is that it can be applied for the quantitative comparison of any pair of studies since it does not require normal limits.
Other advantages
There are also other advantages of employing quantification in clinical trials of new MPS protocols or technologies. A prominent feature of the quantitative analysis is the capability of truly unbiased comparative assessment of diagnostic accuracy or agreement between imaging protocols. Sometimes it may not be feasible to obtain visual scores with readers blinded to the type of protocol, for example for attenuation corrected vs. non corrected data, or for the equivalent data from different scanners. In such cases the visual analysis may be (and often is) biased by observer preferences or skills associated with a particular technology. In contrast, the application of the quantitative software to new types of data will require at most creation of appropriate normal limits (in the case of direct ischemia quantification even this is not required). This can be of particular value in clinical trials, where new MPS technologies or experimental protocols are being compared to standard methods. Furthermore, retrospective computerized analysis can be performed in a small fraction of time and with significantly less resources than are needed for the visual reading. For these reasons, quantitative analysis should often be the preferred method for such studies.
POTENTIAL PITFALLS AND SOLUTIONS
Integration of multiple quantitative parameters
When visual observers derive their final diagnosis from the MPS study, they take into account several imaging features, as well as associated clinical information such as patient response to exercise and symptoms. Additionally, visual observer typically integrates information from multiple image datasets. For example, functional datasets stress and rest, attenuation-corrected and non-corrected sets are all considered when assigning the final perfusion score. This fact may be perceived as a strength of visual analysis and a weakness of quantification, since software algorithms typically report multiple scores (for example one perfusion score for attenuation-corrected dataset and another for non-corrected dataset). There are also image features other than perfusion considered for the final diagnosis. TID ratio is known to be of diagnostic importance (31) and may be considered by the visual observer, but the quantitative perfusion scores do not use this information. The integration of various quantitative parameters and final diagnosis is left to the user. Nevertheless, computer results can be obtained within seconds and therefore it is possible to obtain all of the variables simultaneously and then potentially reconcile multiple parameters to gain an overall improvement of quantitative accuracy –akin to visual analysis.
A few studies have investigated the possibility of combining multiple quantitative parameters with the aim of improving the overall diagnostic accuracy of MPS. In our clinical practice at Cedars-Sinai, we have found that standard perfusion quantification (3) and direct quantification of ischemic change (30) often provide complementary information. Recently, we have explored a computerized combination of direct change with standard normal-limits analysis of stress data (32) on a pixel-by-pixel basis, where subtle deviations from normal limits could be up-scored by corresponding ischemic changes detected by direct change measures. Such a combination allowed a significant increase in the overall diagnostic sensitivity 91% vs. 83% for the detection of coronary disease without any loss of specificity in 997 studies with correlating angiography.
Similarly, the combination of functional assessment obtained from post-stress data and relative perfusion analysis may enhance the ability of MPS to detect significant disease (33). This is typically performed by visual readers when scoring perfusion data with the subjective review of the gated files. Lack of such integration could be seen as a limitation of the quantitative analysis. In efforts to develop an analysis tool with such capabilities, Lima et al. (34) investigated whether supplemented visual reading supplemented with perfusion quantification and coupled with quantitative thickening fractions obtained from gated data can improve the detection of triple-vessel disease. Heuristic rules were then applied to assign abnormality to a given myocardial segment based on perfusion and function results. They found that in patients with triple vessel disease, compared with perfusion alone, combined perfusion/function analysis resulted in significantly greater number of abnormal segments per patient compared with perfusion alone. In a preliminary work, Karimi-Ashtiani et al. investigated this concept in a fully automated quantitative study utilizing standard measures of perfusion and novel measures of motion changes (35). Combined motion/thickening/perfusion polar maps have been derived. It has been demonstrated that a pixel-by-pixel combination of motion/thickening and perfusion results in almost a 2-fold sensitivity increase for the detection of triple vessel disease pattern (abnormalities in all vascular territories). These recent efforts in software developments show that it should be possible to emulate such integrative characteristics of visual reading.
Artifacts
Imaging artifacts are challenging for any quantitative software because they may produce apparent defects mimicking true abnormalities. The artifacts can be caused by patient motion during the scan, photon attenuation, misalignment of attenuation maps, or spillover of extracardiac activity. Well-trained expert readers should be able detect and ignore the majority of them. In contrast, quantitative analysis trained only on the low-likelihood data with normal perfusion and free of artifacts will most likely result in false-positive findings. Nevertheless, efforts have been made to automatically recognize and correct various artifacts. Automatic motion correction and detection can be applied before the quantification process (36) to minimize motion artifacts. Chen et al. have demonstrated that automatic recognition of emission-transmission misalignment for scans with attenuation correction (AC) is possible with high sensitivity and specificity (37) by detection of myocardium-mediastinum mismatch. Software has also been developed to automatically correct for such misalignment errors in PET perfusion imaging (38). Xu et al. have demonstrated that artifacts present in either AC or non-corrected data can also be reconciled by combined analysis of both scans resulting in incremental improvement of the diagnostic accuracy (39). These new developments can help clinicians in recognizing these artifacts and provide quantitative results which take them into account.
When attenuation correction is not available, clinicians may use multiple sets (such as prone and supine) to visually recognize artifacts and reduce false-positive readings (40). A combined quantitative analysis of supine and prone scans has been developed by pixel-wise comparisons of the prone and supine polar maps(41). Subsequently, joint criteria of abnormality were derived from both scans for each myocardial location (see Figure 6). Such a computer algorithm has been shown to be very effective in eliminating the photon attenuation artifacts with an increase in the overall area under the ROC curve and in specificity specificities (86% vs. 65%), when compared to the analysis of the supine data, as confirmed by angiographic validations. Recently, this concept was extended to combined analysis of upright and supine data from the new solid-state MPS scanner, with similar gains in the specificity (42). This method of artifact avoidance by quantitative analysis is likely to have more general applications, whenever presence of artifacts needs to be determined by comparison of data from multiple scans.
Figure 6.
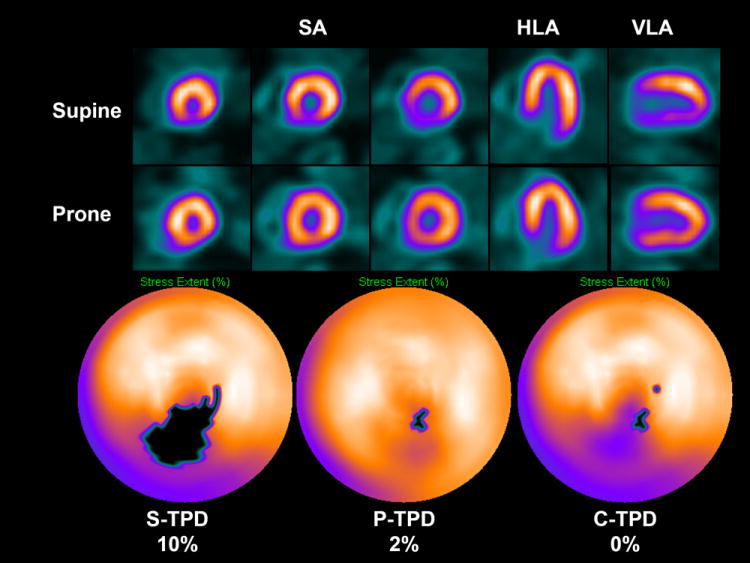
Artifact avoidance by combined supine-prone analysis. An example of supine diaphragmatic attenuation artifact on MPS normalizing on prone MPS in 60-y-old male with history of diabetes, hypertension, hypercholesterolemia, and family history of premature CAD who achieved a heart rate of 148 (89% of maximum predicted heart rate). His body mass index was 34 and the ECG response to exercise stress was ischemic for ST segment depression. Subsequent coronary angiogram showed no significant stenosis. Images displayed in 3 short axis (SA), horizontal long axis (HLA), and vertical long axis (VLA) reveal apparent perfusion abnormality in inferior wall in supine images (top row); however, prone images show uniform tracer distribution (middle row). Quantitative results shown as black-out maps (bottom row) show 10% S-TPD, 2% P-TPD, and 0% C-TPD, consistent with absence of CAD. (Modified with permission from (41))
Normal databases
A potential limitation of the quantitative approach is the need for scanner-specific, protocol-specific or gender-specific normal perfusion databases. Scanners with different geometries will require separate limits since the myocardial count distribution may not be uniform due to regional differences in sensitivity, resolution, photon attenuation and scatter. Imaging tracers, for example 13N-ammonia PET may exhibit specific uptake patterns, necessitating separate limits. Similarly, patient positioning will influence normal myocardial distribution, for example in prone and supine imaging (41). Patient characteristics (such as ethnicity) may also play some role (43). A mismatch between the characteristics of the data used for creation of the normal database and test-data may result in suboptimal quantification results. The protocol-specific normal limits can be easily created by the user from a small group (20-40 subjects) of visually normal scans with low likelihood of disease in most software implementations. Nevertheless, appropriate quality control has to be ensured to verify proper contour placement and to check for possible imaging artifacts. Further studies may be needed to solidify our knowledge regarding differences in the myocardial perfusion patterns in normal subjects. It should be perhaps possible to establish a comprehensive collection of normal limits for the general use by the nuclear cardiology community.
Variation in contour placements
The only element of human interaction required in the quantitative analysis is the potential adjustment of the computer-generated contours in a minority of cases. This manual interaction can introduce some user variability in otherwise fully automatically derived perfusion scores. In efforts to reduce the subjectivity of this step, the software for automatic identification of potentially incorrect contours has been developed (44). Such automated contour check, has demonstrated perfect sensitivity (100%) and very high specificity (98%) for the detection of incorrect shape of the LV as compared to an experienced operator. The software could also predict the need for adjustment of the valve position. Presumably, only a fraction of the studies will need visual verification of the contour by the human observer if these tools are deployed in the clinical practice. Enhanced automation of quantitative analysis enabled by such algorithms may allow accelerated quality control for clinical trials and may further reduce the subjectivity of the quantitative analysis.
Summary
Tools for automated quantification of myocardial perfusion are available to nuclear cardiology practitioners and researchers. These methods have demonstrated superior reproducibility with comparable diagnostic and prognostic performance, when compared with segmental visual scoring by expert observers. A particularly useful application of the quantitative analysis can be in the detection of subtle changes or in precise determination of ischemia. Some challenges remain in the routine application of perfusion quantification. Multiple quantitative parameters may need to be reconciled by the expert reader for the final diagnosis. Computer analysis may be sensitive to imaging artifacts, resulting in false positive scans. Perfusion quantification may require site-specific normal limits and some degree of manual interaction. New software improvements have been proposed to address some of these challenges.
References
- 1.Germano G, Kavanagh PB, Su HT, et al. Automatic reorientation of three-dimensional, transaxial myocardial perfusion SPECT images. J Nucl Med. 1995;36(6):1107–1114. [PubMed] [Google Scholar]
- 2.Faber TL, Cooke CD, Folks RD, et al. Left ventricular function and perfusion from gated SPECT perfusion images: an integrated method. J Nucl Med. 1999;40(4):650–659. [PubMed] [Google Scholar]
- 3.Slomka PJ, Nishina H, Berman DS, et al. Automated Quantification Of Myocardial Perfusion SPECT Using Simplified Normal Limits. J Nucl Cardiol. 2005;12(1):66–77. doi: 10.1016/j.nuclcard.2004.10.006. [DOI] [PubMed] [Google Scholar]
- 4.Van Train KF, Areeda J, Garcia EV, et al. Quantitative same-day rest-stress technetium-99m-sestamibi SPECT: definition and validation of stress normal limits and criteria for abnormality. J Nucl Med. 1993;34(9):1494–1502. [PubMed] [Google Scholar]
- 5.Tilkemeier PL, Cooke CD, Ficaro EP, Glover DK, Hansen CL, McCallister BD., Jr American Society of Nuclear Cardiology information statement: Standardized reporting matrix for radionuclide myocardial perfusion imaging. J Nucl Cardiol. 2006;13(6):e157–171. doi: 10.1016/j.nuclcard.2006.08.014. [DOI] [PubMed] [Google Scholar]
- 6.Berman DS, Hayes SW, Friedman JD, et al. Normal myocardial perfusion SPECT does not imply the absence of significant atherosclerosis. Circulation. 2003 Oct 28;108(17):562–562. [Google Scholar]
- 7.Ficaro EP, Fessler JA, Shreve PD, Kritzman JN, Rose PA, Corbett JR. Simultaneous Transmission/Emission Myocardial Perfusion Tomography : Diagnostic Accuracy of Attenuation-Corrected 99mTc-SestamibiSingle-Photon Emission Computed Tomography. Circulation. 1996 Feb 1;93(3):463–473. doi: 10.1161/01.cir.93.3.463. [DOI] [PubMed] [Google Scholar]
- 8.Slomka PJ, Fish MB, Lorenzo S, et al. Simplified normal limits and automated quantitative assessment for attenuation-corrected myocardial perfusion SPECT. J Nucl Cardiol. 2006 Sep;13(5):642–651. doi: 10.1016/j.nuclcard.2006.06.131. [DOI] [PubMed] [Google Scholar]
- 9.Santana CA, Folks RD, Garcia EV, et al. Quantitative 82Rb PET/CT: Development and Validation of Myocardial Perfusion Database. J Nucl Med. 2007 Jun 15;15:15. doi: 10.2967/jnumed.107.039750. [DOI] [PubMed] [Google Scholar]
- 10.Ficaro EP, Lee BC, Kritzman JN, Corbett JR. Corridor4DM: the Michigan method for quantitative nuclear cardiology. J Nucl Cardiol. 2007 Jul;14(4):455–465. doi: 10.1016/j.nuclcard.2007.06.006. [DOI] [PubMed] [Google Scholar]
- 11.Germano G, Kavanagh PB, Slomka PJ, Van Kriekinge SD, Pollard G, Berman DS. Quantitation in gated perfusion SPECT imaging: The Cedars-Sinai approach. Journal of Nuclear Cardiology. 2007;14(4):433–454. doi: 10.1016/j.nuclcard.2007.06.008. [DOI] [PubMed] [Google Scholar]
- 12.Liu YH. Quantification of nuclear cardiac images: the Yale approach. J Nucl Cardiol. 2007 Jul;14(4):483–491. doi: 10.1016/j.nuclcard.2007.06.005. [DOI] [PubMed] [Google Scholar]
- 13.Garcia EV, Faber TL, Cooke CD, Folks RD, Chen J, Santana C. The increasing role of quantification in clinical nuclear cardiology: the Emory approach. J Nucl Cardiol. 2007 Jul;14(4):420–432. doi: 10.1016/j.nuclcard.2007.06.009. [DOI] [PubMed] [Google Scholar]
- 14.Xu Y, Hayes S, Ali I, et al. Automatic and visual reproducibility of perfusion and function measures for myocardial perfusion SPECT. Journal of Nuclear Cardiology. 2010 Dec;17(6):1050–1057. doi: 10.1007/s12350-010-9297-0. [DOI] [PMC free article] [PubMed] [Google Scholar]
- 15.Slomka PJ, Nishina H, Berman DS, et al. Automated quantification of myocardial perfusion SPECT using simplified normal limits. J Nucl Cardiol. 2005 Jan-Feb;12(1):66–77. doi: 10.1016/j.nuclcard.2004.10.006. [DOI] [PubMed] [Google Scholar]
- 16.PJ Slomka YX, Fish M, Gerlach J, Dorbala S, Berman DS, Germano G. Comparison of fully automated computer analysis and visual scoring for detection of coronary artery disease (CAD) from myocardial perfusion SPECT (MPS) in a Large Population. J Nucl Med. 2009;50(Supp 2):215. doi: 10.2967/jnumed.112.108969. [DOI] [PMC free article] [PubMed] [Google Scholar]
- 17.Hachamovitch R, Hayes SW, Friedman JD, Cohen I, Berman DS. A prognostic score for prediction of cardiac mortality risk after adenosine stress myocardial perfusion scintigraphy. J Am Coll Cardiol. 2005 Mar 1;45(5):722–729. doi: 10.1016/j.jacc.2004.08.069. [DOI] [PubMed] [Google Scholar]
- 18.Shaw LJ, Berman DS, Hendel RC, Borges Neto S, Min JK, Callister TQ. Prognosis by coronary computed tomographic angiography: matched comparison with myocardial perfusion single-photon emission computed tomography. J Cardiovasc Comput Tomogr. 2008;2(2):93–101. doi: 10.1016/j.jcct.2007.12.016. Epub 2008 Jan 2012. [DOI] [PubMed] [Google Scholar]
- 19.Hachamovitch R, Kang X, Amanullah AM, et al. Prognostic implications of myocardial perfusion single-photon emission computed tomography in the elderly. Circulation. 2009 Dec 1;120(22):2197–2206. doi: 10.1161/CIRCULATIONAHA.108.817387. [DOI] [PubMed] [Google Scholar]
- 20.Hachamovitch R, Berman DS, Shaw LJ, et al. Incremental prognostic value of myocardial perfusion single photon emission computed tomography for the prediction of cardiac death: differential stratification for risk of cardiac death and myocardial infarction. Circulation. 1998 Feb 17;97(6):535–543. doi: 10.1161/01.cir.97.6.535. [DOI] [PubMed] [Google Scholar]
- 21.Hachamovitch R, Berman DS, Kiat H, et al. Incremental prognostic value of adenosine stress myocardial perfusion single-photon emission computed tomography and impact on subsequent management in patients with or suspected of having myocardial ischemia. Am J Cardiol. 1997 Aug 15;80(4):426–433. doi: 10.1016/s0002-9149(97)00390-1. [DOI] [PubMed] [Google Scholar]
- 22.Amanullah AM, Berman DS, Erel J, et al. Incremental prognostic value of adenosine myocardial perfusion single-photon emission computed tomography in women with suspected coronary artery disease. Am J Cardiol. 1998 Sep 15;82(6):725–730. doi: 10.1016/s0002-9149(98)00463-9. [DOI] [PubMed] [Google Scholar]
- 23.Pazhenkottil AP, Ghadri JR, Nkoulou RN, et al. Improved outcome prediction by SPECT myocardial perfusion imaging after CT attenuation correction. J Nucl Med. 2011 Feb;52(2):196–200. doi: 10.2967/jnumed.110.080580. [DOI] [PubMed] [Google Scholar]
- 24.Leslie WD, Tully SA, Yogendran MS, Ward LM, Nour KA, Metge CJ. Prognostic value of automated quantification of Tc-99m-sestamibi myocardial perfusion imaging. Journal of Nuclear Medicine. 2005 Feb;46(2):204–211. [PubMed] [Google Scholar]
- 25.Xu Y, Nakazato R, Hayes S, et al. Prognostic value of automated vs visual analysis for adenosine stress myocardial perfusion SPECT in patients without prior coronary artery disease: A case-control study. J Nucl Cardiol. 2011;18(6):1003–1009. doi: 10.1007/s12350-011-9449-x. Epub 2011 Sep 1020. [DOI] [PMC free article] [PubMed] [Google Scholar]
- 26.Shaw LJ, Berman DS, Maron DJ, et al. Optimal Medical Therapy With or Without Percutaneous Coronary Intervention to Reduce Ischemic Burden: Results From the Clinical Outcomes Utilizing Revascularization and Aggressive Drug Evaluation (COURAGE) Trial Nuclear Substudy. Circulation. 2008;117(10):1283. doi: 10.1161/CIRCULATIONAHA.107.743963. [DOI] [PubMed] [Google Scholar]
- 27.Mahmarian JJ, Cerqueira MD, Iskandrian AE, et al. Regadenoson induces comparable left ventricular perfusion defects as adenosine: a quantitative analysis from the ADVANCE MPI 2 trial. JACC Cardiovasc Imaging. 2009;2(8):959–968. doi: 10.1016/j.jcmg.2009.04.011. [DOI] [PubMed] [Google Scholar]
- 28.Cerqueira MD, Nguyen P, Staehr P, Underwood SR, Iskandrian AE. Effects of age, gender, obesity, and diabetes on the efficacy and safety of the selective A2A agonist regadenoson versus adenosine in myocardial perfusion imaging integrated ADVANCE-MPI trial results. JACC Cardiovasc Imaging. 2008;1(3):307–316. doi: 10.1016/j.jcmg.2008.02.003. [DOI] [PubMed] [Google Scholar]
- 29.Berman DS, Kang X, Gransar H, et al. Quantitative assessment of myocardial perfusion abnormality on SPECT myocardial perfusion imaging is more reproducible than expert visual analysis. Journal of Nuclear Cardiology. 2009 Jan-Feb;16(1):45–53. doi: 10.1007/s12350-008-9018-0. [DOI] [PMC free article] [PubMed] [Google Scholar]
- 30.Slomka PJ, Nishina H, Berman DS, et al. Automatic quantification of myocardial perfusion stress-rest change: a new measure of ischemia. J Nucl Med. 2004 Feb;45(2):183–191. [PubMed] [Google Scholar]
- 31.Mazzanti M, Germano G, Kiat H, et al. Identification of severe and extensive coronary artery disease by automatic measurement of transient ischemic dilation of the left ventricle in dual-isotope myocardial perfusion SPECT. J Am Coll Cardiol. 1996;27(7):1612–1620. doi: 10.1016/0735-1097(96)00052-6. [DOI] [PubMed] [Google Scholar]
- 32.Prasad M, Slomka PJ, Fish M, et al. Improved quantification and normal limits for myocardial perfusion stress-rest change. J Nucl Med. 2010 Feb;51(2):204–209. doi: 10.2967/jnumed.109.067736. [DOI] [PMC free article] [PubMed] [Google Scholar]
- 33.Emmett L, Iwanochko RM, Freeman MR, Barolet A, Lee DS, Husain M. Reversible regional wall motion abnormalities on exercise technetium-99m-gated cardiac single photon emission computed tomography predict high-grade angiographic stenoses. J Am Coll Cardiol. 2002 Mar 20;39(6):991–998. doi: 10.1016/s0735-1097(02)01707-2. [DOI] [PubMed] [Google Scholar]
- 34.Lima RS, Watson DD, Goode AR, et al. Incremental value of combined perfusion and function over perfusion alone by gated SPECT myocardial perfusion imaging for detection of severe three-vessel coronary artery disease. J Am Coll Cardiol. 2003 Jul 2;42(1):64–70. doi: 10.1016/s0735-1097(03)00562-x. [DOI] [PubMed] [Google Scholar]
- 35.Karimi-Ashtiani S, Fish F, Berman D, Kavanagh P, Germano G, Slomka PJ. Development of new rest-stress motion change measure for myocardial perfusion SPECT. J Nucl Cardiol. 2011;18(4):748–800. [Google Scholar]
- 36.Matsumoto N, Berman DS, Kavanagh PB, et al. Quantitative assessment of motion artifacts and validation of a new motion-correction program for myocardial perfusion SPECT. J Nucl Med. 2001;42(5):687–694. [PubMed] [Google Scholar]
- 37.Chen J, Caputlu-Wilson SF, Shi H, Galt JR, Faber TL, Garcia EV. Automated quality control of emission-transmission misalignment for attenuation correction in myocardial perfusion imaging with SPECT-CT systems. J Nucl Cardiol. 2006 Jan-Feb;13(1):43–49. doi: 10.1016/j.nuclcard.2005.11.007. [DOI] [PubMed] [Google Scholar]
- 38.Alessio AM, Kinahan PE, Champley KM, Caldwell JH. Attenuation-emission alignment in cardiac PET/CT based on consistency conditions. Med Phys. 2010 Mar;37(3):1191–1200. doi: 10.1118/1.3315368. [DOI] [PMC free article] [PubMed] [Google Scholar]
- 39.Xu Y, Fish M, Gerlach J, et al. Combined quantitative analysis of attenuation corrected and non-corrected myocardial perfusion SPECT: Method development and clinical validation. Journal of Nuclear Cardiology. 2010 Aug;17(4):591–599. doi: 10.1007/s12350-010-9220-8. [DOI] [PMC free article] [PubMed] [Google Scholar]
- 40.Hayes SW, De Lorenzo A, Hachamovitch R, et al. Prognostic implications of combined prone and supine acquisitions in patients with equivocal or abnormal supine myocardial perfusion SPECT. J Nucl Med. 2003 Oct;44(10):1633–1640. [PubMed] [Google Scholar]
- 41.Nishina H, Slomka PJ, Abidov A, et al. Combined Supine and Prone Quantitative Myocardial Perfusion SPECT: Method Development and Clinical Validation in Patients with No Known Coronary Artery Disease. Soc Nuclear Med. 2006;47:51–58. [PubMed] [Google Scholar]
- 42.Nakazato R, Tamarappoo BK, Kang X, et al. Quantitative upright-supine high-speed SPECT myocardial perfusion imaging for detection of coronary artery disease: correlation with invasive coronary angiography. J Nucl Med. 2010 Nov;51(11):1724–1731. doi: 10.2967/jnumed.110.078782. [DOI] [PMC free article] [PubMed] [Google Scholar]
- 43.Nakajima K, Okuda K, Kawano M, et al. The importance of population-specific normal database for quantification of myocardial ischemia: comparison between Japanese 360 and 180-degree databases and a US database. Journal of Nuclear Cardiology. 2009 May-Jun;16(3):422–430. doi: 10.1007/s12350-009-9049-1. [DOI] [PMC free article] [PubMed] [Google Scholar]
- 44.Xu Y, Kavanagh P, Fish M, et al. Automated quality control for segmentation of myocardial perfusion SPECT. J Nucl Med. 2009 Sep;50(9):1418–1426. doi: 10.2967/jnumed.108.061333. [DOI] [PMC free article] [PubMed] [Google Scholar]


