Abstract
Purpose
To provide a mechanism-based model to quantitatively describe GLP-1 pharmacokinetics (PK) and pharmacodynamics (PD) in rats.
Methods
Intravenous (IV), infusion (IF), subcutaneous (SC), and intraperitoneal (IP) doses of GLP-1 were administered after glucose challenge in healthy Sprague–Dawley rats. Blood was analyzed for GLP-1, glucose, and insulin. The PK-PD modeling was performed with ADAPT 5. The concentration-response curve was generated and analyzed in comparison with other incretin-related therapeutics.
Results
The PK of GLP-1 was described using a two-compartment model with a zero-order input accounting for endogenous GLP-1 synthesis. For SC and IP dosing, sequential zero-order and first-order absorption models reasonably described the rapid absorption process and flip-flop kinetics. In dynamics, GLP-1 showed insulinotropic effects (3-fold increase) after IV glucose challenge in a dose-dependent manner. The concentration-response curve was bell-shaped, which was captured using a biphasic two-binding site Adair model. Receptor binding of GLP-1 exhibited high capacity and low affinity kinetics for both binding sites (KD=09.94×10³ pM, K2=1.56×10⁻⁴ pM−1).
Conclusions
The PK of GLP-1 was linear and bi-exponential and its PD showed glucose-dependent insulinotropic effects. All profiles were captured by the present mechanistic model and the dynamic analysis yields several implications for incretin-related therapies.
Keywords: glucagon-like peptide-1, glucose, incretin, insulin, pharmacokinetics, pharmacodynamics
INTRODUCTION
Incretins are gastrointestinal hormones that help manage glycemic control by regulating insulin and glucagon release, slowing gastric emptying, and reducing caloric intake (1). Glucagon-like peptide 1 (GLP-1) and glucose-dependent insulinotropic polypeptide (GIP), secreted from the L-cells of the lower gut and K-cells of the intestines, are two major incretins and contribute to these effects. Much evidence has shown that secretion of GLP-1 is impaired in type 2 diabetes mellitus and enhancing and maintaining GLP-1 secretion is beneficial in managing glycemic control (2). Currently, incretin-based therapy is used in treatment of type 2 diabetes. However, native GLP-1, after release into blood, is rapidly degraded by dipeptidyl peptidase-4 (DPP-4). The short half-life of native GLP-1 limits its clinical value. Two main approaches have emerged to reduce this problem (3). One approach is use of GLP-1 receptor agonists that are resistance to DDP-4 degradation. Another is GLP-1 degradation enzyme inhibitors, generally termed DPP-4 inhibitors, which amplify the effect of naturally occurring GLP-1. Recently, subcutaneous infusion of native GLP-1 was found to provide sufficient concentrations and was effective in diabetes (4).
Rapid degradation of native GLP-1 frustrates its clinical utility. However, characterizing its pharmacokinetics (PK) and pharmacodynamics (PD) is of importance to understand the incretin/glucose/insulin system. Particularly, GLP-1 is a direct marker reflecting DPP-4 inhibitor action and assessing GLP-1 pharmacokinetics may help optimize therapy of DPP-4 inhibitors. In addition, GLP-1 shows similarities to other GLP-1 receptor agonists and knowing its PK/PD would allow better evaluation of these agents.
Studies by Amylin Pharmaceuticals, Inc. assessed the PK of GLP-1 over a wide range of doses via several dosing routes, as well as the insulinotropic effects after glucose challenges in healthy rats (5,6). However, the PK of GLP-1 and these effects have not been modeled. The aim of this study was to propose a mechanism-based PK/PD model to describe GLP-1 kinetics and its insulinotropic dynamics. An unusual GLP-1 and receptor relationship was found. We further examined the concentration-response relationship and provided analysis of relevance to current incretin-related therapies.
MATERIALS AND METHODS
Experimental Procedures
Data were provided by Amylin Pharmaceuticals, Inc., with details published by Parkes et al. (5,6). For PK studies, GLP-1-(7–36)-amide was injected via intravenous bolus (IV), 3-h continuous intravenous infusion (IF), subcutaneous (SC) bolus, and intraperitoneal (IP) bolus at doses: 0.05, 5 and 50 nmol (IV), and at 0.5, 5 and 50 nmol/h (IF), and at 0.5, 5 and 50 nmol (SC and IP). Samples were collected at frequent times for GLP-1 analysis over 6.5 h after dosing. For the PD study, at least 60 min after surgery, beginning at t=0, saline only (1mL/h), or GLP-1 were infused at doses of 3, 30, 300, and 3,000 pmol/kg/min throughout the experiment. Thirty minutes after beginning GLP-1 or saline infusion, D-glucose (5.7 mmol/kg) was injected IV at a rate of 0.5 mL/min over 2–3 min. Blood samples (150 µL) were collected for glucose and insulin analysis at 0, 15, 30, 35, 40, 45, 50, 60, 70, 80, 90, and 120 min.
The active form of GLP-1 (7–36) was analyzed with a validated GLP-1 enzyme-linked immunosorbent assay (5).
Pharmacokinetic/Pharmacodynamic Model
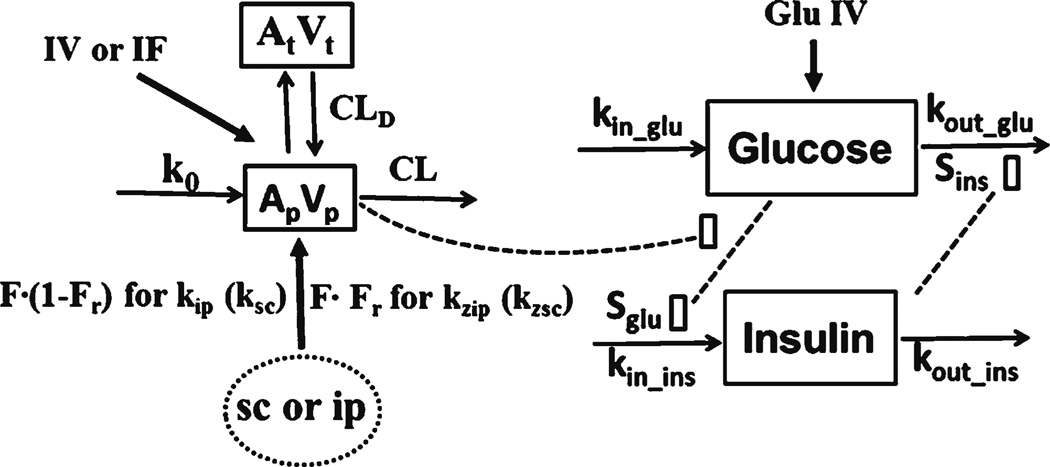
Figure 1 shows the PK/PD model of GLP-1. The kinetics of GLP-1 was described by a two-compartment model with linear elimination. A zero-order endogenous synthesis rate (k0) into blood accounted for the GLP-1 baseline. The IV bolus and IF data were simultaneously fitted to estimate the disposition parameters. For SC and IP dosing, these disposition parameters were fixed to estimate IP and SC absorption parameters. Zero-order and first-order sequential absorption rates were finally selected based on visual inspection of curve fitting and variability of parameter estimations. The sparse data during the absorption phases did not support an accurate zero-order rate (kz). Therefore, zero-order absorption kz was assumed to be complete at the first sampling time (5 min).
Fig. 1.
PK/PD model for charactering the time course of GLP-1 after several routes of dosing and dynamics of glucose-dependent insulinotropic acting process. Symbols are defined in Tables I and II.
The equations for GLP-1 kinetics are
| (1) |
| (2) |
| (3) |
| (4) |
where Ap and At are GLP-1 amounts in the central and peripheral compartments, Vp is central distribution volume, Input is the amount absorbed per min from the absorption compartment, Vt is peripheral volume, CLd is distribution clearance, k0 is GLP-1 endogenous synthesis rate, and CL is systemic clearance, and ke is first-order elimination rate (ke = CL/Vp). For SC bolus and IP, F indicates absorption bioavailability and Fr represents the fraction of dose absorbed by the zero-order process. The k is first-order absorption rate (specified as ksc and kip for SC and IP), τ is the duration of zero-order absorption (assumed to be the first sampling time), the k and F were estimated separately among doses, and λ equals 1 before time τ and 0 otherwise.
The pharmacodynamic model proposed for insulintropic effects of GLP-1 is shown in Fig. 1. Blood glucose is available from nutritional intake and endogenous gluconeogenesis and glycogen breakdown. It can be utilized for energy, stored as glycogen, and/or transformed into fat. In healthy rats, glucose will activate beta cells to synthesize and release insulin. Insulin will lower glucose by inhibiting gluconeogenesis and glycogenolysis, as well as stimulating glucose uptake and utilization in peripheral tissues. Physiologically, an increase in blood glucose concentrations stimulates insulin secretion and the resulting increased insulin in turn increases glucose utilization, eventually reducing glucose concentrations back to baseline. A central characteristic of the glucose-insulin system is the reciprocal feedback relationship. The challenge of modeling this system is the circular behavior and mostmodels do not include the feedback.
Indirect response models are usually employed to describe changes in endogenous substances (7). Lima et al. (8) used a dual indirect response model involving feedback regulation and homeostasis to describe the glucose-insulin system. Such model was extended by adding the glucose-dependent insulinotropic effect of GLP-1. After analyzing several possible mechanisms (see Discussion), a two binding site Adair model was hypothesized to describe the bell-shaped dose–response relationship of GLP-1 on insulin secretion (9).
The following equations describe the dynamic model:
| (5) |
| (6) |
where Glu and Ins are blood glucose and insulin concentration, kin_glu is zero-order glucose input, kout_glu is first-order glucose elimination rate, kin_ins is zero-order insulin input, kout_ins is insulin first-order elimination rate, Sins is stimulation index of insulin on glucose utilization, G is glucose intravenous challenge amount (5.7 mmol/kg), Cp is plasma concentration of GLP-1 (= Ap/Vp), Vglu is glucose distribution volume, and Sglu is stimulation index of glucose on insulin secretion. The Ins0 and Glu0 are insulin and glucose baselines, Rmax is maximal activation of the glucose-dependent insulinotropic effect by GLP-1, KD is the dissociation constant for the first binding site, and K2 is the association constant for the second binding site.
Due to limited data supporting the descending trend in the Adair model, the parameters in the Adair (Rmax, KD, K2) function were estimated with high variability. Therefore we did a sensitivity analysis of Rmax around the initial estimate. In the final model, all parameters were estimated simultaneously except Rmax which was fixed to 10.
The GLP-1 bell-shaped concentration-response curve was further simulated and analyzed in comparison with other incretin-related therapies.
Data Analysis
The ADAPT 5 program with the maximum likelihood method was used for all modeling (10). All fittings are based on mean data and a linear variance model was used in all fittings as:
| (7) |
where Vi is the variance of the response at the ith time point, ti is the actual time at the ith time point, and ϒ(ti) represents the predicted response at time ti from themodel. Variance parameters σ1 and σ2 were estimated together with system parameters during fittings. The goodness-of-fit criteria included visual inspection of the fitted curves, sum of squared residuals, Akaike information criterion, Schwartz criterion, and coefficients of variation (CV) of the estimated parameters.
RESULTS
GLP-1 Pharmacokinetics
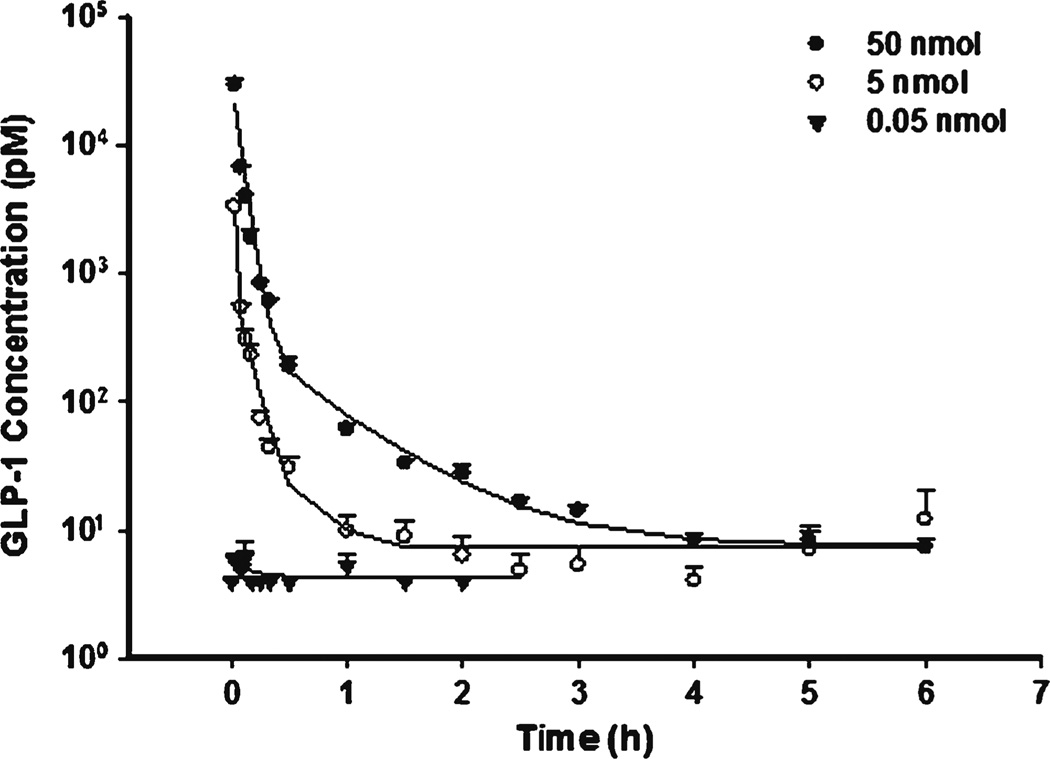
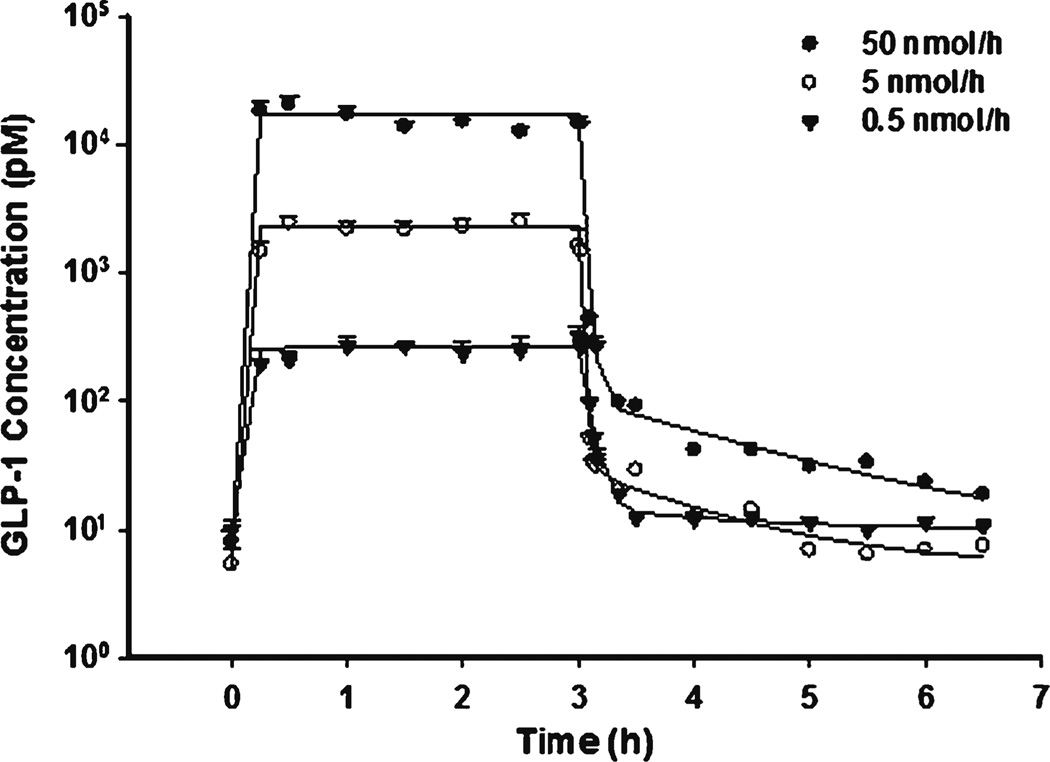
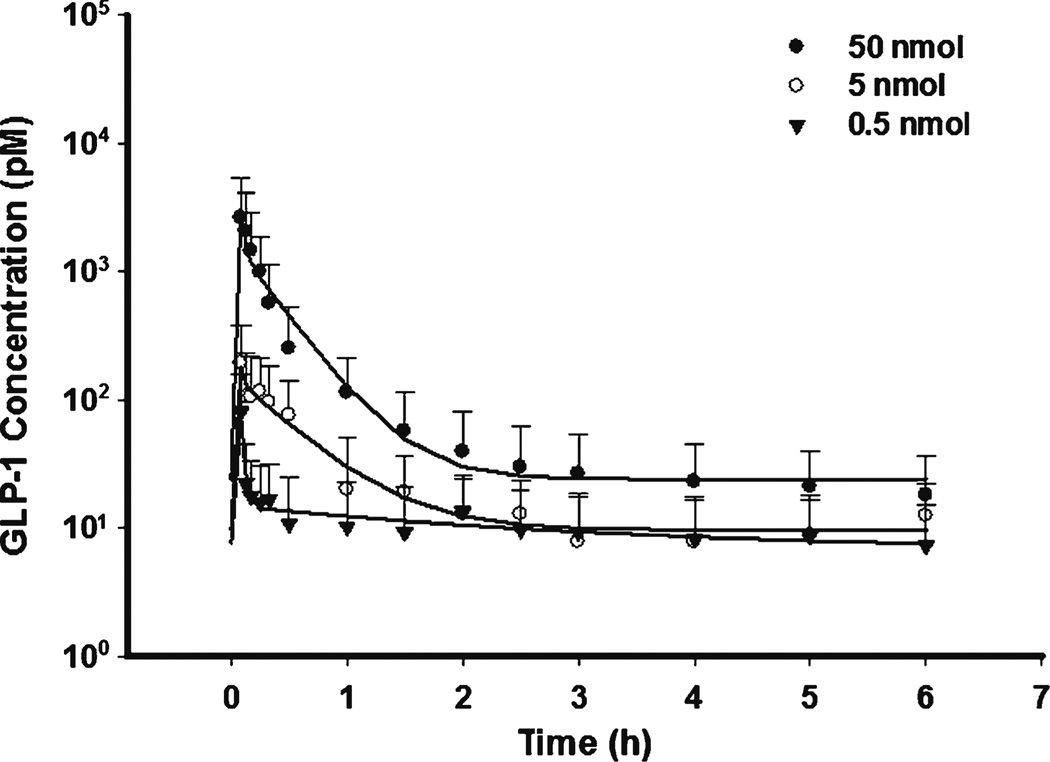
The time course of GLP-1 concentrations after IV bolus is shown in Fig. 2. Blood concentrations declined rapidly because of degradation by DPP-4. The estimated CL was 11270 ml/h/kg (t1/2 about 1.0 min), consistent with previous reported values (11). As shown in Fig. 3 during IF dosing, GLP-1 reached steady-state almost instantly due to its short half-life. The relatively shallow curve following the rapid decrease phase in IV profiles reflects the typical profile of the endogenous generation. Unlike other macromolecules, GLP-1 central volume Vp (202 ml/kg) was higher than blood volume, implying GLP-1 could effectively diffuse into peripheral fluids. The Vt was about 87.4 ml/kg and CLd was relatively high (233 ml/kg) indicating rapid distribution into peripheral tissues.
Fig. 2.
Pharmacokinetic profiles of GLP-1 after fitting the PK model to the mean data of three single IV bolus doses. Error bars represent standard deviations in all figures.
Fig. 3.
Pharmacokinetic profiles of GLP-1 after fitting PK model to the mean data of three single infusion doses.
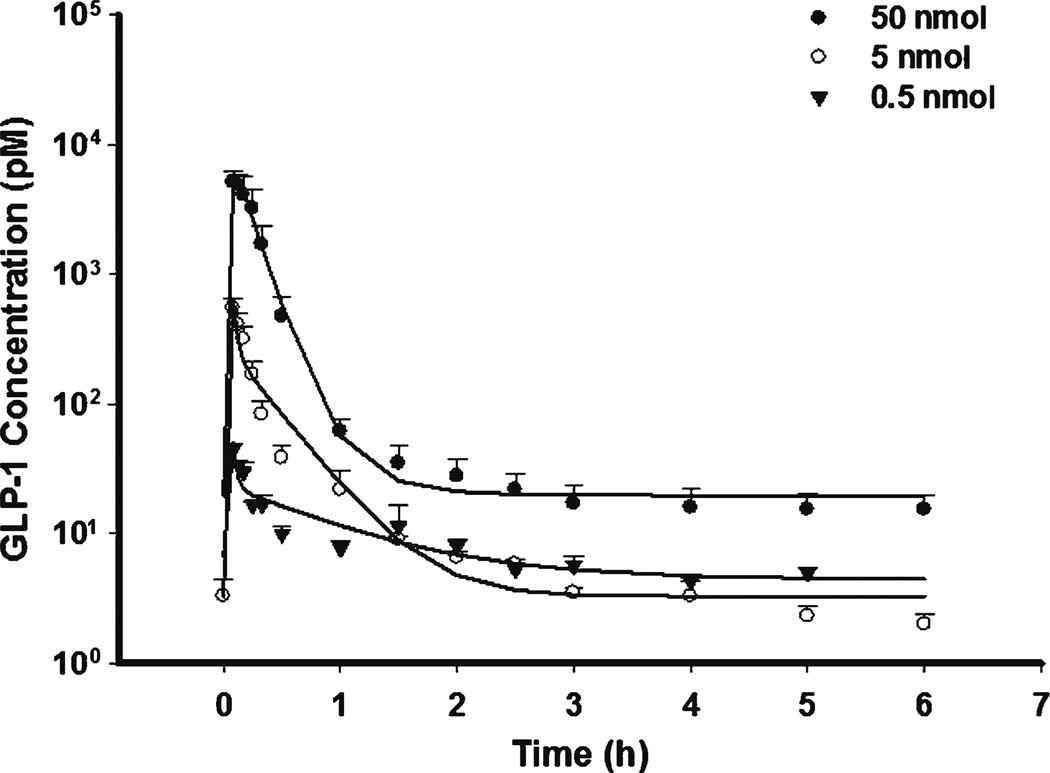
The GLP-1 PK profiles are shown in Figs. 4 and 5 for SC and IP dosing. The data were well described by a rapid zero-order and first-order absorption model. The estimated first-order absorption rates (ksc or kip) were lower than the elimination rate (CL/Vp), suggesting that flip-flop kinetics occurred. The limited data during the absorption phase made it difficult to precisely estimate the absorption rate and resulted in high parameter variability. Therefore, zero-order absorption was assumed to be complete at the first sampling time (5 min). Bioavailability was estimated separately for each dose which improved fitting in spite of close estimates. The estimated bioavailability of SC (7.3–10.9%) and IP (3.7–13.9%) were much smaller than reported values derived from non-compartment analysis (36–71%), in which the fractional area before first sampling time (5 min) might not be accurately calculated in IV dosing (5). Actually 5 min was about 5 half-lives (t1/2 01 min) and an appreciable amount of GLP-1 must have already been degraded over that period after IV dosing. Therefore, one possible explanation for the reported higher bioavailability of SC and IP dosing was the underestimation of the AUC after IV injection.
Fig. 4.
Pharmacokinetic profiles of GLP-1 after fitting PK model to the mean data of three single SC bolus doses.
Fig. 5.
Pharmacokinetic profiles of GLP-1 after fitting PK model to the mean data of three single IP bolus doses.
The endogenous synthesis rate k0 varied according to baseline. The reason for such obviously varied baselines was not clear in this study but higher baselines more often occurred with high doses. All of the kinetic parameters are summarized in Table I.
Table I.
Pharmacokinetic Parameters for GLP-1
| Parameter | Unit | Definition | Value | CV(%)a |
|---|---|---|---|---|
| CL | ml/h/kg | Clearance | 11270 | 20.9 |
| ke | 1/h | First-order elimination rate | 55.8 | 22.9 |
| CLd | ml/kg/h | Distribution clearance | 233 | 1.78 |
| Vp | ml/kg | Central compartment volume | 202 | 1.67 |
| Vt | ml/kg | Peripheral compartment volume | 87.4 | 1.12 |
| kob | pM/kg/h | Zero-order synthesis rate | 57.5 | 162 |
| kscc | 1/h | First-order absorption rate for sc dose | 5.14 | 16.5 |
| Fr | % | Fraction by zero-order absorption (SC) | 30.2 | 19.2 |
| Fsc | % | Bioavailability for sc dosing 0.5, 5, 50 nmol | 10.9/7.3/7.6 | 21.0/13.2/5.12 |
| kipc | 1/h | First-order absorption rate for IP doses | 2.59 | 38.0 |
| Fr | % | Fraction by zero-order absorption (IP) | 26.7 | 15.7 |
| Fip | % | Bioavailability for IP dosing 0.5, 5, 50 nmol | 13.9/3.9/3.7 | 68.7/8.7/8.9 |
Coefficient of variation of the estimate, not reflective of inter-animal variability.
Average value used for prediction, k0 varied according to baselines.
Average value for three doses.
GLP-1 Pharmacodynamics
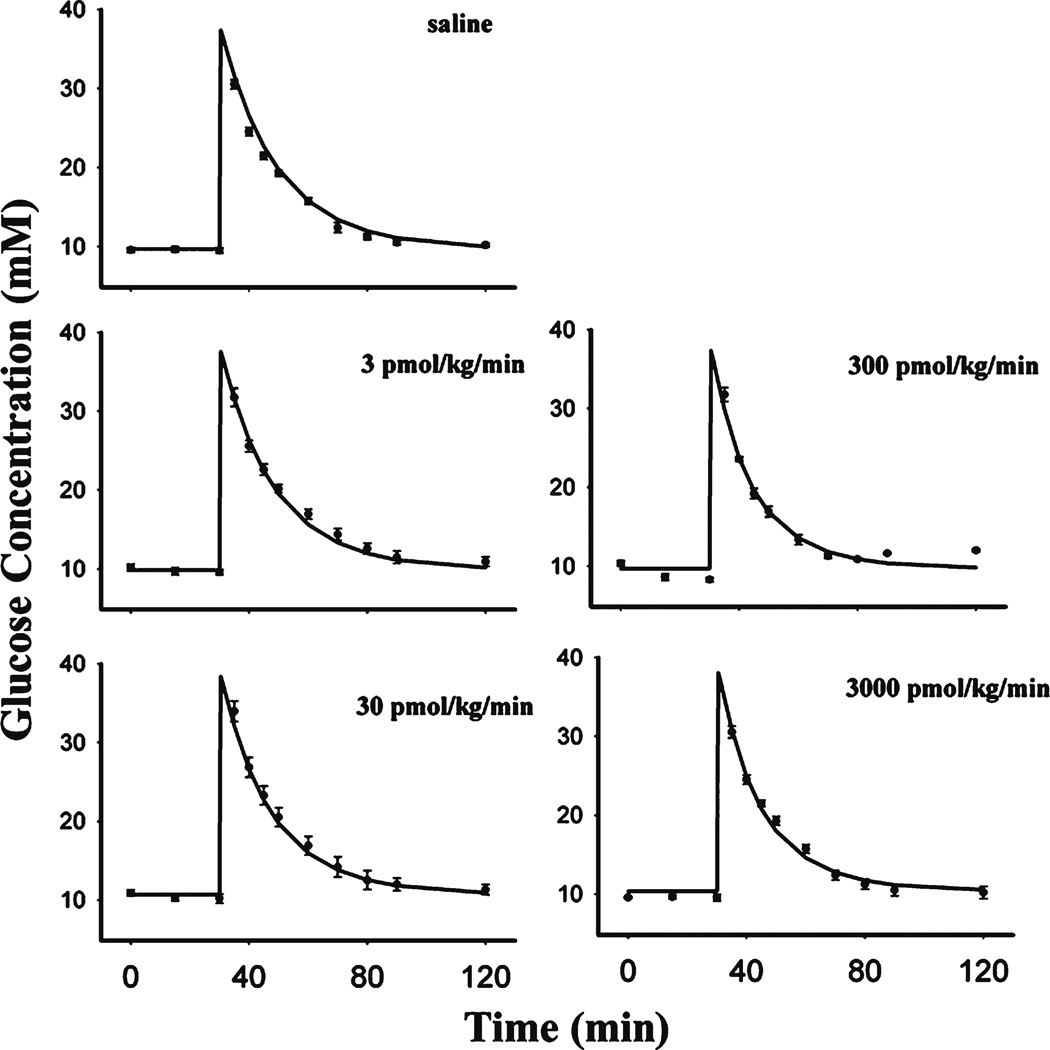
The dynamics of glucose, along with the model fittings, are depicted in Fig. 6. The parameters describing glucose kinetics are summarized in Table II. All groups were fitted simultaneously. Glucose concentrations returned to baseline at about 1 h after glucose challenge. Overall, the present model very well captured the glucose profiles. Glucose volume of distribution Vglu (0.201 L/kg) and elimination rate kout_glu (0.0445 h−1) were both close to reported values (12,13). Despite remarkable changes of insulin concentrations among groups, the glucose concentrations were similar. This can be explained by glucose disposal being less insulin-dependent than glucose-dependent in rodents (14), resulting in a low value of Sins (0.00032 L/pmol).
Fig. 6.
Glucose profiles after fitting the PD model to the mean data during several single IV infusion doses of GLP-1
Table II.
Pharmacodynamic Parameters for GLP-1
| Parameter | Unit | Definition | Value | CV(%)b |
|---|---|---|---|---|
| kout_insa | 1/min | First-order elimination rate of insulin | 0.618 | 63.3 |
| kout_glua | 1/min | First-order elimination rate of glucose | 0.0445 | 6.14 |
| Sglu | L/mmol | Stimulation of insulin secretion by glucose | 0.0643 | 10.8 |
| Sins | L/pmol | Stimulation of glucose utilization by insulin | 3.23 × 10⁻⁴ | 25.2 |
| RMax | _c | Maximal effect of glucose-dependent insulin secretion | 10.0 | _c |
| KD | pmol/L | Dissociation rate for first receptor binding site | 9.94 × 10³ | 31.6 |
| K2 | L/pmol | Association rate for second binding site | 1.56× 10⁻⁴ | 29.5 |
| Vglu | L/kg | Glucose volume of distribution | 0.201 | 2.91 |
The kout_ins and Kout_glu varied among groups according to baseline.
Coefficient of variation of the estimate, not reflective of inter-animal variability.
Not applicable
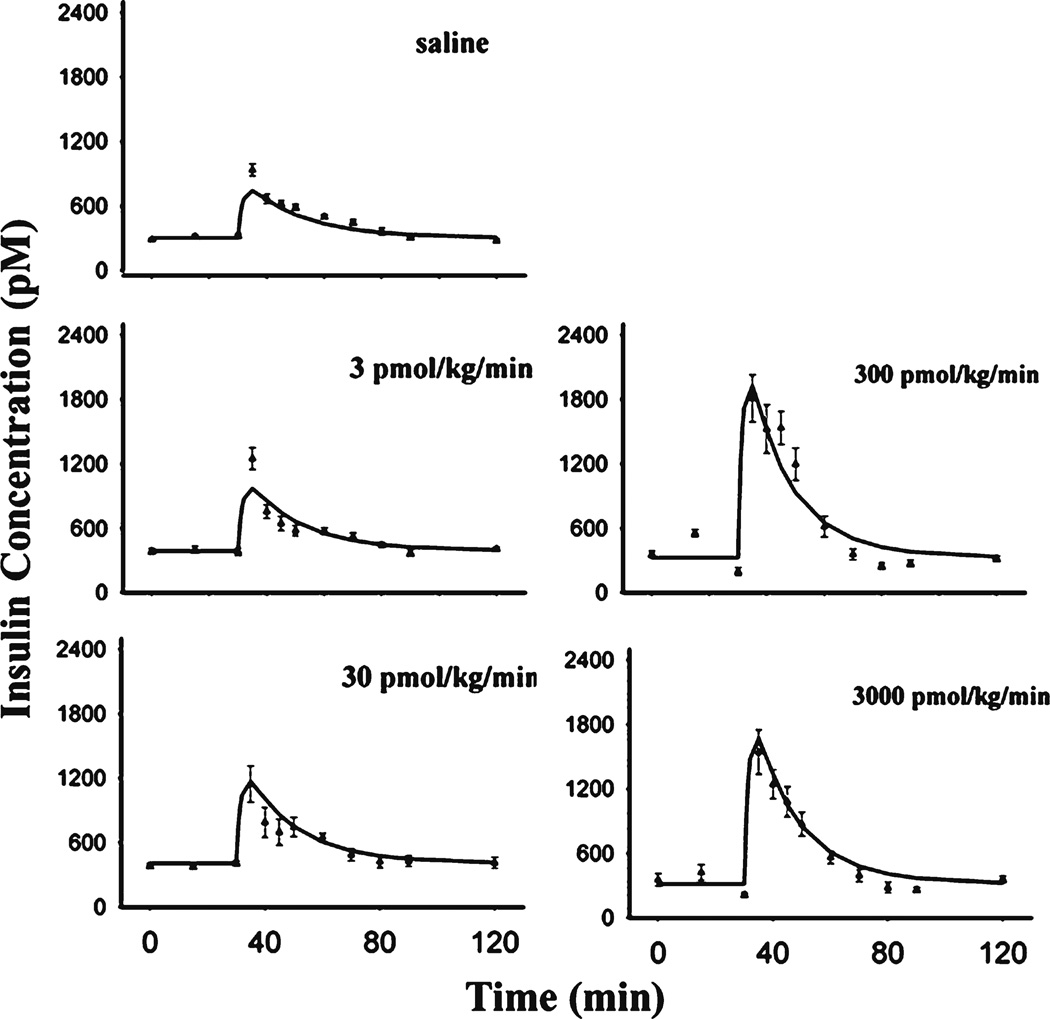
The time course of insulin and fitted curves are shown in Fig. 7 and estimated parameters were summarized in Table II. GLP-1 did not show noticeable effects before glucose challenge, consistent with previous reports that the insulinotropic effect of GLP-1 was glucose-dependent (15). After glucose dosing, GLP-1 markedly promoted insulin secretion. The estimated insulin elimination rate kout_ins was 0.618 min−1 (t1/2 about 1 min), within the reported range (16). Of interest, GLP-1 augmented the glucose-induced insulin secretion in an unusual dose-dependent manner. The maximum potentiation of insulin secretion occurred in the 300 pmol/kg/min GLP-1 dosing group whereas the higher GLP-1 dose of 3000 pmol/kg/min elicited less effect. Thus a Hill function would not suffice to describe this biphasic relationship. In our model, the two binding site Adair equation was applied, assuming two binding sites existed on GLP-1 receptors: one site related to activation of insulin release and the other binding site negatively modulating the activation. The Adair model has been utilized to characterize allosteric modulation of receptor or enzyme kinetics (9,17). In the present model, the Adair model was limited to two binding sites, which describes our data quite well.
Fig. 7.
Insulin profiles after fitting the PD model to the mean data during several single IV infusion doses of GLP-1
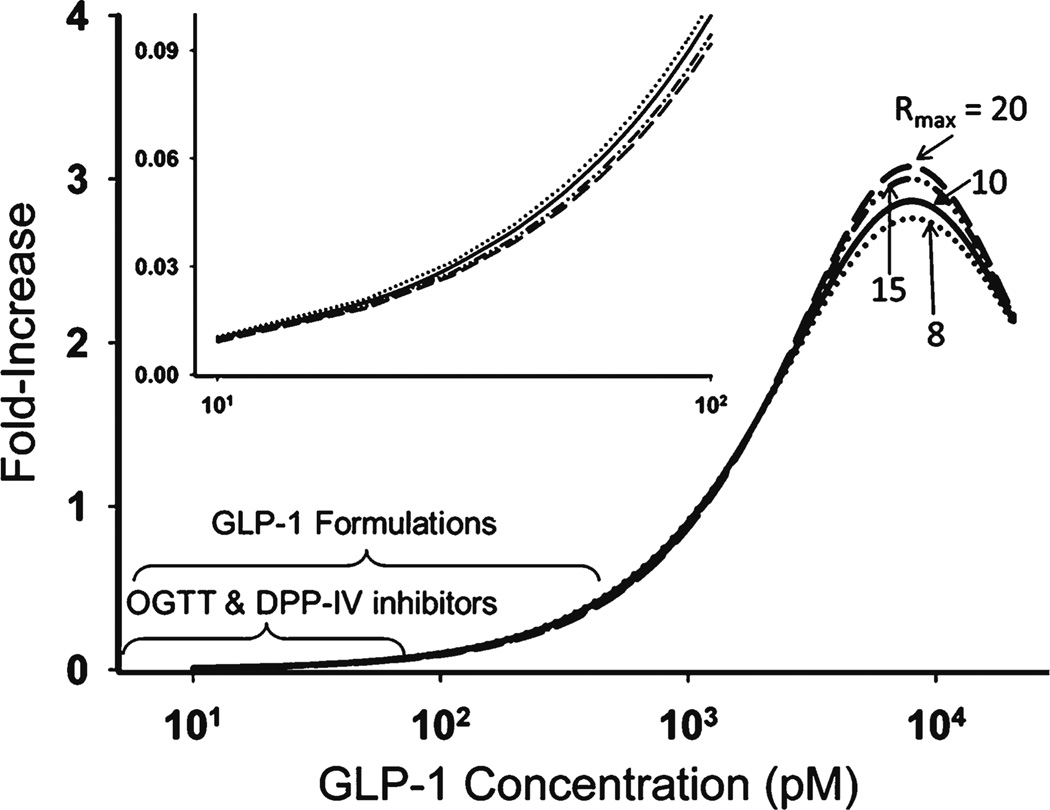
The GLP-1concentration-response curve was simulated and analyzed (Fig. 8). The maximum activation was about 3-fold, along with dissociation constant KD for the first binding site 9.94×10³ pmol/L and association constant for the second binding site K2 = 1.56×1022124 L/pmol. Considering the present high concentration GLP-1, native GLP-1 seemed to show low affinity for both binding sites. The sensitivity analysis indicated that the Rmax between 8 and 20 yielded similar log-likelihood (difference of <1.5). Owing to insensitivity in this range, Rmax did not obviously bias the concentration-response curve, especially at low concentrations (Fig. 8). Therefore, we fixed Rmax to 10 in the final model fitting.
Fig. 8.
Simulated concentration-response profile of blood GLP-1 and insulin secretion activation. Sensitivity analysis was conducted by changing Rmax in the range of 8–20.
DISCUSSION
A two-compartment linear model was used to describe GLP-1 kinetics, the same as employed for inhaled GLP-1 in humans (18). Generally, in regard of bi-exponential kinetics, drug elimination usually reflects the terminal phase (β phase) while distribution contributes more to the initial decline phase (α phase). According to our results, GLP-1 is exceptional because its elimination rate (CL/Vp) is much higher than distribution rate (CLd/Vp) (55.7 vs 1.15 h−1). The elimination rate thus corresponds to the α phase whereas CLd/Vp largely contributes to the β phase. Simulation of GLP-1 kinetics after IV dosing indicated that the amount of GLP-1 in the peripheral compartment dominates the terminal phase and serves as a pool supplying GLP-1 back into blood shortly after dosing. Previous literature also implies that in some tissues DPP-4 enzyme activity was low or ignorable (19) and GLP-1 might temporarily ‘hide’ in these slowly-distributed tissues without rapid degradation by the enzyme in blood.
In this study, the clearance of GLP-1 was higher than cardiac output (about 10.2 L/h/kg), suggesting that GLP-1, to large extent, was degraded intravascularly, in line with previous observations in pigs and humans (20,21).
For SC or IP dosing, the GLP-1 profile could be captured by a dual absorption kinetic model with a rapid zero-order input of a fraction of the dose followed by a slow first-order input of the remainder. First-order absorption accounted for the major fraction of the dose (69.8% for SC and 73.3% for IP). Rapid zero-order absorption was required to describe the fast rise of blood concentrations and the decline phase was captured by relatively slow first-order absorption because of flip-flop kinetics. The zero-order and first-order mixed model has been commonly applied in describing absorption processes of other macromolecules (22). The physiological relevance of this absorption pattern has not been clarified. Some papers inferred the rapid zero-order input might reflect direct entry into blood vessels from injection sites. The major fraction of the dose was assumed to undergo a slow process of first-order absorption from lymph to blood. For exenatide, relatively slow absorption of SC doses could obviously extend the terminal half-life because of flip-flop kinetics (23). However, for GLP-1, due to relatively rapid absorption, SC injection did not obviously extend the terminal half-life in spite of flip-flop kinetics.
For the dynamics, we treated the basal glucose and insulin as the average values of the initial three points, assuming GLP-1 did not show effects on insulin secretion at normal glucose concentrations, consistent with previous observations (24). Biphasic insulin secretion was reported by Chen et al. (25), but this was less pronounced in our study and only one phase was considered. After glucose dosing, GLP-1 exerted insulinotropic effects in a bell-shaped dose-dependent manner. The maximal effect was approximately 3-fold higher than control. The bell-shaped concentration-response relationship of GLP-1 was also manifested in an isolated islet assay (5) and in diabetic humans (26). Actually, not only GLP-1, but most GLP-1 receptor agonists such as exendin-4, showed similar bell-shaped relationships in vitro (15) and in vivo (5). The Adair model could describe GLP-1 dynamics reasonably well, but the performance of the model for other analogues needs further evaluation. The bell-shaped curve for effects of GLP-1 agonists implies that careful dose optimization is necessary.
GLP-1, along with GLP-1 receptor agonists, are key entities for incretin-based agents which have been widely examined (1,2). The receptor binding affinity reflects a major point of distinction among GLP-1 receptor agonists. Compared with native GLP-1, several agonists such as exenatide, not only show resistance to DPP-4, but also show higher receptor binding affinity and activation capacity for insulin release (5,15). The higher affinity and capacity make their concentration-response curves behave differently (5). Like GLP-1, characterizing their concentration-response behavior would allow optimal selection of doses.
The basis of the bell-shaped relationship has not been elucidated but several lines of evidence may give us some clues. The GLP-1 receptor belongs to the glucagon-secretin B family of the G protein-coupled receptors (GPCR) and activation of GLP-1 receptor stimulates the adenylyl cyclase pathway which results in increased insulin synthesis and release of insulin (15, 26). There is evidence that the binding affinity with GPCR could be modulated by modulating allosteric sites, both positively and negatively (26). Even for one specific agonist, it could modulate its affinity by binding to these allosteric sites (27). The characteristics ofGLP-1 receptor encouraged us to hypothesize that higher concentrations of GLP-1 negatively modulates its activation affinity by binding allosteric sites. The inhibition, or apparently antagonistic effect, was unspecific as shown by using forskolin stimulation on the cloned human glucagon receptor in in vitro studies (15). The activating binding site and allosteric modulating site for the GLP-1 receptor inspired us to propose the two binding site Adair model in capturing the bell-shaped curve. The binding affinities for both sites were extremely low (Table II). In spite of the high capacity, a supraphysiological GLP-1 concentration only elicited 3-fold insulin increments (Fig. 8). However, the good performance of the Adair model does not exclude other possibilities.Other factors, such as GLP-1 extrapancreatic effects and antagonistic metabolite GLP-1-(9–36), may also be involved. Particularly, in light of recent data, paracrine activation of the enteric nervous system by GLP-1 acting on the brain relay can be considered the main physiological function of the peptide in the regulation of pancreatic secretions and overall glucose metabolism (29,30). Further investigation is required to explore these possible mechanisms of the bell-shaped concentrationresponse relationship.
In the present study, the wide range of doses supported our simulating the entire concentration-response curve (Fig. 8). However, according to the simulations, physiological concentrations of GLP-1 (<50 pM) only generate 0.05-fold activation of insulin release (31). Even in human oral glucose tolerance studies (OGTT) (32), the blood GLP-1concentration is no more than 100 pM, corresponding to 0.1-fold activation (putting aside the species difference). Actually, due to GLP-1 potentiation, insulin secretion was much higher in an OGTT study than that in an intravenous glucose tolerance study with comparable blood glucose concentrations (33,34). One view is that systemic concentrations of GLP-1 are not thought to be directly relevant to its insulinotropic action (30,35). In our model, blood GLP-1 was treated as driving such effects and no biophase was considered. The separation of blood GLP-1 and an effect site could help. GLP-1 needs access to the pancreas to elicit insulinotropic effects by activating GLP-1 receptors in beta cells. Endogenously secreted GLP-1 in response to oral glucose or a meal, compared to exogenously dosing GLP-1, should allow ‘first-pass’ type of access, which is consistent with previous observations (30,36). From this perspective, oral dosing of GLP-1 that mimics physiological secretion might improve hypoglycemic therapy (37). The GLP-1 concentrations in pancreas should be more relevant than systemic GLP-1 concentrations. For DPP-4 inhibitors or exogenously dosing GLP-1, pancreas GLP-1, rather than blood, might better reflect their effects (38,39). The recent view that GLP-1 shows insulinotropic effects via activation of the enteric nervous system further suggests that GLP-1 concentrations in intestine are also relevant (29,30). However, GLP-1 is easier to measure in blood than in pancreas or intestine, particularly in clinical settings. Elucidating the connection between blood GLP-1 and active site concentrations using physiologically-based models may offer an improved perspective.
CONCLUSIONS
GLP-1 exhibited biexponential and linear kinetics and a dose-dependent insulinotropic effect. The two binding site Adair model was used to describe the bell-shaped concentration-response behavior. Quantitatively analyzing GLP-1 PK/PD offers insights into the incretin/glucose/insulin system and has implications for incretin-based therapy.
Acknowledgments
ACKNOWLEDGMENTS & DISCLOSURES
This work was supported by NIH Grant GM 57980. Data were provided by Amylin Pharmaceuticals, Inc. The authors are grateful to Brenda Cirincione for reviewing the manuscript.
REFERENCES
- 1.Cefalu WT. The physiologic role of incretin hormones: clinical applications. J Am Osteopath Assoc. 2010;110(3 Suppl 2):S8–S14. [PubMed] [Google Scholar]
- 2.Drab SR. Incretin-based therapies for type 2 diabetes mellitus: current status and future prospects. Pharmacotherapy. 2010;30(6):609–624. doi: 10.1592/phco.30.6.609. [DOI] [PubMed] [Google Scholar]
- 3.Siddiqui NI. Incretin mimetics and DPP-4 inhibitors: new approach to treatment of type 2 diabetes mellitus. Mymensingh Med J. 2009;18(1):113–124. [PubMed] [Google Scholar]
- 4.Torekov SS, Kipnes MS, Harley RE, Holst JJ, Ehlers MR. Dose response of subcutaneous GLP-1 infusion in patients with type 2 diabetes. Diabetes Obes Metab. 2011 doi: 10.1111/j.1463-1326.2011.01388.x. [DOI] [PubMed] [Google Scholar]
- 5.Parkes DG, Pittner R, Jodka C, Smith P, Young A. Insulinotropic actions of exendin-4 and glucagon-like peptide-1in vivoand in vitro. Metabolism. 2001;50(5):583–589. doi: 10.1053/meta.2001.22519. [DOI] [PubMed] [Google Scholar]
- 6.Parkes DG, Jodka C, Smith P, Nayak S, Rinehart L, Gingerich R, et al. Pharmacokinetic actions of exendin-4 in the rat: Comparison with glucagon-like peptide-1. Drug Develop Res. 2001;53(4):260–267. [Google Scholar]
- 7.Jusko WJ, Ko HC. Physiologic indirect response models characterize diverse types of pharmacodynamic effects. Clin Pharmacol Ther. 1994;56(4):406–419. doi: 10.1038/clpt.1994.155. [DOI] [PubMed] [Google Scholar]
- 8.Lima JJ, Matsushima N, Kissoon N, Wang J, Sylvester JE, Jusko WJ. Modeling the metabolic effects of terbutaline in beta2-adrenergic receptor diplotypes. Clin Pharmacol Ther. 2004;76(1):27–37. doi: 10.1016/j.clpt.2004.03.006. [DOI] [PubMed] [Google Scholar]
- 9.Adair GS. The hemoglobin system. VI. The oxygen dissociation curve of hemoglobin. J Biol Chem. 1925;63:529–545. [Google Scholar]
- 10.D’Argenio DZ, Schumitzky A, Wang X. ADAPT 5 user’s guide: pharmacokinetic/pharmacodynamic systems analysis software. Los Angeles: Biomedical Simulations Resource; 2009. [Google Scholar]
- 11.Meier JJ, Nauck MA, Kranz D, Holst JJ, Deacon CF, Gaeckler D, et al. Secretion, degradation, and elimination of glucagon-like peptide 1 and gastric inhibitory polypeptide in patients with chronic renal insufficiency and healthy control subjects. Diabetes. 2004;53(3):654–662. doi: 10.2337/diabetes.53.3.654. [DOI] [PubMed] [Google Scholar]
- 12.Raman M, Radziuk J, Hetenyi G., Jr Distribution and kinetics of glucose in rats analyzed by noncompartmental and compartmental analysis. Am J Physiol. 1990;259(2 Pt1):E292–E303. doi: 10.1152/ajpendo.1990.259.2.E292. [DOI] [PubMed] [Google Scholar]
- 13.Gopalakrishnan M, Suarez S, Hickey AJ, Gobburu JV. Population pharmacokinetic-pharmacodynamic modeling of subcutaneous and pulmonary insulin in rats. J Pharmacokinet Pharmacodyn. 2005;32(3–4):485–500. doi: 10.1007/s10928-005-0008-4. [DOI] [PubMed] [Google Scholar]
- 14.Buchanan TA, Sipos GF, Gadalah S, Yip KP, Marsh DJ, Hsueh W, et al. Glucose tolerance and insulin action in rats with renovascular hypertension. Hypertension. 1991;18(3):341–347. doi: 10.1161/01.hyp.18.3.341. [DOI] [PubMed] [Google Scholar]
- 15.Knudsen LB, Kiel D, Teng M, Behrens C, Bhumralkar D, Kodra JT, et al. Small-molecule agonists for the glucagon-like peptide 1 receptor. Proc Natl Acad Sci U S A. 2007;104(3):937–942. doi: 10.1073/pnas.0605701104. [DOI] [PMC free article] [PubMed] [Google Scholar]
- 16.Gao W, Jusko WJ. Pharmacokinetic and pharmacodynamic modeling of exendin-4 in type 2 diabetic Goto-Kakizaki rats. J Pharmacol Exp Ther. 2011;336(3):881–890. doi: 10.1124/jpet.110.175752. [DOI] [PMC free article] [PubMed] [Google Scholar]
- 17.Gries JM, Munafo A, Porchet HC, Verotta D. Down-regulation models and modeling of testosterone production induced by recombinant human choriogonadotropin. J Pharmacol Exp Ther. 1999;289(1):371–377. [PubMed] [Google Scholar]
- 18.Marino MT, Costello D, Baughman R, Boss A, Cassidy J, Damico C, et al. Pharmacokinetics and pharmacodynamics of inhaled GLP-1 (MKC253) proof-of-concept studies in healthy normal volunteers and in patients with type 2 diabetes. Clin Pharmacol Ther. 2010;88(2):243–250. doi: 10.1038/clpt.2010.85. [DOI] [PubMed] [Google Scholar]
- 19.Mentlein R, Dipeptidyl-peptidase IV. (CD26)-role in the inactivation of regulatory peptides. Regul Pept. 1999;85(1):9–24. doi: 10.1016/s0167-0115(99)00089-0. [DOI] [PubMed] [Google Scholar]
- 20.Deacon CF, Pridal L, Klarskov L, Olesen M, Holst JJ. Glucagon-like peptide 1 undergoes differential tissue-specific metabolism in the anesthetized pig. Am J Physiol. 1996;271(9):E458–E464. doi: 10.1152/ajpendo.1996.271.3.E458. [DOI] [PubMed] [Google Scholar]
- 21.Vilsboll T, Agerso H, Krarup T, Holst JJ. Similar elimination rates of glucagon-like peptide-1 in obese type 2 diabetic patients and healthy subjects. J Clin Endocrinol Metab. 2003;88(1):220–224. doi: 10.1210/jc.2002-021053. [DOI] [PubMed] [Google Scholar]
- 22.Woo S, Krzyzanski W, Jusko WJ. Pharmacokinetic and pharmacodynamic modeling of recombinant human erythropoietin after intravenous and subcutaneous administration in rats. J Pharmacol Exp Ther. 2006;319(3):1297–1306. doi: 10.1124/jpet.106.111377. [DOI] [PubMed] [Google Scholar]
- 23.Gedulin BR, Smith PA, Jodka CW, Chen K, Bhavsar S, Nielsen LL, et al. Pharmacokinetics and pharmacodynamics of exenatide following alternate routes of administration. Int J Pharm. 2008;356(1–2):231–238. doi: 10.1016/j.ijpharm.2008.01.015. [DOI] [PubMed] [Google Scholar]
- 24.Kreymann B, Williams G, Ghatei MA, Bloom SR. Glucagon-like peptide-1 7-36: a physiological incretin in man. Lancet. 1987;2(8571):1300–1304. doi: 10.1016/s0140-6736(87)91194-9. [DOI] [PubMed] [Google Scholar]
- 25.Chan HB, Jain R, Ahrén B, Pacini G, D'Argenio DZ. Am J Physiol Regul Integr Comp Physiol. 2011;300(5):R1126–R1133. doi: 10.1152/ajpregu.00687.2010. [DOI] [PMC free article] [PubMed] [Google Scholar]
- 26.Koole C, Wootten D, Simms J, Valant C, Sridhar R, Woodman L, et al. Allosteric ligands of the glucagon-like peptide 1 receptor (GLP-1R) differentially modulate endogenous and exogenous peptide responses in a pathway-selective manner: implications for drug screening. Mol Pharmacol. 2010;78(3):456–465. doi: 10.1124/mol.110.065664. [DOI] [PMC free article] [PubMed] [Google Scholar]
- 27.Mann R, Nasr N, Hadden D, Sinfield J, Abidi F, Al-Sabah S, et al. Peptide binding at the GLP-1 receptor. Biochem Soc T. 2007;35(Pt 4):713–716. doi: 10.1042/BST0350713. [DOI] [PubMed] [Google Scholar]
- 28.Knudsenand LB, Pridal L. Glucagon-like peptide-1-(9-36) amide is a major metabolite of glucagon-like peptide-1-(7-36) amide after in vivo administration to dogs, and it acts as an antagonist on the pancreatic receptor. Eur J Pharmacol. 1996;318(2–3):429–435. doi: 10.1016/s0014-2999(96)00795-9. [DOI] [PubMed] [Google Scholar]
- 29.Balkanand X, Li B. Portal GLP-1 administration in rats augments the insulin response to glucose via neuronal mechanisms. Am J Physiol-Reg I. 2000;279(4):R1449–R1454. doi: 10.1152/ajpregu.2000.279.4.R1449. [DOI] [PubMed] [Google Scholar]
- 30.Ionut V, Liberty IF, Hucking K, Lottati M, Stefanovski D, Zheng D, et al. Exogenously imposed postprandial-like rises in systemic glucose and GLP-1 do not produce an incretin effect, suggesting an indirect mechanism of GLP-1 action. Am J Physiol Endocrinol Metab. 2006;291(4):E779–E785. doi: 10.1152/ajpendo.00106.2005. [DOI] [PubMed] [Google Scholar]
- 31.Salehi M, Aulinger B, Prigeon RL, D’Alessio DA. Effect of endogenous GLP-1 on insulin secretion in type 2 diabetes. Diabetes. 2010;59(6):1330–1337. doi: 10.2337/db09-1253. [DOI] [PMC free article] [PubMed] [Google Scholar]
- 32.Velasquez-Mieyer PA, Cowan PA, Umpierrez GE, Lustig RH, Cashion AK, Burghen GA. Racial differences in glucagon-like peptide-1 (GLP-1) concentrations and insulin dynamics during oral glucose tolerance test in obese subjects. Int J Obes Relat Metab Disord. 2003;27(11):1359–1364. doi: 10.1038/sj.ijo.0802415. [DOI] [PMC free article] [PubMed] [Google Scholar]
- 33.Knop FK, Vilsboll T, Madsbad S, Holst JJ, Krarup T. Inappropriate suppression of glucagon during OGTT but not during isoglycaemic i.v. glucose infusion contributes to the reduced incretin effect in type 2 diabetes mellitus. Diabetologia. 2007;50(4):797–805. doi: 10.1007/s00125-006-0566-z. [DOI] [PubMed] [Google Scholar]
- 34.Muscelli E, Mari A, Casolaro A, Camastra S, Seghieri G, Gastaldelli A, et al. Separate impact of obesity and glucose tolerance on the incretin effect in normal subjects and type 2 diabetic patients. Diabetes. 2008;57(5):1340–1348. doi: 10.2337/db07-1315. [DOI] [PubMed] [Google Scholar]
- 35.Burcelinand S, Dejager R. GLP-1: what is known, new and controversial in 2010. Diabetes Metab. 2010;36(6 pt 1):503–509. doi: 10.1016/j.diabet.2010.09.002. [DOI] [PubMed] [Google Scholar]
- 36.D’Alessio D, Lu W, Sun W, Zheng S, Yang Q, Seeley R, et al. Fasting and postprandial concentrations of GLP-1 in intestinal lymph and portal plasma: evidence for selective release of GLP-1 in the lymph system. Am J Physiol Regul Integr Comp Physiol. 2007;293(6):R2163–R2169. doi: 10.1152/ajpregu.00911.2006. [DOI] [PubMed] [Google Scholar]
- 37.Beglinger C, Poller B, Arbit E, Ganzoni C, Gass S, Gomez-Orellana I, et al. Pharmacokinetics and pharmacodynamic effects of oral GLP-1 and PYY3-36: a proof-of-concept study in healthy subjects. Clin Pharmacol Ther. 2008;84(4):468–474. doi: 10.1038/clpt.2008.35. [DOI] [PubMed] [Google Scholar]
- 38.He YL, Serra D, Wang Y, Campestrini J, Riviere GJ, Deacon CF, et al. Pharmacokinetics and pharmacodynamics of vildagliptin in patients with type 2 diabetes mellitus. Clin Pharmacokinet. 2007;46(7):577–588. doi: 10.2165/00003088-200746070-00003. [DOI] [PubMed] [Google Scholar]
- 39.Nauck MA, Wollschlager D, Werner J, Holst JJ, Orskov C, Creutzfeldt W, et al. Effects of subcutaneous glucagon-like peptide1 (GLP-1 [7-36 amide]) in patients with NIDDM. Diabetologia. 1996;39(12):1546–1553. doi: 10.1007/s001250050613. [DOI] [PubMed] [Google Scholar]


