Abstract
Motivation:
Triple-negative breast cancer (TNBC) is a heterogeneous breast cancer group, and identification of molecular subtypes is essential for understanding the biological characteristics and clinical behaviors of TNBC as well as for developing personalized treatments. Based on 3,247 gene expression profiles from 21 breast cancer data sets, we discovered six TNBC subtypes from 587 TNBC samples with unique gene expression patterns and ontologies. Cell line models representing each of the TNBC subtypes also displayed different sensitivities to targeted therapeutic agents. Classification of TNBC into subtypes will advance further genomic research and clinical applications.
Result:
We developed a web-based subtyping tool TNBCtype for candidate TNBC samples using our gene expression meta data and classification methods. Given a gene expression data matrix, this tool will display for each candidate sample the predicted subtype, the corresponding correlation coefficient, and the permutation P-value. We offer a user-friendly web interface to predict the subtypes for new TNBC samples that may facilitate diagnostics, biomarker selection, drug discovery, and the more tailored treatment of breast cancer.
Keywords: triple-negative breast cancer, gene expression microarray, meta-analysis, classification, subtypes
Introduction
Triple-negative breast cancer (TNBC), characterized by a lack of estrogen receptor (ER), progesterone receptor (PR) and human epidermal growth factor receptor 2 (HER2) expression, has been a challenging breast cancer subtype for oncological therapy.1 TNBC accounts for 10%–20% of all breast cancer cases and is diagnosed more frequently in younger individuals, those with BRCA1 mutations, and African-American/Hispanic women.2 Chemotherapy is the only systematic treatment for TNBC, but TNBC patients with standard treatment have a higher rate of distant relapse and a poorer prognosis than patients with other breast cancer subtypes.3,4
There is significant overlap between TNBC and basal-like breast cancer, however, the evidence from immunohistochemical expression, molecular features, and prognosis suggests that these two breast cancer subtypes are not equivalent.5,6 Although TNBC has been considered to be a unique breast cancer sub-type, TNBCs display heterogeneous patterns in morphological, genetic, immunophenotypic and clinical features.7–9 The survival curve of TNBC patients supports this phenomenon, in which the risk of distant recurrence of TNBCs rises sharply during the first one to three years after diagnosis, but drops dramatically thereafter and shows a pattern similar to other non-TNBCs after five years.4 Thus, better understanding of the subtypes within TNBCs is necessary for developing personalized treatment for TNBC patients.
Genomic profiling can be a powerful tool to gain insight to complex diseases such as cancer. Using microarray gene expression data, Perou et al (2000) used intrinsic gene signatures to define five breast cancer subtypes.10 We recently collected 587 TNBC gene expression profiles from 3,247 breast cancer cases available in 21 publicly available data sets. Based on our gene expression meta dataset, six TNBC subtypes including two basal-like (BL1 and BL2) subtypes, an immunomodulatory (IM) subtype, a mesenchymal (M) subtype, a mesenchymal stem-like (MSL) subtype and a luminal androgen receptor (LAR) subtype, and the corresponding gene signatures were established.11
Based on these TNBC gene signatures, we were able to predict the subtypes of several breast cancer cell lines representing each of six TNBC subtypes. Cell lines modeling each of the subtypes differentially responded to chemotherapeutic and targeted agents. Cell lines from both the BL1 and BL2 subtypes were highly sensitive to cisplatin. M and MSL subtypes responded to NVP-BEZ235 (a PI3K/mTOR inhibitor) and dasatinib (an Abl/Sarc inhibitor). The LAR cell lines were sensitive to bicalutamide (an AR antagonist). Our analysis and experiments were one of the first systematic transcriptomic profiling studies to identify TNBC subtypes, and the results are promising in terms of TNBC biomarker and drug target discovery. Herein we describe our recently developed web-based subtyping tool for classifying TNBC samples from any high-throughput gene expression platform using subtype signatures based on our collected gene expression meta-data.
Methods and Implementation
To follow, we describe the analysis workflow and the data source we used for predicting breast cancer sub-types. In addition, we illustrate the web interface for data loading and results delivery.
Data collection and TNBC identification
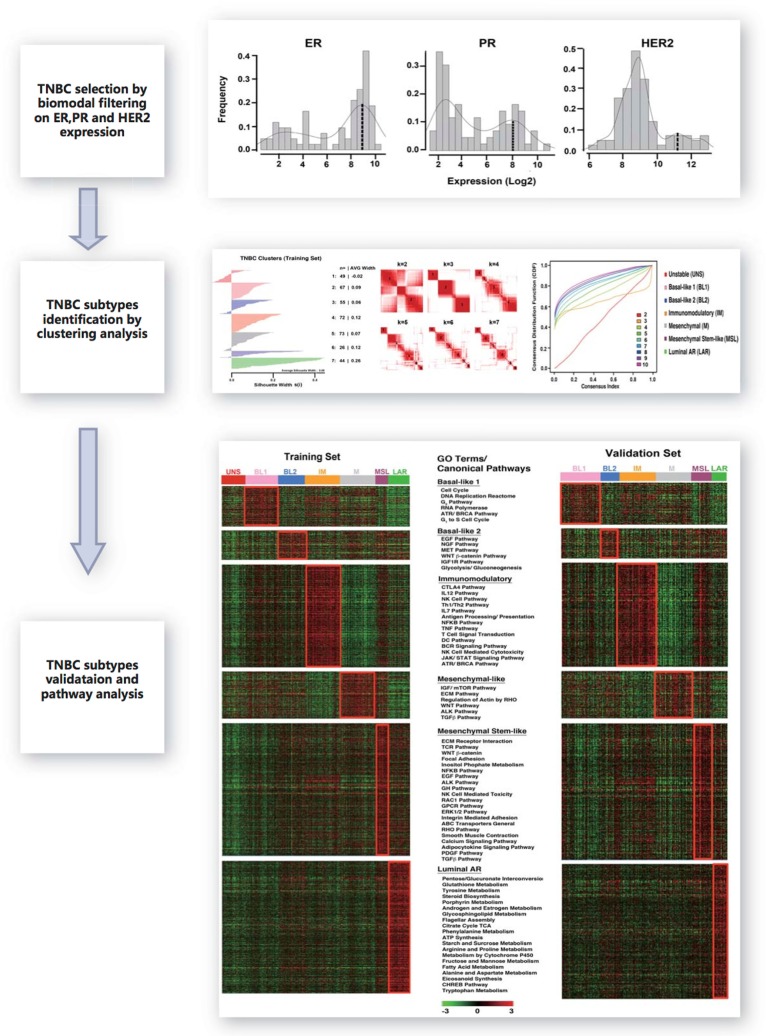
We collected 2,353 breast cancer gene expression profiles from 14 publicly available microarray data-sets for the identification of TNBCs and the discovery of subtypes. Another cohort of 894 breast cancer gene expression profiles from seven public data sets was used for the identification of TNBCs and subtype validation. All data sources are listed in Supplementary Table 1. The analysis workflow is displayed in Figure 1. All gene expression profiles were generated using Affymetrix platforms and RMA (Robust Multi-array Analysis) was used to normalize each independent dataset. The three Affymetrix probes 205225_at, 208305_at and 216836_s_at were selected to represent ER, PR and HER2 gene expressions respectively.12 In each dataset, the empirical distributions of ER, PR and HER2 were approximated using a two-components Gaussian mixture distribution where the parameters were estimated using the R optim function. Given the estimated distributions, the posterior probability of negative expression status of ER, PR and HER2 can be calculated; a posterior probability of 0.5 was chosen as the cutoff for a negative status. Principal component analysis was applied to remove outlier samples.13 Another five samples for each ER, PR and HER2 with positive status confirmed by IHC were treated as positive controls. Tumor samples having at least 10-fold reduction in expression were considered to have negative status. A total of 386 TNBC samples in the training set and 201 TNBC samples in the testing set passed the filtering criteria and were used for further analyses.
Figure 1.
Workflow for developing the TNBC subtype gene signature.
Notes: After breast cancer gene expression data collection, three major procedures were performed to develop TNBC gene signature. First, TNBC identification by bimodal filtering on ER, PR and HER2 expression. Second, clustering analysis to develop TNBC subtypes. Finally, validation for TNBC subtypes and gene signature.
Based on K-means clustering analysis, we defined the six subtypes as follows: basal-like 1 (BL1), basal-like 2 (BL2), immunomodulatory (IM), mesenchymal (M), mesenchymal stem-like (MSL), luminal androgen receptor (LAR) characterized by the canonical pathways and differentially expressed genes.11
TNBC subtype gene signature derivation
In this analysis, we selected for the genes that are relatively unique for each subtype. The 20% of genes with the highest and lowest expression levels in at least 50% of the samples in each of six subtypes were initially selected. The Kruskal-Wallis test was used to identify the genes showing significant difference in at least two subtypes for all selected genes. We chose Bonferroni adjusted P-value 0.05 as the threshold to declare significance. After the above two steps, we generated a gene signature for each TNBC subtype, consisting of 2,188 genes can be used for independent sample prediction.
TNBC subtype prediction
We computed six centroids for TNBC subtypes based on the six gene signatures and the training cohort with 386 samples. For candidate TNBC samples especially those based on Affymetrix platforms, we first applied quantile normalization. Next, each gene was standardized by subtracting its sample mean (calculated across all testing samples) and dividing by its sample standard deviation. Using Spearman correlation, individual candidate tumor or cell line samples were correlated with each of six centroids for subtypes. When determining statistical significance of the correlation coefficients, the number of genes within each of the six signatures (size effect) is different, therefore, to make the results comparable between the subtypes, we applied a permutation test to remove this size effect. Candidate samples were then assigned to the TNBC subtype with the highest correlation, and those that had low correlation (correlation coefficient < 0.1 or P-value > 0.05) or are similar between subtypes (difference of two largest correlation coefficients < 0.05) would be considered unclassified.
Impact of ER positive samples for prediction and solution
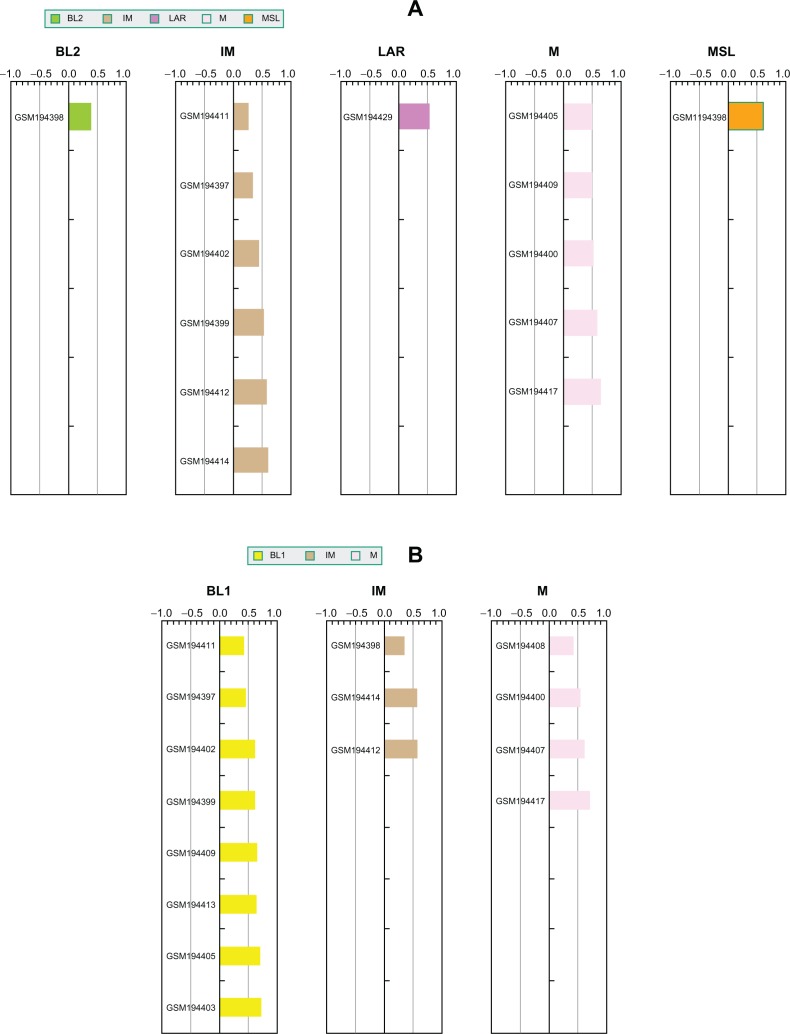
For probe-based gene expression platforms, we highly recommend pre-processing and normalization of the raw data for TNBC samples only. The distinctions between TNBC subtypes are relatively subtle compared to the dramatic difference between TNBC and ER-positive breast cancer samples at the transcriptome level. Thus, the presence of ER-positive samples with TNBC could affect TNBC gene expression normalization, and thus final prediction results. We performed a series of experiments to illustrate the impact of ER positive expression on subtype prediction. We chose a dataset (GSE7904) from our initial training cohort that contains 43 breast cancer microarray samples, in which 17 samples were identified as TNBC and matched reported IHC status. Thus, the subtype membership assignments for these 17 samples based on clustering analysis of 386 patients in the training cohort can be treated as a “gold standard”. First, we normalized the 17 TNBC samples alone and used TNBCtype to predict subtype memberships. As expected, the prediction results match the original subtype assignments (Fig. 2A). Second, we normalized all 43 samples (including the same 17 TNBC samples and other ER positive samples) and performed predictions (Fig. 2B). The differences between these two predictions were striking: nine samples were classified as basal-like 1 (BL1) subtype in the second prediction procedure. This result demonstrates how TNBC sample predictions can be skewed toward basal-like samples if the TNBC test cohort was contaminated by ER positive samples. This same analysis was also applied to another dataset (GSE12276) from our initial testing cohort, which included 49 TNBC samples. This comparison is shown in Supplementary Figure 1 and the results are similar to those for GSE7904. Thus identification and removal of ER-positive samples from candidate cohort are necessary steps to ensure the accuracy of TNBC subtype prediction.
Figure 2.
ER positive samples dramatically affect TNBC subtype prediction results. (A) Prediction results for TNBC samples normalized without any ER positive sample; (B) Prediction results for the same TNBC samples normalized in the presence of ER positive samples.
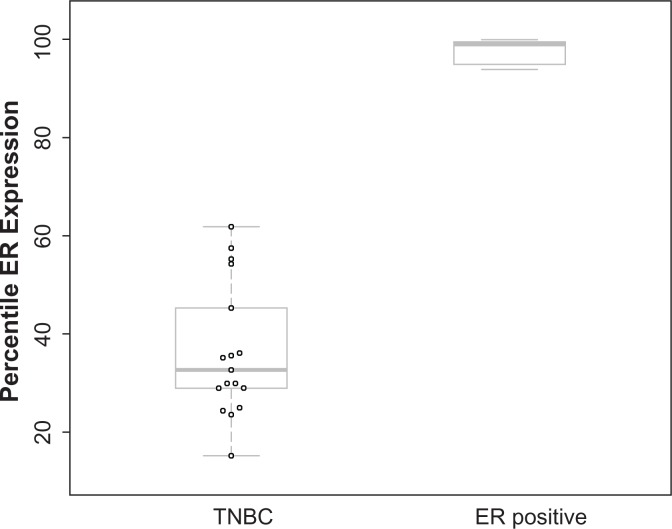
Given that the prediction results can be greatly impacted by ER-positive samples and that ER classification by IHC can miss 15.1%–21.8% of ER-driven cancers,14 we developed an ER-positive filter to remove potential false negative ER samples from a given test set. For the GES7904 dataset, we calculated the percentile of ER gene expression for each sample among all genes. This comparison indicates a dramatic difference of ER expression between TNBC samples (n = 17) and ER positive samples (n = 16) using percentile (Fig. 3). The above analysis suggests that filtering based on percentile of ER expression within each sample could be an effective approach to identify and remove ER-positive samples from unannotated data or samples that were falsely identified as negative by IHC. Therefore, we examined the distribution of percentiles of ER expression within our 386 TNBC training cohort and found ER expression in 96% of the samples was below 75 percentile of all genes (data not shown). Thus we have implemented a quality control step in TNBCtype program, to remove samples in which ER expression is greater than the 75 percentile at transcriptome level.
Figure 3.
ER gene expression for TNBC and ER positive samples.
Note: Boxplot shows the ER gene expression percentile among all genes within a given sample.
Website of TNBCtype
To accelerate genomic research of TNBC to the community, we designed a user-friendly interface for TNBC subtype prediction, available at http://cbc.mc.vanderbilt.edu/tnbc. Users can classify TNBC tumors or cell line samples by uploading a normalized (without standardization) gene expression data matrix and a valid email address. Input data matrix must consist of gene expression values in a .csv file with gene symbols as rows and sample IDs as columns. Once the uploaded data matrix passes a data format check, an automatic email will be sent to the user for confirmation. In the event that a sample does not pass the ER-filter, the user will be notified to remove the possible ER-positive sample and redo the normalization procedures. The user will then receive another email when the analysis is complete and the results are ready to be retrieved.
Result and Discussion
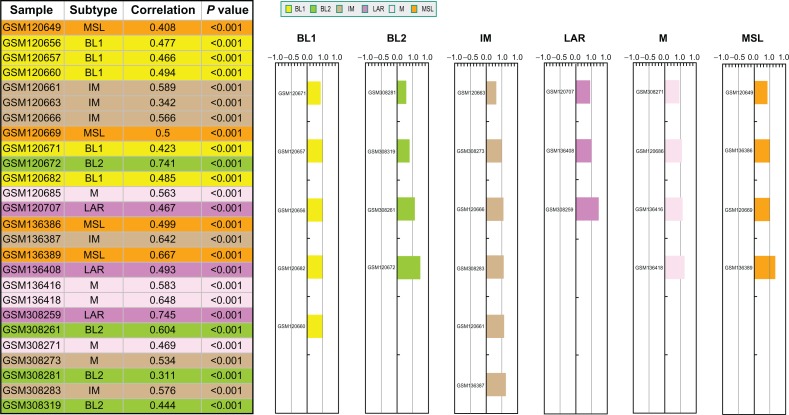
To demonstrate the functionality of the website, we have performed prediction on a test cohort with 26 publicly available TNBC samples and the results are displayed in Figure 4. Six colors were selected to represent each of the six TNBC subtypes. The table on the left shows the predicted subtype assigned to each sample, the correlation with the corresponding subtype centroid, and the P-value from 1,000 permutations. The color bars on the right show the same information as the table. The height of the bars indicates the magnitude of the correlation coefficients. Users can also download the files containing all the correlation and P-values for the six subtypes.
Figure 4.
Snapshot of TNBC prediction outcome.
Notes: For illustration, a cohort with 26 publicly available TNBC samples was tested by TNBC type. Six colors were selected to represent each of the six TNBC subtypes. The table on the left shows the predicted subtype assigned to each sample, the correlation with the corresponding subtype centroid, and the P-value from 1,000 permutations. The color bars on the right show the same information as the table. The height of the bars indicates the magnitude of the correlation coefficients.
One of the key implementations is permutation-based P-values output instead of the asymptotic P-values for the correlation coefficients that are used to select the best-fit subtype for candidate sample. Here, permutation tests were used to account for length differences among the six gene signatures. Our unpublished preliminary analysis results suggest that the current 2,188 combined gene signatures could be reduced to a new gene signature with several hundreds of genes using multivariate classification approaches, but the candidate samples should be compatible with our meta training data set in terms of Affymetrix platform and the scale of gene expression values. Although the current TNBC subtyping tool is relatively computationally intensive, it could be applicable to all high-throughput platforms including RNA-seq data. Another characteristic of this sub-typing tool is that very stringent criteria were used to make the final prediction decision and to classify samples, but the users can also make their own judgment from correlation coefficients and P-values.
Conclusions
Our gene expression meta analysis of TNBC with large sample size demonstrates not only the heterogeneity of TNBC but that genomic data can be used for the guidance of possible treatments and the identification of patients for the design of clinical trials for TNBCs.11 We developed the web-based TNBC subtyping tool for the research community. This software can be used by researchers to classify TNBC tumors into subtypes and provides the means to retrospectively analyze patient response to therapy. These retrospective studies will be critical to the design of future clinical trials that may eventually lead to biomarker discovery for patient selection. To ensure accurate subtype prediction, we implemented and ER-positive filter using percentile to remove all ER-positive samples, which can influence normalization and prediction results. In the future, integrated genomic analysis including DNA copy number, somatic mutation, epigenetic, and microRNA data will further improve our gene expression-based tool and help find the key “driver” components in each subtype for the potential of novel drug discovery and for more personalized treatment options for TNBC patients.
Availability and Requirements
Project name: TNBCtype
Project home page: http://cbc.mc.vanderbilt.edu/tnbc.
Programming languages: R, php.
Footnotes
Author Contributions
XC, JL, WHG, BDL designed and implemented the tool. XC, JL, WHG, BDL, JAB, YS, JAP read, wrote and approved the final manuscript.
Competing Interests
The authors declare that they have no competing interests.
Funding
This research was supported by NIH grants as follows: CA068485 (to XC); CA95131 (Specialized Program of Research Excellence in Breast Cancer); CA148375; CA105436 and CA070856 (to JAP); CA009385 (to JAB); American Cancer Society Grant #PF-10-226-01-TBG (to BDL); and Komen Foundation grant SAC110030 (to JAP).
Disclosures and Ethics
As a requirement of publication author(s) have provided to the publisher signed confirmation of compliance with legal and ethical obligations including but not limited to the following: authorship and contributorship, conflicts of interest, privacy and confidentiality and (where applicable) protection of human and animal research subjects. The authors have read and confirmed their agreement with the ICMJE authorship and conflict of interest criteria. The authors have also confirmed that this article is unique and not under consideration or published in any other publication, and that they have permission from rights holders to reproduce any copyrighted material. Any disclosures are made in this section. The external blind peer reviewers report no conflicts of interest.
Supplementary Data
ER positive samples dramatically affect TNBC subtype prediction results (A) Prediction results for TNBC samples normalized without any ER positive sample; (B) Prediction results for the same TNBC samples normalized in the presence of ER positive samples.
Table S1.
The list of public gene expression data used to develop TNBC gene signature.
| Data set | Source | Country | No. of samples | Purpose |
|---|---|---|---|---|
| GSE5327 | GEO | Sweden | 251 | Training set |
| GSE7904 | GEO | USA | 43 | Training set |
| GSE2109 | GEO | USA | 351 | Training set |
| GSE7390 | GEO | Europe | 198 | Training set |
| ETABM158 | Array express | USA | 100 | Training set |
| GSE2034 | GEO | Netherlands | 286 | Training set |
| GSE2990 | GEO | Sweden | 189 | Training set |
| GSE1456 | GEO | Sweden | 159 | Training set |
| GSE22513, GSE28821, GSE28796 | GEO | USA | 112 | Training set |
| GSE11121 | GEO | Germany | 200 | Training set |
| GSE2603 | GEO | USA | 99 | Training set |
| MDA133 | MD Anderson Cancer Center | USA | 133 | Training set |
| GSE5364 | GEO | Singapore | 183 | Training set |
| GSE1561 | GEO | Belgium | 49 | Training set |
| GSE5327 | GEO | Netherlands | 58 | Validation set |
| GSE5847 | GEO | USA | 96 | Validation set |
| GSE12276 | GEO | Netherlands | 204 | Validation set |
| GSE16446 | GEO | Europe | 120 | Validation set |
| GSE18864 | GEO | USA | 24 | Validation set |
| GSE19615 | GEO | USA | 115 | Validation set |
| GSE20194 | GEO | USA | 278 | Validation set |
References
- 1.Brenton JD, Carey LA, Ahmed AA, Caldas C. Molecular classification and molecular forecasting of breast cancer: Ready for clinical application? J Clin Oncol. 2005 Oct 10;23(29):7350–60. doi: 10.1200/JCO.2005.03.3845. [DOI] [PubMed] [Google Scholar]
- 2.Morris GJ, Naidu S, Topham AK, et al. Differences in breast carcinoma characteristics in newly diagnosed African-American and Caucasian patients—A single-institution compilation compared with the National Cancer Institute’s Surveillance, Epidemiology, and End Results Database. Cancer. 2007 Aug 15;110(4):876–84. doi: 10.1002/cncr.22836. [DOI] [PubMed] [Google Scholar]
- 3.Haffty BG, Yang Q, Reiss M, et al. Locoregional relapse and distant metastasis in conservatively managed triple negative early-stage breast cancer. Journal of Clinical Oncology: Official Journal of the American Society of Clinical Oncology. 2006 Dec 20;24(36):5652–7. doi: 10.1200/JCO.2006.06.5664. [DOI] [PubMed] [Google Scholar]
- 4.Dent R, Trudeau M, Pritchard KI, et al. Triple-negative breast cancer: clinical features and patterns of recurrence. Clin Cancer Res. 2007 Aug 1;13(15 Pt 1):4429–34. doi: 10.1158/1078-0432.CCR-06-3045. [DOI] [PubMed] [Google Scholar]
- 5.Foulkes WD, Smith IE, Reis JS. Triple-Negative Breast Cancer. New Engl J Med. 2010 Nov 11;363(20):1938–48. doi: 10.1056/NEJMra1001389. [DOI] [PubMed] [Google Scholar]
- 6.Weigelt B, Baehner FL, Reis JS. The contribution of gene expression profiling to breast cancer classification, prognostication and prediction: a retrospective of the last decade. J Pathol. 2010 Jan;220(2):263–80. doi: 10.1002/path.2648. [DOI] [PubMed] [Google Scholar]
- 7.Stockmans G, Deraedt K, Wildiers H, Moerman P, Paridaens R. Triple-negative breast cancer. Curr Opin Oncol. 2008 Nov;20(6):614–20. doi: 10.1097/CCO.0b013e328312efba. [DOI] [PubMed] [Google Scholar]
- 8.Reis-Filho JS, Tutt AN. Triple negative tumours: a critical review. Histopathology. 2008 Jan;52(1):108–18. doi: 10.1111/j.1365-2559.2007.02889.x. [DOI] [PubMed] [Google Scholar]
- 9.Rakha EA, Reis-Filho JS, Ellis IO. Basal-like breast cancer: a critical review. Journal of Clinical Oncology: Official Journal of the American Society of Clinical Oncology. 2008 May 20;26(15):2568–81. doi: 10.1200/JCO.2007.13.1748. [DOI] [PubMed] [Google Scholar]
- 10.Perou CM, Sorlie T, Eisen MB, et al. Molecular portraits of human breast tumours. Nature. 2000 Aug 17;406(6797):747–52. doi: 10.1038/35021093. [DOI] [PubMed] [Google Scholar]
- 11.Lehmann BD, Bauer JA, Chen X, et al. Identification of human triple-negative breast cancer subtypes and preclinical models for selection of targeted therapies. J Clin Invest. 2011 Jul 1;121(7):2750–67. doi: 10.1172/JCI45014. [DOI] [PMC free article] [PubMed] [Google Scholar]
- 12.Karn T, Metzler D, Ruckhaberle E, et al. Data-driven derivation of cutoffs from a pool of 3,030 Affymetrix arrays to stratify distinct clinical types of breast cancer. Breast Cancer Res Treat. 2010 Apr;120(3):567–79. doi: 10.1007/s10549-009-0416-z. [DOI] [PubMed] [Google Scholar]
- 13.Model F, Konig T, Piepenbrock C, Adorjan P. Statistical process control for large scale microarray experiments. Bioinformatics. 2002;18(Suppl 1):S155–63. doi: 10.1093/bioinformatics/18.suppl_1.s155. [DOI] [PubMed] [Google Scholar]
- 14.Li Q, Eklund AC, Juul N, et al. Minimising immunohistochemical false negative ER classification using a complementary 23 gene expression signature of ER status. PLoS One. 2010;5(12):e15031. doi: 10.1371/journal.pone.0015031. [DOI] [PMC free article] [PubMed] [Google Scholar]
Associated Data
This section collects any data citations, data availability statements, or supplementary materials included in this article.
Supplementary Materials
ER positive samples dramatically affect TNBC subtype prediction results (A) Prediction results for TNBC samples normalized without any ER positive sample; (B) Prediction results for the same TNBC samples normalized in the presence of ER positive samples.
Table S1.
The list of public gene expression data used to develop TNBC gene signature.
| Data set | Source | Country | No. of samples | Purpose |
|---|---|---|---|---|
| GSE5327 | GEO | Sweden | 251 | Training set |
| GSE7904 | GEO | USA | 43 | Training set |
| GSE2109 | GEO | USA | 351 | Training set |
| GSE7390 | GEO | Europe | 198 | Training set |
| ETABM158 | Array express | USA | 100 | Training set |
| GSE2034 | GEO | Netherlands | 286 | Training set |
| GSE2990 | GEO | Sweden | 189 | Training set |
| GSE1456 | GEO | Sweden | 159 | Training set |
| GSE22513, GSE28821, GSE28796 | GEO | USA | 112 | Training set |
| GSE11121 | GEO | Germany | 200 | Training set |
| GSE2603 | GEO | USA | 99 | Training set |
| MDA133 | MD Anderson Cancer Center | USA | 133 | Training set |
| GSE5364 | GEO | Singapore | 183 | Training set |
| GSE1561 | GEO | Belgium | 49 | Training set |
| GSE5327 | GEO | Netherlands | 58 | Validation set |
| GSE5847 | GEO | USA | 96 | Validation set |
| GSE12276 | GEO | Netherlands | 204 | Validation set |
| GSE16446 | GEO | Europe | 120 | Validation set |
| GSE18864 | GEO | USA | 24 | Validation set |
| GSE19615 | GEO | USA | 115 | Validation set |
| GSE20194 | GEO | USA | 278 | Validation set |


