Abstract
Aims/hypothesis
There is convincing evidence that endoplasmic reticulum (ER) stress is implicated in the pathogenesis of diabetes and its complications; however, the mechanisms are not fully understood. This study aimed to dissect the role and signalling pathways of activating transcription factor 4 (ATF4) in ER-stress-associated endothelial inflammation and diabetic retinopathy.
Methods
ER stress and ATF4 activity were manipulated by complementary pharmacological and genetic approaches in cultured retinal endothelial (TR-iBRB) cells. Diabetes was induced by streptozotocin in heterozygous Atf4 knockout and wild-type mice. ER stress markers, inflammatory cytokines and adhesion molecules, activation of the signal transducer and activator of transcription 3 (STAT3) pathway, and retinal vascular permeability were measured.
Results
High-glucose treatment resulted in rapid induction of ER stress, activation of ATF4, and increased production of inflammatory factors in TR-iBRB cells. Suppressing ER stress or inhibiting ATF4 activity markedly attenuated high-glucose-induced production of intercellular adhesion molecule 1, TNF-α and vascular endothelial growth factor. Conversely, enhancing ER stress or overexpressing Atf4 was sufficient to induce endothelial inflammation, which was, at least in part, through activation of the STAT3 pathway. Furthermore, knockdown of the Stat3 gene or inhibiting STAT3 activity restored ER homeostasis in cells exposed to high glucose and prevented ATF4 activation, suggesting that STAT3 is required for high-glucose-induced ER stress. Finally, we showed that downregulation of Atf4 significantly ameliorated retinal inflammation, STAT3 activation and vascular leakage in a mouse model of type 1 diabetes.
Conclusions/interpretation
Taken together, our data reveal a pivotal role of ER stress and the ATF4/STAT3 pathway in retinal endothelial inflammation in diabetic retinopathy.
Keywords: Activating transcription factor 4, Diabetic retinopathy, Endoplasmic reticulum, Endothelial cells, Inflammation
Introduction
Endothelial cell (EC) injury is a central event in the development of diabetic complications [1]. Diabetic retinopathy is one of the most common microvascular complications and affects almost 100% of patients with type 1 diabetes and more than 60% of those with type 2 diabetes during the first two decades of diabetes [2]. In the USA, diabetic retinopathy is the most common cause of blindness in the working-age population, and approximately 12,000–24,000 diabetic patients lose their sight each year as a result of diabetic retinopathy [3]. An early hallmark pathological change in diabetic retinopathy is damage of endothelial tight junctions or impaired inner blood–retinal barrier (BRB) resulting in vascular leakage and retinal oedema [4]. With disease progression, ECs undergo apoptosis [5, 6], leading to capillary dropout, retinal ischaemia and consequent neovascularisation. Therefore elucidating the mechanisms of retinal EC injury is critical to our understanding of the pathogenesis of diabetic retinopathy and to the development of new treatments to prevent vision loss in diabetic patients.
Studies over the past few decades demonstrate that inflammation plays an important role in endothelial dysfunction during diabetes [7–9]. Retinal cells exposed to high glucose produce higher levels of adhesion molecules such as intercellular adhesion molecule 1 (ICAM-1) [10–12]. Increased levels of inflammatory cytokines such as vascular endothelial growth factor (VEGF) and TNF-α have also been observed in retinas from diabetic animal models and in the vitreous from patients with diabetic retinopathy [10–12]. Inhibition of TNF-α, VEGF or ICAM-1 significantly reduced retinal leukostasis and vascular leakage in animal models of diabetes and uveitis [8, 9, 13, 14]. Pharmaceutical inhibition of TNF-α also attenuated retinal cell apoptosis and reduced acellular capillary formation in diabetic rodent models [15]. These findings strongly suggest a causal role of inflammation in BRB breakdown and vascular damage in diabetic retinopathy.
Endoplasmic reticulum (ER) is the central organelle responsible for protein folding, maturation, quality control, and trafficking in a cell. We previously reported that ER stress was activated in the retina in animal models of diabetes and oxygen-induced retinopathy [16]. Moreover, inhibiting ER stress successfully prevented the increase in VEGF production in the diabetic retina [16]. These results indicate that ER stress contributes to retinal inflammation. However, it remains unclear whether ER stress is implicated in endothelial inflammation during diabetes, and, if it is, what is the mechanism and signalling pathways by which ER stress promotes inflammation in retinal ECs. In the present study, we tested the hypothesis that activating transcription factor 4 (ATF4), an ER stress-inducible transcription factor, is a key regulator of endothelial inflammation in diabetic retinopathy. Our results demonstrate that high glucose, through activation of signal transducer and activator of transcription 3 (STAT3), induces ER stress and activates ATF4 in retinal ECs, which in turn enhances STAT3 signalling resulting in increased production of inflammatory factors and retinal vascular leakage in diabetic retinopathy.
Methods
Materials
The materials used and their suppliers can be found in the electronic supplementary material (ESM).
Animals
Generation of germline Atf4 knockout (KO) mice has been described previously [17]. Care, use and treatment of all animals in this study were in strict agreement with the Statement for the Use of Animals in Ophthalmic and Vision Research from the Association for Research in Vision and Ophthalmology and with the guidelines set out by the University of Oklahoma. Male heterozygous Atf4 KO mice were used for induction of diabetes with five consecutive intraperitoneal injections of streptozotocin (STZ) (50 mg/kg) and their male littermates were used as controls. Blood glucose was monitored 1 week after the final injection, and the mice with blood glucose level above 16.65 mmol/l were deemed to be diabetic [16].
Cell culture
A conditionally immortalised rat retinal capillary EC line (TR-iBRB) was kindly provided by T. Terasaki (Tohoku University, Japan) [18]. Cells were grown at 33°C in 5 mmol/l glucose/DMEM supplied with 10% FBS and 1% antibiotic/antimycotic solution. When 70–80% confluence was reached, cells were transferred to 37°C to induce arrest of cell growth through the reduction of large T-antigen expression [18]. Confluent monolayer cells were quiescent in DMEM containing 0.5% BSA, 100 mg/ml streptomycin and 100 U/ml penicillin for 8 h, followed by the desired treatments.
Adenoviral infection of TR-iBRB cells
Adenoviral vectors expressing mouse wild-type (WT) Atf4 (Ad-ATF4WT) and dominant negative Atf4 (Ad-ATF4ΔRK) harbouring a mutation in its DNA-binding domain (292RYRQKKR298 to 292GYLEAAA298) were generated as described previously [19]. Adenovirus expressing green fluorescent protein (GFP) (Ad-GFP) was used as a control. Subconfluent TR-iBRB cells were infected by adenoviruses at a multiplicity of infection of 5. At 24 h after infection, cells were quiescent in DMEM/0.5% BSA for 8 h and subjected to further treatments.
RNA interference and cell transfection
Double-stranded small interfering RNA (siRNA) oligonucleotides against rat STAT3 were synthesised by Qiagen (Valencia, CA, USA) [20]. A non-silencing siRNA was used as a negative control [21]. Cells were seeded at a density of 60–70% confluencein six-well plates and grown overnight. Transfection was carried out using Lipofectamine 2000 (Invitrogen, Carlsbad, CA, USA) as described previously [21]. After transfection, cells were incubated in DMEM/10% FBS for 24 h before treatment with high glucose or ER stress inducers.
Quantification of BRB breakdown
Breakdown of the BRB in mice was quantified by the FITC–dextran method (see ESM Methods for the details).
Real-time RT-PCR
Total RNA from mouse retinas was extracted using the RNeasy Mini Kit (Qiagen). cDNA was synthesised using the iScript cDNA Synthesis Kit, and real-time RT-PCR was performed using SYBR Green PCR Master Mix (Bio-Rad Laboratories, Hercules, CA, USA) [21]. The sequences of primers used in real-time PCR are listed in ESM Table 1. Expression of target genes was normalised to RPL19 ribosomal RNA [22].
Immunocytochemistry
Cells were fixed with 10% formaldehyde and permeabilised with 0.5% Triton X-100. After blocking with 1% BSA, cells were incubated with mouse glucose-regulated protein 78 (GRP78) antibody (1:200 dilution), rabbit STAT3 antibody (1:200 dilution) or rabbit ATF4 antibody (1:150 dilution) overnight followed by secondary FITC-conjugated affinity-purified donkey anti-rabbit IgG or anti-mouse IgG (1:200 dilution) for 1 h. Negative controls with primary antibodies omitted were included. Nuclei were stained with DAPI. The slides were visualised and photographed under a fluorescent microscope (Olympus).
Immunofluorescence study in the retina
Frozen sections of the retina were prepared as described previously [11]. Retinal sections were immunostained using anti-VEGF (1:100 dilution), anti-albumin (1:100 dilution), anti-ATF4 (1:150 dilution) and anti-(phosphorylated STAT3) (1:150 dilution). Negative controls with primary antibodies omitted were included. After being washed, sections were incubated with Cy3-conjugated secondary antibody (Molecular Probes, Eugene, OR, USA) or biotinylated secondary antibody and FITC–avidin (Vector Laboratories, Burlingame, CA, USA). DAPI was used to label cell nuclei.
Western blot analysis
Retinal samples and cells were prepared as described previously [21]. Protein (25 μg) was subjected to SDS-PAGE and transferred to nitrocellular membranes. After blocking, the membranes were blotted overnight with primary antibodies: anti-ICAM-1 (1:500 dilution), anti-VEGF (1:500 dilution), anti-TNF-α (1:500 dilution), anti-(phosphorylated STAT3) (1:1000 dilution), anti-GRP78 (1:5000 dilution), anti-(phospho-PERK [RNA-dependent protein kinase-like ER kinase]) (1:1000 dilution), anti-(phospho-eIF2α [eukaryotic translation initiation factor-2α]) (1:1000 dilution), anti-CHOP (C/EBP homologous protein) (1:500 dilution), anti-ATF4 (1:500 dilution) and anti-β-actin (1:5000 dilution). After incubation with secondary antibodies (1:2000 dilution), the membranes were developed with enhanced chemiluminescence substrate using the Bio Imaging System (Syngene, Frederick, MD, USA). The bands were semi-quantified using densitometry.
Statistical analysis
Data are expressed as means±SD. Statistical analysis was performed using Student’s t test when comparing two groups, or ANOVA with Bonferroni’s post hoc test when comparing three or more groups. Statistical significance was accepted as p<0.05.
Results
High glucose upregulates production of inflammatory factor in retinal ECs
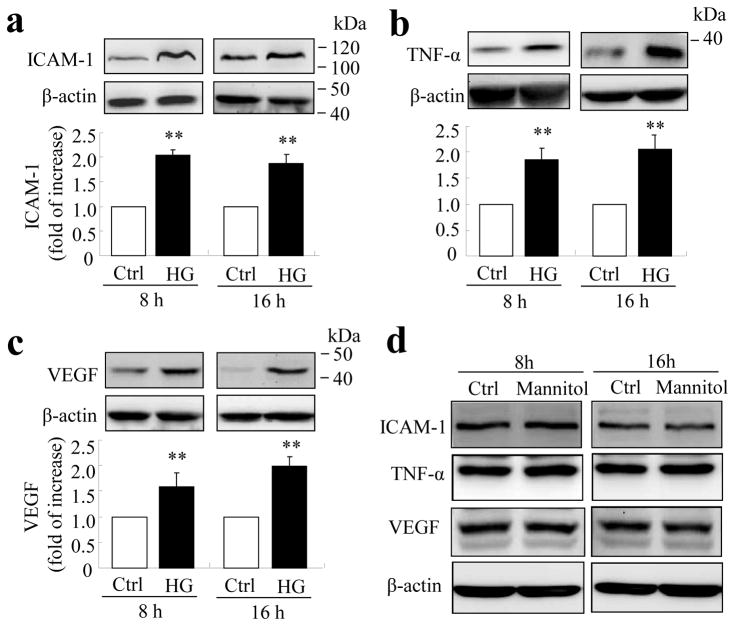
We previously reported that the content of inflammatory cytokines was significantly increased in the diabetic retina in several animal models, such as STZ-induced diabetic rats, db/db mice and Akita mice [10, 12, 16]. Of these factors, VEGF, TNF-α and ICAM-1 are believed to be the most important players in the pathogenesis of vascular injury and BRB breakdown. However, the direct effects of high glucose on inflammatory factor production in cultured retinal ECs have been controversial [23–25]. To determine if high glucose regulates inflammatory factor production in TR-iBRB cells, cells were exposed to high glucose (25 mmol/l) or mannitol as an osmotic control for 8 or 16 h. Production of VEGF, TNF-α and ICAM-1 was determined by western blot analysis. Results show that protein levels of ICAM-1, TNF-α and VEGF were increased 2.1-, 1.9- and 1.6-fold, respectively, after 8 h of high glucose treatment, and 1.7-, 2.1- and 2.0-fold, respectively, after 16 h of treatment (Fig. 1a–c). In contrast, incubation with the same concentration of mannitol did not alter the abundance of all three inflammatory factors (Fig. 1d). These results, consistent with the study of Perrone and associates [23], suggest that high glucose is a potent inducer of inflammatory response in TR-iBRB cells.
Fig. 1.
High glucose increases inflammatory factor production in TR-iBRB cells. TR-iBRB cells at 80% confluence were quiescent in serum-free DMEM for 6 h followed by treatment with high glucose (25 mmol/l, HG), normal glucose (5 mmol/l, Ctrl) or mannitol (25 mmol/l) for 8 or 16 h. Levels of ICAM-1 (a), TNF-α (b) and VEGF (c) were determined by western blot analysis and quantified by densitometry (mean±SD, n=3) **p<0.01 vs control. (d) Representative blots from three independent experiments showing no difference in production of inflammatory factors between TR-iBRB cells treated with 25 mmol/l mannitol and control for 8 h or 16 h
High glucose enhances ER stress in retinal ECs
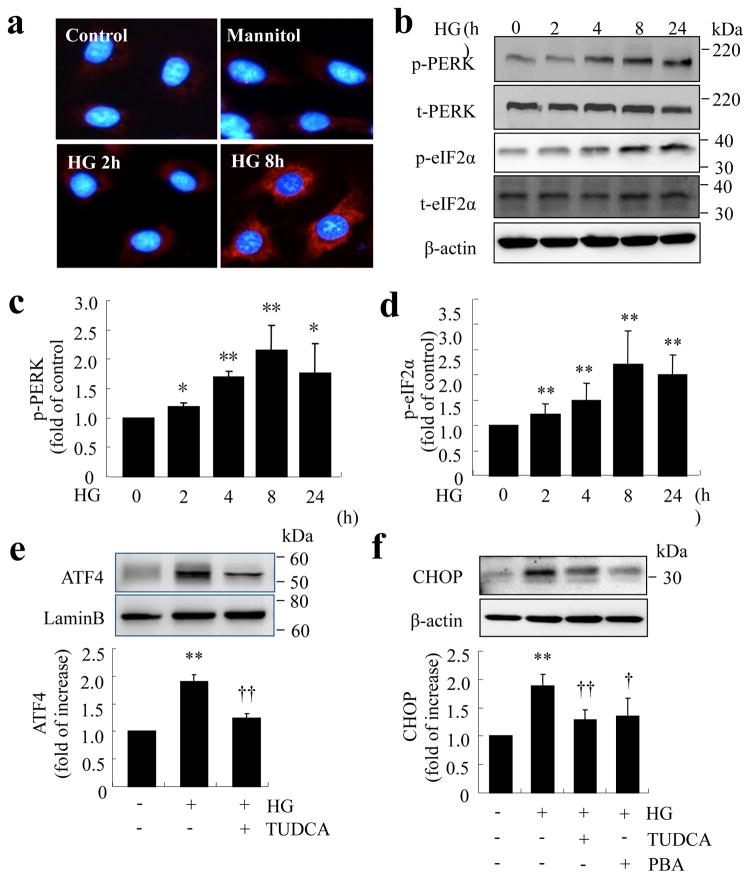
Our previous study shows that ER stress is elevated in the retina in diabetic mice [16]. However, it remains unclear whether ER stress can be induced by hyperglycaemia in vascular cells and whether it plays a role in endothelial inflammation and vascular damage during diabetes. Thus, we determined the kinetics of ER stress in TR-iBRB cells treated with high glucose. After exposure of cells to high glucose, the level of GRP78, a predominant ER chaperone upregulated by ER stress, was increased as early as 2 h, and peaked at 8 h. In contrast, the same concentration of mannitol did not alter GRP78 production (Fig. 2a). PERK, an ER membrane protein that senses ER stress, was activated in high-glucose-treated cells, which in turn phosphorylated eIF2α (Fig. 2b–d). Moreover, the level of ATF4, a downstream transcription factor of the PERK–eIF2α pathway, was significantly increased after high glucose treatment for 16 h. This was accompanied by enhanced production of CHOP, a major target protein of ATF4. Pretreatment of cells with tauroursodeoxycholic acid (TUDCA) or 4-phenyl butyrate (PBA), chemical chaperones that promote protein folding and thus alleviate ER stress, markedly reduced high-glucose-induced production of ATF4 and CHOP (Fig. 2e, f). These results suggest that high glucose is sufficient to induce ER stress, resulting in ATF4 activation in retinal ECs.
Fig. 2.
Increased levels of ER stress markers in TR-iBRB cells exposed to high glucose. (a–d) TR-iBRB cells were treated with high glucose (25 mmol/l, HG) for 0–24 h. ER stress markers were determined by immunocytochemistry or western blot analysis. (a) Immunohistochemistry showing increased GRP78 level after treatment with high glucose. (b–d) Western blot analysis of phosphorylated (p) and total (t) PERK and eIF2α. (b) Representative blots from three independent experiments. Production of p-PERK (c) and p-eIF2α (d) was quantified by densitometry (mean±SD, n=3). *p<0.05, **p<0.01 vs control. (e,f) TR-iBRB cells were treated with high glucose (25 mmol/l, HG) with or without chemical chaperone PBA (5 mmol/l) or TUDCA (5 mmol/l) for 16 h. Levels of ATF4 (e) and CHOP (f) were examined by western blot analysis in nuclear extracts or whole cell lysates and quantified by densitometry (mean±SD, n=3). **p<0.01 vs control, †p<0.05 vs HG, ††p<0.01 vs HG
ER stress induces production of inflammatory factors in retinal ECs
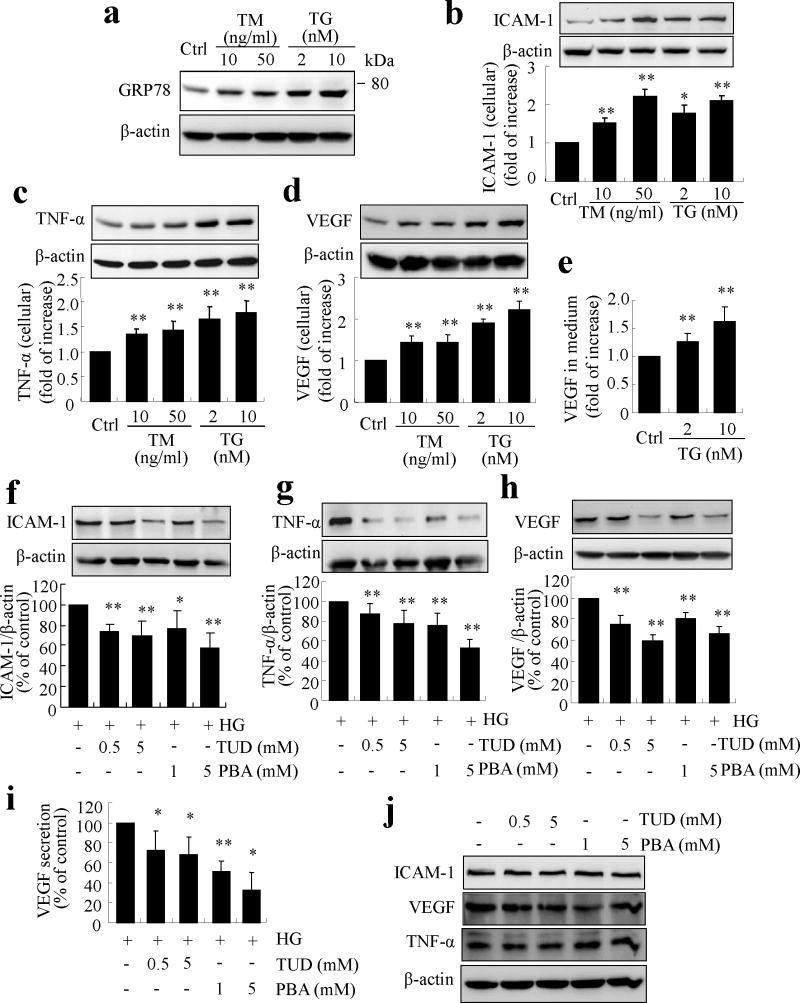
We next examined the effect of ER stress on endothelial inflammation using two common pharmacological inducers of ER stress, tunicamycin (TM) and thapsingargin (TG) [16, 21]. As shown in Fig. 3a, exposure of TR-iBRB cells to TM or TG resulted in a dose-dependent increase in GRP78 level, indicative of ER stress. In parallel, production of ICAM-1, TNF-α and VEGF was markedly increased in TM- and TG-treated cells (Fig. 3b–d). VEGF secretion into the medium was also significantly and dose-dependently increased after TG treatment. These results suggest that ER stress is a potent inducer of inflammation in retinal ECs.
Fig. 3.
ER stress upregulates inflammatory genes and mediates high-glucose-induced inflammation in TR-iBRB cells. (a–e) TR-iBRB cells were treated with TM or TG for 8h. (a) Level of GRP78 was determined by western blot analysis. (b–d) Production of ICAM-1 (b), TNF-α (c) and VEGF (d) was determined in whole cell lysate by western blot analysis and quantified by densitometry (mean±SD, n=3). (e) Protein level of VEGF secreted into the medium was determined by ELISA (mean±SD, n=5). *p<0.05, **p<0.01 vs control. (f–j) TR-iBRB cells were treated with high glucose with or without chemical chaperone PBA or TUDCA for 16 h. Production of ICAM-1 (f), TNF-α (g) and VEGF (h) was determined by western blot analysis and quantified by densitometry (mean±SD, n=3). (i) Protein level of VEGF in the medium was determined by ELISA (mean±SD, n=5). *p<0.05, **p<0.01 vs high glucose (HG). (j) Representative blots showing no difference in ICAM-1, TNF-α or VEGF levels in TR-iBRB cells treated with normal glucose with or without TUDCA or PBA for 16 h
ER stress is essential for high-glucose-induced inflammation in retinal ECs
To further determine if ER stress is implicated in high-glucose-induced inflammation, TR-iBRB cells were pretreated with TUDCA or PBA for 1 h, and then exposed to high glucose for 16 h. Results show that pretreatment with TUDCA or PBA significantly reduced high-glucose-induced production of ICAM-1, TNF-α and VEGF in TR-iBRB cells (Fig. 3f–h). VEGF secretion induced by high glucose was also dose-dependently decreased by TUDCA and PBA treatment (Fig. 3i). In contrast, TUDCA and PBA did not affect the content of ICAM-1, TNF-α and VEGF in control cells under normal glucose conditions (Fig. 3j). These results indicate that ER stress is required for high-glucose-induced inflammatory factor production in retinal ECs.
Activation of STAT3 by ER stress mediates high-glucose-induced inflammation in retinal ECs
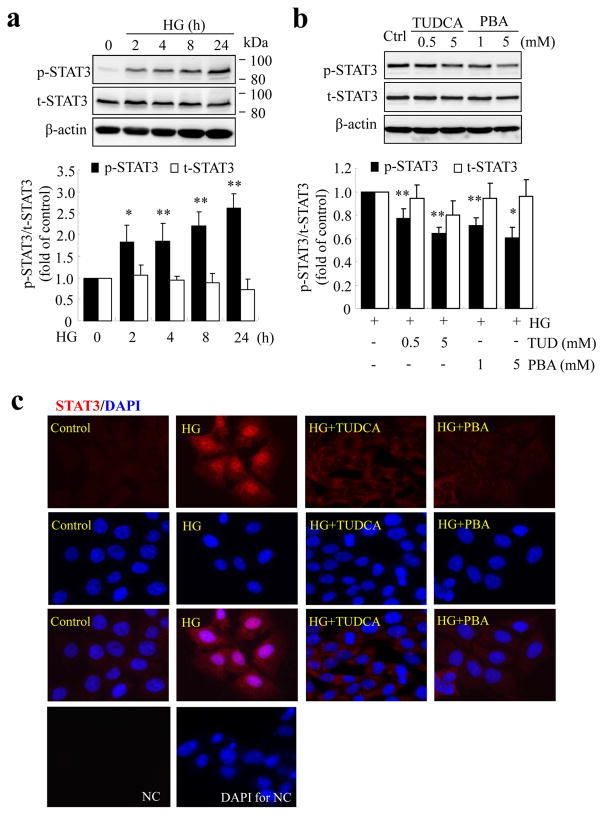
STAT3 is an important transcription factor in regulation of inflammatory response. Previously, we showed that activation of STAT3, but not HIF-1α, is essential for high-glucose-induced VEGF production in retinal ECs [11]. We asked whether STAT3 is implicated in high-glucose-induced ER stress and inflammation in ECs. We first characterised the activation of STAT3 by high glucose in TR-iBRB cells. We found that high glucose induced time-dependent phosphorylation of STAT3 at Tyr-705 from 2 to 24 h (Fig. 4a). Inhibiting ER stress with TUDCA or PBA dose-dependently reduced STAT3 activation in cells exposed to high glucose (Fig. 4b). As tyrosine phosphorylation of STAT3 is necessarily required for its dimerisation and translocation to the nucleus where STAT3 binds to its target genes, we further determined if inhibition of ER stress could block the nuclear translocation of STAT3. As shown in Fig. 4c, phosphorylated STAT3 was barely detectable in the cytoplasm of resting TR-iBRB cells. High-glucose treatment for 16 h resulted in increased phosphorylation of STAT3 and its translocation into the nucleus. The STAT3 translocation was abolished in cells treated with TUDCA or PBA. These results suggest that ER stress is involved in high-glucose-induced STAT3 activation.
Fig. 4.
ER stress is implicated in high glucose-induced STAT3 activation in TR-iBRB cells. (a) TR-iBRB cells were treated with high glucose (HG) for up to 24 h and the levels of phosphorylated STAT3 (p-STAT3) and total STAT3 protein (t-STAT3) were measured by western blot analysis and quantified by densitometry (mean±SD, n=3). (b) TR-iBRB cells were treated with high glucose with or without TUDCA or PBA for 16 h. Levels of p-STAT3 and t-STAT3 were determined by western blot analysis and quantified by densitometry (mean±SD, n=3). Black bars, p-STAT3; white bars, t-STAT3. *p<0.05, **p<0.01 vs HG. (c) Immunostaining of STAT3 showing nuclear translocation of STAT3 in HG-treated cells, but not in those treated with HG+TUDCA (5 mmol/l) or HG+PBA (5 mmol/l). STAT3 (red) and DAPI (blue). NC, negative control
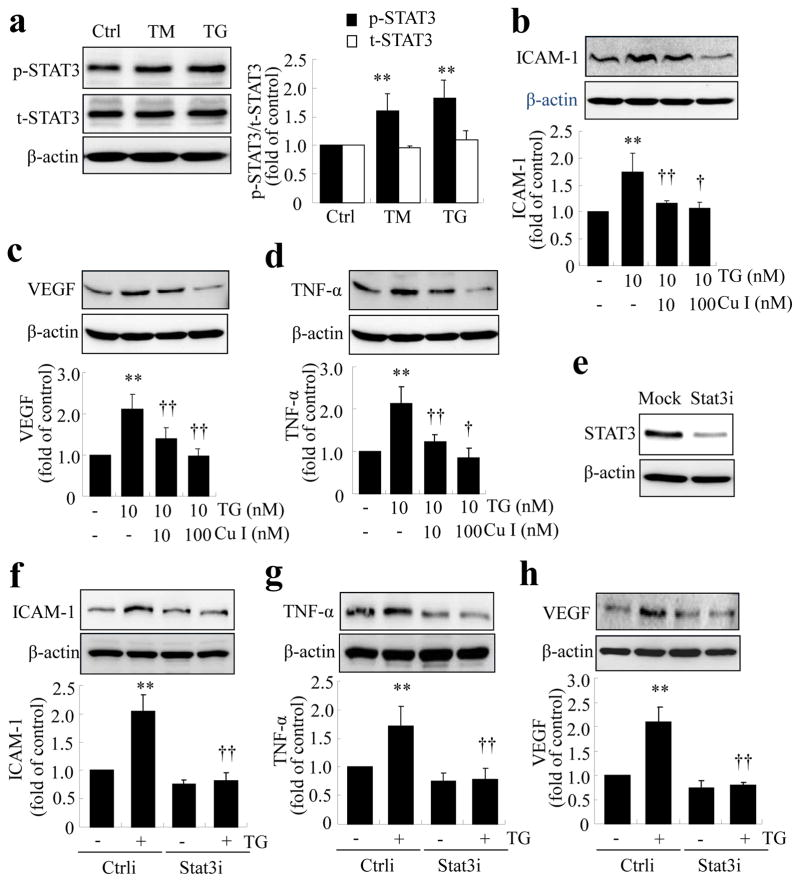
We next addressed if STAT3 activation plays a role in ER-stress-driven inflammation. As shown in Fig. 5a, exposure of TR-iBRB cells to TM or TG induced a significant increase in STAT3 phosphorylation, suggesting that ER stress is sufficient to induce STAT3 activation. Pretreatment of cells with cucurbitacin I, a specific inhibitor of STAT3 phosphorylation, dose-dependently decreased production of ICAM-1, TNF-α and VEGF in TR-iBRB cells treated with ER stress inducer, TG (Fig. 5b–d). Similarly, deletion of STAT3 using specific siRNA against rat STAT3 prevented TG-induced ICAM-1, TNF-α and VEGF upregulation (Fig. 5e–h). Taken together, these results indicate that STAT3 activation is essential for ER-stress-associated inflammation in retinal ECs.
Fig. 5.
Activation of STAT3 is required for ER stress-mediated inflammation in TR-iBRB cells. (a) TR-iBRB cells were treated with TM (50 ng/ml) or TG (10 nmol/l) for 8 h, and levels of phosporylated STAT3 (p-STAT3; black bars) and total STAT3 (t-STAT3; white bars) were determined by western blot analysis and quantified by densitometry (mean±SD, n=3). (b–d) TR-iBRB cells were pretreated with cucurbitacin I (Cu I) for 1 h, followed by treatment with 10 nmol/l TG for 8 h. Levels of ICAM-1, TNF-α and VEGF were determined by western blot analysis and quantified by densitometry (mean±SD, n=3). **p<0.01 vs control; †p<0.05, ††p<0.01 vs TG group. (e–h) STAT3 was knocked down using siRNA (Stat3i), followed by treatment with 10 nmol/l TG for 8 h. Ctrli: scrambled/control siRNA. Knockdown efficiency was assessed from the protein level of STAT3 in cells transfected with Stat3i or transfectant only (e). Levels of ICAM-1, TNF-α and VEGF were determined by western blot analysis and quantified by densitometry (f–h, mean±SD, n=3). **p<0.01 vs Ctrli; ††p<0.01 vs Ctrli+TG
Early activation of STAT3 is essential for the induction of ER stress and the activation of ATF4 by high glucose in retinal ECs
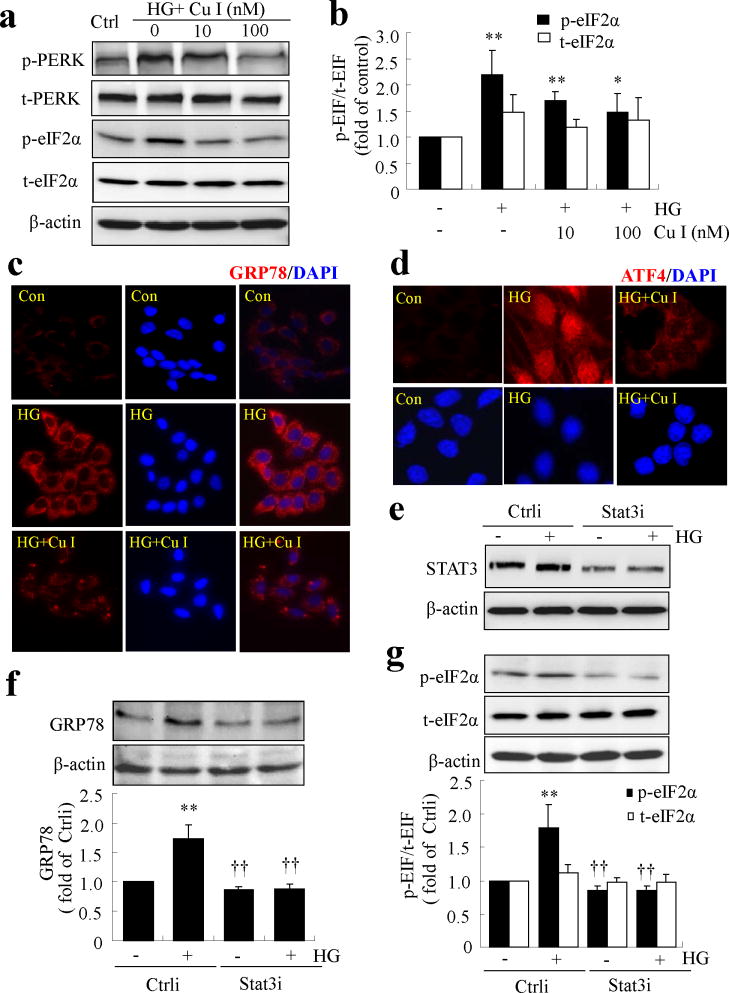
Interestingly, we noticed that, as shown in Fig. 4a, high-glucose treatment for 2 h induced a modest yet significant increase in STAT3 activation. We speculated that this early activation of STAT3 may be associated with the induction of ER stress by high glucose. To test this hypothesis, we treated TR-iBRB cells with the STAT3 inhibitor, cucurbitacin I, for 1 h, and then exposed the cells to high glucose for 8 h. ER stress markers were determined by western blot analysis and immunocytochemistry. We found that cucurbitacin I dose-dependently attenuated high-glucose-induced phosphorylation of PERK and eIF2α (Fig. 6a, b). In addition, cucurbitacin I markedly attenuated GRP78 levels in high-glucose-treated cells (Fig. 6c). Furthermore, pretreatment with cucurbitacin I abolished high-glucose-induced ATF4 production and its translocation to the nucleus (Fig. 6d). Consistently, knockdown of STAT3 using siRNA successfully blocked high-glucose-induced GRP78 production and eIF2α phosphorylation (Fig. 6e–g). These results suggest that early activation of STAT3 contributes to the induction of ER stress by high glucose.
Fig. 6.
Activation of STAT3 contributes to high-glucose-induced ER stress in TR-iBRB cells. (a–d) TR-iBRB cells were pretreated with cucurbitacin I (Cu I) for 1 h, followed by treatment with high glucose (HG) for 8 h. (a,b) Levels of phosphorylated (p) and total (t) PERK and eIF2α proteins were determined by western blot analysis. Levels of p-eIF2α (black bar) and t-eIF2α (white bar) were quantified by densitometry (mean±SD, n=3). *p<0.05, **p<0.01 vs control. (c) Immunostaining showing increased GRP78 level in HG-treated cells, but not in those treated with HG+Cu I compared with control cells. GRP78 (red) and DAPI (blue). (d) Immunofluorescence showing nuclear translocation of ATF4 in HG-treated cells, but not in cells exposed to HG+Cu I. ATF4 (red) and DAPI (blue). (e–g) STAT3 was knocked down using siRNA (Stat3i), followed by treatment with HG for 8 h in TR-iBRB cells. Ctrli: scrambled/control siRNA. Levels of STAT3, GRP78 and p-eIF2α were determined by western blot analysis and quantified by densitometry (mean±SD, n=3). **p<0.01 vs Ctrli; ††p<0.01 vs Ctrli+HG
ATF4 upregulates production of inflammatory factors through activation of STAT3 in retinal ECs
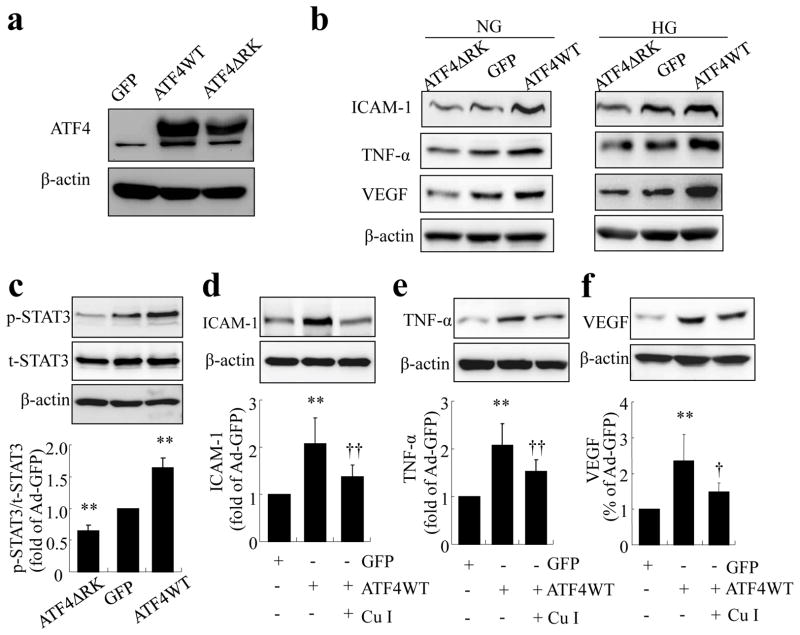
ATF4 is a key transcription factor that regulates a diverse set of stress-response genes, such as Chop (also known as Ddit3) and Vegf (also known as Vegfa). We hypothesised that activation of ATF4 is essential for ER-stress-induced inflammatory factor production in retinal ECs. To test this hypothesis, we overexpressed a WT and a dominant negative mutant of Atf4 (ATF4ΔRK) in TR-iBRB cells using adenoviral vectors. Successful production of ATF4 proteins was confirmed by western blot analysis (Fig. 7a). Overexpressing ATF4WT significantly increased ICAM-1, TNF-α and VEGF production in TR-iBRB cells under both normal and high-glucose conditions, while the upregulation of TNF-α was further enhanced by high glucose (Fig. 7b, and ESM Fig. 1 for densitometric quantification). Conversely, inhibiting ATF4 activity by ATF4ΔRK attenuated ICAM-1, TNF-α and VEGF production under high-glucose conditions (Fig. 7b). It also decreased the basal levels of TNF-α and VEGF, but not ICAM-1. Further, we determined whether STAT3 is implicated in the regulation of inflammatory factors by ATF4. As shown in Fig. 7c, overexpressing Atf4 stimulated a significant increase in STAT3 phosphorylation, while Atf4 inhibition alleviated the basal level of STAT3 activation in cells infected with adenovirus. Moreover, pretreatment of cells with STAT3 inhibitor, cucurbitacin I, markedly attenuated ATF4-induced ICAM-1, TNF-α and VEGF production (Fig. 7d–f), suggesting that STAT3 is required for ATF4-mediated inflammatory regulation in retinal ECs.
Fig. 7.
ATF4 upregulates inflammatory gene expression through activation of STAT3 in TR-iBRB cells. (a,b) TR-iBRB cells were transfected with Ad-GFP, Ad-ATF4 WT or Ad-ATF4ΔRK for 24 h, followed by treatment with normal glucose (NG) or high glucose (HG) for 24 h. Levels of ATF4 (a), ICAM-1 (b), TNF-α (b) and VEGF (b) were determined by western blot analysis and quantified by densitometry (mean±SD, n=3; see ESM Fig. 1). (c) TR-iBRB cells were transfected with Ad-GFP, Ad-ATF4WT or Ad-ATF4ΔRK for 24 h. Levels of phosphorylated (p)-STAT3 and total (t)-STAT3 were determined by western blot analysis and quantified by densitometry (mean±SD, n=3). **p<0.01 vs Ad-GFP. (d–f) TR-iBRB cells were preincubated with 100 nmol/l cucurbitacin I (Cu I) for 24 h, followed by transfection with Ad-ATF4WT for 24 h. Levels of ICAM-1, TNF-α and VEGF were determined by western blot analysis and quantified by densitometry (mean±SD, n=3). **p<0.01 vsAd-GFP; † p<0.05 vs Ad-ATF4WT, ††p<0.01 vs Ad-ATF4WT
Genetic inhibition of ATF4 ameliorates retinal inflammation and vascular leakage in STZ-diabetic mice
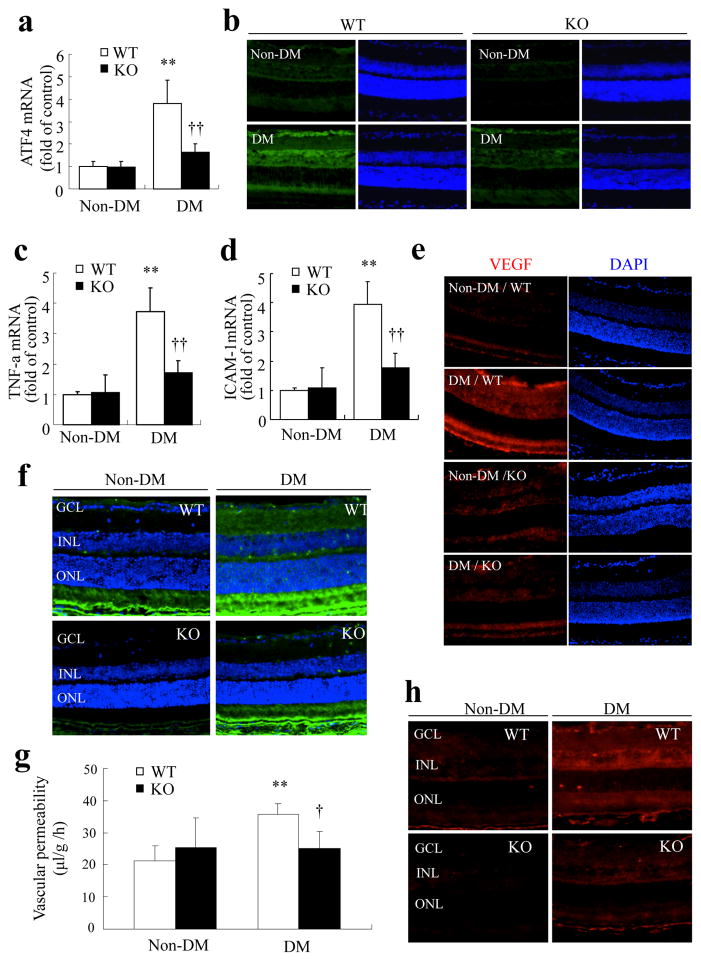
Finally, we investigated whether downregulation of the Atf4 gene alters retinal inflammation and vascular damage in diabetic retinopathy. We induced diabetes by STZ in heterozygous Atf4 KO mice and their WT littermates. Heterozygous KO mice were used because the homozygous mice are blind with microphthalmia due to impaired lens development [17]. No difference was observed in blood glucose and body weight between WT and heterozygous Atf4 KO mice (Table 1). Four weeks after the onset of hyperglycaemia, mice were killed, and retinas were harvested for analysis. As shown in Fig. 8a, expression of Atf4 was significantly increased by nearly fourfold in the retina of WT mice with diabetes, but not in Atf4 KO mice. Consistently, the protein level of ATF4 was also increased in retinas from diabetic WT mice, with intense ATF4 signal observed in the ganglion cell layer and around the inner nuclear layer on immunostaining (Fig. 8b). The increase in ATF4 was much less in the retina of diabetic Atf4 KO mice.
Table 1.
Characteristics of non-diabetic and diabetic Atf4 KO and WT mice (n=6)
| Diabetes status | Body weight (g) | Blood glucose (mmol/l) |
|---|---|---|
| Control Atf4+/+ | 23.80±2.39 | 8.76±1.97 |
| Control Atf4+/− | 23.52±0.63 | 8.23±0.87 |
| Diabetic Atf4+/+ | 21.7±2.23 | 22.02±2.97 |
| Diabetic Atf4+/− | 21.37±1.9 | 21.74±2.82 |
Values are means±SD
Fig. 8.
Genetic inhibition of ATF4 ameliorates retinal inflammation and vascular leakage in STZ-diabetic mice. Eight-week-old WT mice (white bars) and heterozygous Atf4 KO mice (black bars) were given five consecutive injections of STZ to induce diabetes mellitus (DM). Four weeks after the onset of hyperglycaemia, mRNA expression of Atf4 (a), Tnf (c) and Icam1 (d) in the retina was measured by real-time RT-PCR (mean±SD, n=6). **p<0.01 vs non-diabetic WT mice; ††p<0.01 vs diabetic WT mice. (b,e) Immunostaining showing decreased levels of retinal ATF4 (b) and VEGF (e) in the diabetic Atf4 KO mice compared with the diabetic WT mice. ATF4 (green), VEGF (red) and DAPI (blue). (f) Immunofluorescence of albumin (green) showing markedly decreased extravasation of albumin in diabetic Atf4 KO mice. GCL: ganglion cell layer; INL: inner nuclear layer; ONL: outer nuclear layer. g BRB breakdown was quantified by FITC–dextran assay. Results show that diabetes induced a significant increase in retinal vascular permeability in WT mice (white bars), which was completely abolished in Atf4 KO mice (black bars) (mean±SD, n=5). **p<0.01 vs non-diabetic WT mice; †p<0.05 vs diabetic WT mice. (h) Immunostaining of phosphorylated STAT3 showing that phosphorylation of STAT3 in the retina induced by diabetes was markedly reduced in Atf4 KO mice
We next determined if ATF4 inhibition ameliorates retinal inflammatory gene expression in diabetic mice. We showed that the mRNA expression of Tnf and Icam1 was significantly increased in WT mice after induction of diabetes, but not in Atf4 KO mice (Fig. 8c, d). Similarly, we found that VEGF level was markedly increased in retinas from diabetic WT mice, while no increase was observed in diabetic Atf4 KO mice (Fig. 8e). These results suggest that ATF4 is required for production of key inflammatory factors in diabetic retinopathy. Next, we assessed whether depletion of ATF4 alters retinal vascular permeability induced by diabetes. Retinal permeability was measured using immunostaining of albumin extravasation in retinal sections and by quantitative FITC-conjugated dextran assay. As shown in Fig. 8f, leakage of albumin around blood vessels was observed in the retinas from diabetic WT mice. Intense signals were localised to the inner and outer plexus layers. This leakage in the inner retina was not observed in diabetic Atf4 KO mice. Consistently, the FITC–dextran assay showed a twofold increase in vascular permeability in diabetic WT mice, but not in Atf4 KO mice (Fig. 8g).
Finally, we explored if ATF4 inhibition regulates STAT3 activation in the diabetic retina. Phosphorylation of STAT3 was detected using immunohistochemistry. As shown in Fig. 8h, STAT3 phosphorylation was dramatically increased in the retina from diabetic WT mice, but much less increase was observed in diabetic Atf4 KO mice. This suggests that ATF4 activation is required for STAT3 signalling in diabetic retinopathy. Together, these results indicate a pivotal role for ATF4 in retinal inflammation and vascular leakage in diabetic retinopathy.
Discussion
It has been demonstrated that ER stress is implicated in chronic inflammatory diseases, including diabetes [26]. We have previously reported that ER stress was increased in diabetic retinopathy, and was essential for diabetes-induced retinal inflammation [16]. Further, preconditioning with ER stress or enhancement of the protective mechanism of the ER effectively prevented retinal vascular leakage induced by inflammatory cytokines [21]. These findings suggest that homeostasis of the ER is important for maintaining the normal function of the retinal vascular system. However, much remains to be understood about the cellular mechanisms and signalling pathways by which ER stress promotes inflammation in the diabetic retina. In this study, we have demonstrated that ER stress induced by high glucose resulting in activation of the ATF4/STAT3 pathway is a key mediator of endothelial inflammation and retinal vascular leakage during diabetes. We have shown that high glucose was sufficient to induce ER stress in retinal ECs, and that inhibition of ER stress successfully prevented the high-glucose-induced increase in inflammatory factor production. Interestingly, in a recent study, we found that only intermittent high glucose, but not constant high glucose, stimulates ER stress and increases ATF4 production in primary human retinal pericytes [27]. Whether retinal ECs are more sensitive to high-glucose-induced ER stress remains to be determined. Different responses to high-glucose treatment in human, bovine and rat ECs have also been reported [11, 23–25]. These discrepancies may be related to the differences in the species and donors from which the cells were derived and the culture conditions used in the studies. The contribution of paracrine inflammatory cytokines such as TNF-α to high-glucose-induced EC inflammation also needs to be taken into consideration.
Our data suggest that ATF4 is a key regulator of endothelial inflammation in diabetic retinopathy. ATF4 is a bZIP transcription factor, belonging to the superfamily of DNA-binding proteins. It is induced by ER stress as a downstream effector of the PERK–UPR branch. During ER stress, PERK is activated by autophosphorylation and in turn phosphorylates eIF2α, leading to a reduction in global protein translation [28]. At the same time, some genes, such as ATF4, with upstream open reading frames in its 5′ untranslated region, escape the eIF2α-initiated translational attenuation, and enhance their production when eIF2α is phosphorylated [29, 30]. Indeed, we here show that high glucose increased ATF4 levels after PERK and eIF2α phosphorylation, which was inhibited by chemical chaperones that eliminate ER stress. As a transcription factor, ATF4 binds to the CRE site in the promoter region of stress-response genes. It can also form heterodimers with other bZIP transcription factors to induce gene transcription [31]. Previous studies have shown that ATF4 is required for expression of proinflammatory genes, such as VEGF, IL8, IL6, CXCL3 and MCP-1 (also known as Ccl2), induced by oxidised lipid, homocysteine and arsenite [32–34]. It binds to an amino acid response element and upregulates VEGF expression in human RPE cells [33]. Interestingly, we found that ATF4 crosstalking with STAT3 contributes to high-glucose-induced inflammatory factor production in retinal ECs. Further, genetic downregulation of the Atf4 gene in mice successfully prevented diabetes-induced retinal inflammation and vascular leakage, indicating a critical role for ATF4 in diabetic retinopathy.
Another key finding from the present study is that activation of STAT3 is central to hyperglycaemia-induced ER stress and inflammation in retinal ECs. We recently demonstrated that STAT3, activated by oxidative stress, was required for high-glucose-induced VEGF production in retinal ECs [11]. Results from the present study confirm the essential role of STAT3 in regulation of VEGF. Furthermore, we have demonstrated that STAT3 was activated by ER stress, and pharmaceutical inhibition or knockdown of Stat3 completely abolished ER-stress-induced ICAM-1, TNF-α and VEGF in retinal ECs. This suggests that STAT3 is implicated in ER-stress-driven endothelial inflammation. The activation of STAT3 during ER is not surprising, although the mechanisms remain to be investigated. STAT3 is a major stress-response gene implicated in cell survival and inflammation. In a rat model of retinal detachment, in which the retina was separated from its source of nutritional and metabolic support, activation of Stat3 was observed in the retina [35], coincident with ER stress and retinal neuronal apoptosis [36]. With regard to the mechanism of STAT3 activation, we found that overexpressing Atf4, a major effector of ER stress, was sufficient to induce STAT3 activation in retinal ECs. In contrast, downregulation of Atf4 ameliorated retinal STAT3 activity in diabetic animals. How ATF4 activates the STAT3 pathways is currently unknown. We observed that total STAT3 level was not changed in cells overexpressing WT or dominant mutant Atf4, suggesting that the regulation is not likely to occur at the transcription level. Consistent with this, a previous study reported that mammary glands from Atf4-transgenic mice had increased nuclear translocation of activated STAT3 and upregulation of its target gene [37]. Interestingly, we found that, in addition to a role for STAT3 in ER-stress-mediated inflammation, the early activation of STAT3 contributed to high-glucose-induced ER stress and ATF4 activation. Inhibition of STAT3 completely abolished PERK phosphorylation and ATF4 activation in high-glucose-treated cells. Although the effect of STAT3 may be secondary to the induction of its downstream genes, such as Tnf, which has been shown to be a potent inducer of ER stress [21], recent work by Coe and colleagues demonstrates that STAT3 can be sequestered by ERp57 in the ER lumen, preventing STAT3 activation [38]. This raises the possibility that STAT3 may interact directly with ER-resident proteins and regulate ER stress. Taken together, these findings strongly suggest the complex crosstalking and reciprocal regulation between ER stress, ATF4 and STAT3 pathways, which warrants further in-depth investigation.
Supplementary Material
Acknowledgments
We thank L.S. Boone and L.J. Williams (Dean A. McGee Eye Institute) for excellent work on retinal section preparation, and Diabetes COBRE Histology Core (OUHSC, Oklahoma City, OK, USA) for image acquisition.
Funding
This work was supported by the National Institutes of Health Grant EY019949, American Diabetes Association Grant 7-11-BS-182, a Research Grant HR10-060 from Oklahoma Center for the Advancement of Science and Technology, a Research Grant M2010088 from the American Health Assistance Foundation, and Dr William Talley Research Award from the Harold Hamm Diabetes Center.
Abbreviations
- ATF4
Activating transcription factor
- BRB
Blood–retinal barrier
- CHOP
C/EBP homologous protein
- EC
Endothelial cell
- eIF2α
Eukaryotic translation initiation factor-2α
- ER
Endoplasmic reticulum
- GFP
Green fluorescent protein
- GRP78
Glucose-regulated protein 78
- ICAM-1
Intercellular adhesion molecule 1
- KO
Knockout
- PBA
4-Phenyl butyrate
- PERK
RNA-dependent protein kinase-like ER kinase
- siRNA
Small interfering RNA
- STAT3
Signal transducer and activator of transcription 3
- STZ
Streptozotocin
- TG
Thapsigargin
- TM
Tunicamycin
- TUDCA
Tauroursodeoxycholic acid
- VEGF
Vascular endothelial growth factor
- WT
Wild-type
Footnotes
Duality of interest
The authors declare that there is no duality of interest associated with this manuscript.
Contribution statement
YC, JJW and SXZ: Conceived and designed the experiments; YC, JJW and JL: performed the experiments. YC, JJW, JL and SXZ: analysed and interpreted the data. KIH, RR and TT: contributed reagents, interpreted the data and revised the manuscript; YC, JJW, JL and SXZ: wrote and revised the manuscript. All authors approved the final version.
References
- 1.Schalkwijk CG, Stehouwer CDA. Vascular complications in diabetes mellitus: the role of endothelial dysfunction. Clin Sci. 2005;109:143–159. doi: 10.1042/CS20050025. [DOI] [PubMed] [Google Scholar]
- 2.Fong DS, Aiello L, Gardner TW, et al. Diabetic retinopathy. Diabetes Care. 2003;26:226–229. doi: 10.2337/diacare.26.1.226. [DOI] [PubMed] [Google Scholar]
- 3.American Diabetes Association. Diabetic nephropathy. Diabetes Care. 2000;23:S69–72. [PubMed] [Google Scholar]
- 4.Antonetti DA, Lieth E, Barber AJ, Gardner TW. Molecular mechanisms of vascular permeability in diabetic retinopathy. Semin Ophthalmol. 1999;14:240–248. doi: 10.3109/08820539909069543. [DOI] [PubMed] [Google Scholar]
- 5.Mizutani M, Kern TS, Lorenzi M. Accelerated death of retinal microvascular cells in human and experimental diabetic retinopathy. The Journal of Clinical Investigation. 1996;97:2883–2890. doi: 10.1172/JCI118746. [DOI] [PMC free article] [PubMed] [Google Scholar]
- 6.Kowluru RA, Odenbach S. Effect of long-term administration of alpha lipoic acid on retinal capillary cell death and the development of retinopathy in diabetic rats. Diabetes. 2004;53:3233–3238. doi: 10.2337/diabetes.53.12.3233. [DOI] [PubMed] [Google Scholar]
- 7.Aiello LP, Wong JS. Role of vascular endothelial growth factor in diabetic vascular complications. Kidney Int Suppl. 2000;77:S113–119. doi: 10.1046/j.1523-1755.2000.07718.x. [DOI] [PubMed] [Google Scholar]
- 8.Qaum T, Xu Q, Joussen AM, et al. VEGF-initiated blood-retinal barrier breakdown in early diabetes. Invest Ophthalmol Vis Sci. 2001;42:2408–2413. [PubMed] [Google Scholar]
- 9.Joussen AM, Poulaki V, Mitsiades N, et al. Nonsteroidal anti-inflammatory drugs prevent early diabetic retinopathy via TNF-alpha suppression. FASEB Journal. 2002;16:438–440. doi: 10.1096/fj.01-0707fje. [DOI] [PubMed] [Google Scholar]
- 10.Li J, Wang JJ, Chen D, et al. Systemic administration of HMG-CoA reductase inhibitor protects the blood-retinal barrier and ameliorates retinal inflammation in type 2 diabetes. Exp Eye Res. 2009;89:71–78. doi: 10.1016/j.exer.2009.02.013. [DOI] [PMC free article] [PubMed] [Google Scholar]
- 11.Li J, Wang JJ, Yu Q, Chen K, Mahadev K, Zhang SX. Inhibition of reactive oxygen species by Lovastatin downregulates vascular endothelial growth factor expression and ameliorates blood-retinal barrier breakdown in db/db mice: role of NADPH oxidase 4. Diabetes. 2010;59:1528–1538. doi: 10.2337/db09-1057. [DOI] [PMC free article] [PubMed] [Google Scholar]
- 12.Zhang SX, Wang JJ, Gao G, Shao C, Mott R, Ma J-x. Pigment epithelium-derived factor (PEDF) is an endogenous anti-inflammatory factor. FASEB J. 2006;20:323–325. doi: 10.1096/fj.05-4313fje. [DOI] [PubMed] [Google Scholar]
- 13.Joussen AM, Poulaki V, Qin W, et al. Retinal vascular endothelial growth factor induces intercellular adhesion molecule-1 and endothelial nitric oxide synthase expression and initiates early diabetic retinal leukocyte adhesion in vivo. American Journal of Pathology. 2002;160:501–509. doi: 10.1016/S0002-9440(10)64869-9. [DOI] [PMC free article] [PubMed] [Google Scholar]
- 14.Koizumi K, Poulaki V, Doehmen S, et al. Contribution of TNF-alpha to leukocyte adhesion, vascular leakage, and apoptotic cell death in endotoxin-induced uveitis in vivo. Invest Ophthalmol Vis Sci. 2003;44:2184–2191. doi: 10.1167/iovs.02-0589. [DOI] [PubMed] [Google Scholar]
- 15.Behl Y, Krothapalli P, Desta T, DiPiazza A, Roy S, Graves DT. Diabetes-enhanced tumor necrosis factor-alpha production promotes apoptosis and the loss of retinal microvascular cells in type 1 and type 2 models of diabetic retinopathy. Am J Pathol. 2008;172:1411–1418. doi: 10.2353/ajpath.2008.071070. [DOI] [PMC free article] [PubMed] [Google Scholar]
- 16.Li J, Wang JJ, Yu Q, Wang M, Zhang SX. Endoplasmic Reticulum Stress is implicated in Retinal Inflammation and Diabetic Retinopathy. FEBS Lett. 2009;583:1521–1527. doi: 10.1016/j.febslet.2009.04.007. [DOI] [PMC free article] [PubMed] [Google Scholar]
- 17.Masuoka HC, Townes TM. Targeted disruption of the activating transcription factor 4 gene results in severe fetal anemia in mice. Blood. 2002;99:736–745. doi: 10.1182/blood.v99.3.736. [DOI] [PubMed] [Google Scholar]
- 18.Hosoya K, Tomi M, Ohtsuki S, et al. Conditionally immortalized retinal capillary endothelial cell lines (TR-iBRB) expressing differentiated endothelial cell functions derived from a transgenic rat. Exp Eye Res. 2001;72:163–172. doi: 10.1006/exer.2000.0941. [DOI] [PubMed] [Google Scholar]
- 19.Lange PS, Chavez JC, Pinto JT, et al. ATF4 is an oxidative stress-inducible, prodeath transcription factor in neurons in vitro and in vivo. J Exp Med. 2008;205:1227–1242. doi: 10.1084/jem.20071460. [DOI] [PMC free article] [PubMed] [Google Scholar]
- 20.Jiang K, Krous LC, Knowlton N, et al. Ablation of Stat3 by siRNA Alters Gene Expression Profiles in JEG-3 Cells: A Systems Biology Approach. Placenta. 2009;30:806–815. doi: 10.1016/j.placenta.2009.06.006. [DOI] [PubMed] [Google Scholar]
- 21.Li J, Wang JJ, Zhang SX. Preconditioning with endoplasmic reticulum stress mitigates retinal endothelial inflammation via activation of X-box binding protein 1. Journal of Biological Chemistry. 2011;286:4912–4921. doi: 10.1074/jbc.M110.199729. [DOI] [PMC free article] [PubMed] [Google Scholar]
- 22.Mandal MN, Patlolla JM, Zheng L, et al. Curcumin protects retinal cells from light-and oxidant stress-induced cell death. Free Radic Biol Med. 2009;46:672–679. doi: 10.1016/j.freeradbiomed.2008.12.006. [DOI] [PMC free article] [PubMed] [Google Scholar]
- 23.Perrone L, Devi TS, Hosoya K-i, Terasaki T, Singh LP. Thioredoxin interacting protein (TXNIP) induces inflammation through chromatin modification in retinal capillary endothelial cells under diabetic conditions. Journal of Cellular Physiology. 2009;221:262–272. doi: 10.1002/jcp.21852. [DOI] [PubMed] [Google Scholar]
- 24.Kowluru RA, Odenbach S. Role of interleukin-1 β in the pathogenesis of diabetic retinopathy. British Journal of Ophthalmology. 2004;88:1343–1347. doi: 10.1136/bjo.2003.038133. [DOI] [PMC free article] [PubMed] [Google Scholar]
- 25.Busik JV, Mohr S, Grant MB. Hyperglycemia-induced reactive oxygen species toxicity to endothelial cells is dependent on paracrine mediators. Diabetes. 2008;57:1952–1965. doi: 10.2337/db07-1520. [DOI] [PMC free article] [PubMed] [Google Scholar]
- 26.Ozcan U, Yilmaz E, Ozcan L, et al. Chemical chaperones reduce ER stress and restore glucose homeostasis in a mouse model of type 2 diabetes. Science. 2006;313:1137–1140. doi: 10.1126/science.1128294. [DOI] [PMC free article] [PubMed] [Google Scholar]
- 27.Zhong Y, Wang JJ, Zhang SX. Intermittent but not constant high glucose induces ER stress and inflammation in human retinal pericytes. Adv Exp Med Biol. 2011 doi: 10.1007/978-1-4614-0631-0_37. In press. [DOI] [PMC free article] [PubMed] [Google Scholar]
- 28.Harding HP, Zhang Y, Bertolotti A, Zeng H, Ron D. Perk is essential for translational regulation and cell survival during the unfolded protein response. Molecular cell. 2000;5:897–904. doi: 10.1016/s1097-2765(00)80330-5. [DOI] [PubMed] [Google Scholar]
- 29.Harding HP, Novoa I, Zhang Y, et al. Regulated translation initiation controls stress-induced gene expression in mammalian cells. Mol Cell. 2000;6:1099–1108. doi: 10.1016/s1097-2765(00)00108-8. [DOI] [PubMed] [Google Scholar]
- 30.Vattem KM, Wek RC. Reinitiation involving upstream ORFs regulates ATF4 mRNA translation in mammalian cells. Proc Natl Acad Sci U S A. 2004;101:11269–11274. doi: 10.1073/pnas.0400541101. [DOI] [PMC free article] [PubMed] [Google Scholar]
- 31.Chumakov AM, Silla A, Williamson EA, Koeffler HP. Modulation of DNA binding properties of CCAAT/enhancer binding protein epsilon by heterodimer formation and interactions with NFkappaB pathway. Blood. 2007;109:4209–4219. doi: 10.1182/blood-2005-09-031963. [DOI] [PMC free article] [PubMed] [Google Scholar]
- 32.Roybal CN, Yang S, Sun CW, et al. Homocysteine increases the expression of vascular endothelial growth factor by a mechanism involving endoplasmic reticulum stress and transcription factor ATF4. J Biol Chem. 2004;279:14844–14852. doi: 10.1074/jbc.M312948200. [DOI] [PubMed] [Google Scholar]
- 33.Roybal CN, Hunsaker LA, Barbash O, Vander Jagt DL, Abcouwer SF. The oxidative stressor arsenite activates vascular endothelial growth factor mRNA transcription by an ATF4-dependent mechanism. J Biol Chem. 2005;280:20331–20339. doi: 10.1074/jbc.M411275200. [DOI] [PubMed] [Google Scholar]
- 34.Oskolkova OV, Afonyushkin T, Leitner A, et al. ATF4-dependent transcription is a key mechanism in VEGF up-regulation by oxidized phospholipids: critical role of oxidized sn-2 residues in activation of unfolded protein response. Blood. 2008;112:330–339. doi: 10.1182/blood-2007-09-112870. [DOI] [PMC free article] [PubMed] [Google Scholar]
- 35.Zacks DN, Han Y, Zeng Y, Swaroop A. Activation of Signaling Pathways and Stress-Response Genes in an Experimental Model of Retinal Detachment. Investigative Ophthalmology & Visual Science. 2006;47:1691–1695. doi: 10.1167/iovs.05-1209. [DOI] [PubMed] [Google Scholar]
- 36.Liu H, Qian J, Wang F, et al. Expression of two endoplasmic reticulum stress markers, GRP78 and GADD153, in rat retinal detachment model and its implication. Eye. 2009;24:137–144. doi: 10.1038/eye.2009.20. [DOI] [PubMed] [Google Scholar]
- 37.Bagheri-Yarmand R, Vadlamudi RK, Kumar R. Activating Transcription Factor 4 Overexpression Inhibits Proliferation and Differentiation of Mammary Epithelium Resulting in Impaired Lactation and Accelerated Involution. Journal of Biological Chemistry. 2003;278:17421–17429. doi: 10.1074/jbc.M300761200. [DOI] [PubMed] [Google Scholar]
- 38.Coe H, Jung J, Groenendyk J, Prins D, Michalak M. ERp57 Modulates STAT3 Signaling from the Lumen of the Endoplasmic Reticulum. Journal of Biological Chemistry. 285:6725–6738. doi: 10.1074/jbc.M109.054015. [DOI] [PMC free article] [PubMed] [Google Scholar]
Associated Data
This section collects any data citations, data availability statements, or supplementary materials included in this article.


