

Abstract
Microparticles and exosomes are two of the most well characterized membrane-derived microvesicles released either directly from the plasma membrane or released through the fusion of intracellular multivesicular bodies with the plasma membrane, respectively. They are thought to be involved in many significant biological processes such as cell to cell communication, rescue from apoptosis, and immunological responses. Here we report for the first time a quantitative study of proteins from β-cell-derived microvesicles generated after cytokine induced apoptosis using stable isotope labeled amino acids in cell culture combined with mass spectrometry. We identified and quantified a large number of β-cell-specific proteins and proteins previously described in microvesicles from other cell types in addition to new proteins located to these vesicles. In addition, we quantified specific sites of protein phosphorylation and N-linked sialylation in proteins associated with microvesicles from β-cells. Using pathway analysis software, we were able to map the most distinctive changes between microvesicles generated during growth and after cytokine stimulation to several cell death and cell signaling molecules including tumor necrosis factor receptor superfamily member 1A, tumor necrosis factor, α-induced protein 3, tumor necrosis factor-interacting kinase receptor-interacting serine-threonine kinase 1, and intercellular adhesion molecule 1.
The two types of microvesicles most often described in the literature are called microparticles and exosomes. Cellular microparticles (MPs)1 were first described to be present in human plasma in 1967 (1). MPs are shed from the plasma membrane either through activation or through a proapoptotic stimulus. This process is highly regulated, and the type and content of the resulting MPs depends on the initial signal given (2).
Cell activation promotes a rise in intracellular calcium followed by a disruption and remodeling of the membrane and membrane skeleton leading to membrane blebbing and the release of MPs (3). Upon a proapoptotic signal, ROCK-1 will be activated (4, 5), initiating a signaling cascade leading to the formation and shedding of MPs. They are commonly identified based on their defined size (100 nm to 1 μm), specific surface markers depending on their origin, and often the exposure of the negatively charged phosphatidylserine in the outer membrane. It has been shown that the formation of MPs may not only be a side effect of cellular processes, but that they may have various (patho-) physiological functions (6, 7). In addition, it has been shown that different MP populations occur in blood from healthy individuals (8), as well as diseased individuals (9); however, changes in numbers, cellular origin, and composition of the MPs may vary according to the level of disease (10). It is presently not known whether cell activation or apoptosis leads to identical MPs with respect to biomolecular composition. A recent proteomics study has shown that the total protein content in MPs only comprise a very small part (less than 0.07%) of the total amount of proteins present in plasma, and purification of these present a 1500-fold enrichment of cell-derived proteins (11). This study, however, does not report any specific changes in the MP proteome as a consequence of environmental changes (e.g., diseases). Proteomics studies are very limited in the area of MPs, most likely because of the novelty of the area and the fact that MPs and exosomes previously have been regarded as artifacts (12).
Exosomes were first described as microvesicles containing specific enzymatic activities released from neoplastic cell lines (13). A few years later the release of vesicles of endocytic origin by reticulocytes during maturation was reported (14, 15). Exosomes are released from a variety of cells including platelets (16), dendritic cells (17), liver cells (18), tumor cells (19), and most likely other cell types through the fusion of intracellular multivesicular bodies with the plasma membrane. They have been defined by their size (40–100 nm) and their highly specialized protein content with a number of common proteins that are shared by what apparently seems to be all types of exosomes regardless of their origin (20).
Within the islets of Langerhans in the pancreas, the majority of the cell mass is comprised of β-cells (60–80%), which produce the hormone insulin that controls the level of glucose in the blood. The pathogenesis of type 1 diabetes mellitus is defined by the loss of insulin production because of the selective, autoimmune destruction of the pancreatic β-cells, thereby decreasing the ability of the body to maintain a functional metabolism with increased levels of glucose in blood and urine as characteristic symptoms. It is believed that the destruction of β-cells is associated with a variety of immune-mediated phenomena. It is known that the islets of Langerhans are infiltrated with lymphocytes and macrophages after onset of type 1 diabetes mellitus (21, 22). To attract more immune cells to the site of inflammation, these cells secrete a number of proinflammatory cytokines after infiltration. β-Cells have proven to be exceptionally sensitive to the proinflammatory cytokines IL-1β, interferon-γ (IFNγ), and TNFα compared with the other cells in the pancreas (23–26). β-Cells exposed to these cytokines and especially cocktails of these are known to initiate an apoptotic cascade (22, 27).
Because the pathogenesis of type 1 diabetes mellitus is characterized by selective destruction of the insulin-producing β-cells in the pancreatic islets of Langerhans, we speculated that we will find MPs and exosomes specific for cytokine-exposed apoptotic β-cells in the medium after cytokine exposure. Interestingly, membrane blebbing (generation of MPs) was described in β-cells in situ in isolated rat pancreatic cells perfused with IL-1β (29). This suggests that MPs may be produced when β-cells are exposed to cytokines in vitro in cell cultures and in vivo.
In this study, we have developed a method for specific isolation and characterization of membrane proteins from microvesicles originating from microvesicles (MPs and exosomes) released by a β-cell line (NHI 6F Tu28) before and after cytokine stimulation. We have used stable isotope labeling in cell culture (SILAC) (30, 31) in combination with sodium carbonate treatment, ultracentrifugation, and high accuracy mass spectrometry to identify and quantify membrane-associated proteins from the secreted microvesicles. In addition, we have specifically purified phosphorylated peptides and N-linked sialylated glycopeptides from the membrane proteins using optimized TiO2 chromatographic procedures (32–34). We have identified a total of 401 proteins associated with MPs and 191 proteins associated with exosomes. The protein overlap between the two microvesicles types is rather large, indicating that the microvesicles could originate from specialized areas of the membrane, e.g., from lipid rafts. In addition, we identified 151 phosphorylation sites and 239 sialylated N-glycosylation sites on proteins originating from β-cell-derived microvesicles. Moreover, we have identified TNF receptor up-regulation in microparticles released from cytokine-stimulated insulinoma cell line, suggesting a possible role for microvesicles in inflammatory modulation.
EXPERIMENTAL PROCEDURES
Materials
Custom-made RPMI 1640 medium (Invitrogen catalog number 61870 without arginine, without lysine), penicillin/streptomycin, and dialyzed fetal bovine serum were from Invitrogen. Lysine and arginine were from Sigma, and the stable isotope-labeled lysine and arginine ([13C6]lysine and [13C6,15N4]arginine) were purchased from Cambridge Isotope Laboratories. Recombinant rat IL-1β, IFNγ, and TNFα were from Peprotech. Acetonitrile and staurosporine were from Sigma. TFA and glycolic acid were from Fluka (Sigma). Ammonium solution (25%) and formic acid were from Merck. Modified trypsin was from Promega (Madison, WI). Endoglycosidase F and alkaline phosphatase were from Roche Applied Science. Titanium dioxide beads were from GL Science (Titansphere; 5 μm). Poros Oligo R3 reversed phase chromatography resin was from PerSeptive Biosystems (Framingham, MA). 3M Empore C18 discs were from 3M Bioanalytical Technologies (St. Paul, MN). All of the reagents in the experiments were analytical grade or better, and the water was from a MilliQ system (Millipore, Bedford, MA).
Cell Culture
Cells from a rat insulinoma cell line (NHI 6F Tu28) (35) were grown in Corning Cell-bind flasks (Corning) in custom-made RPMI 1640 medium with 10% microvesicle-depleted dialyzed fetal bovine serum (Invitrogen) supplemented with penicillin/streptomycin. The serum was depleted for microvesicles through the following process: the dialyzed fetal bovine serum was diluted to 20% in custom-made RPMI 1640 and centrifuged for 17 h at 100,000 × g. The supernatant was sterile filtered, diluted to 10% serum with RPMI 1640, and stored at 4 °C prior to use.
NHI 6F Tu28 cells were grown in SILAC medium as described by Refs. 30 and 31. The cells were grown in light ([12C6]lysine and [12C6,14N4]arginine) and heavy ([13C6]lysine and [13C6,15N4]arginine) SILAC medium to 70–80% confluence. The light cell population was left unstimulated, whereas the heavy was stimulated with a mixture of proinflammatory cytokines (10 units/ml IL-1β + 500 units/ml TNFα) for 24 h. Following the 24-h incubation with the cytokines, the media from control and stimulated cells were harvested, mixed 1:1, and centrifuged at 1,500 × g for 10 min followed by 3,200 × g for 10 min to remove dead cells and cell debris. The supernatant containing the microvesicles was either centrifuged directly or aliquoted in 50-ml tubes and frozen at −80 °C until further use.
Apoptosis Assay and Fluorescence Microscopy
The cells were grown as above and stimulated with one of the following conditions: serum starvation, 10 units/ml IL-1β, 10 units/ml IL-1b + 500 units/ml IFNγ, or 10 units/ml IL-1β + 500 units/ml TNFα in chamber slides (Nunc Lab-Tek II; catalog number 154453; Nunc Denmark). The cells were treated with 0.125 μm staurosporine as a positive control for apoptosis. For the staining of apoptotic cells, the ApopTag kit from Chemicon was utilized according to the manufacturer's protocol. Briefly, the cells were fixed in 1% paraformaldehyde (in PBS, pH 7.4) overnight at 4 °C and postfixed using ice-cold EtOH:acetic acid (2:1) for 10 min at −20 °C. The fixed cells were equilibrated using the equilibration buffer from the ApopTag kit, and the apoptotic cells were stained using the TdT enzyme from the kit. After staining, the cells were washed and incubated with anti-digoxigenin antibody conjugated with rhodamine. The cells were washed and counterstained using DAPI in PBS with Mg2+ and Ca2+ for 5 min at room temperature.
Fluorescent microscopy was performed using an Olympus IX 81 microscope equipped with an Olympus DP70 camera and the AnalySIS software. The images were obtained using either a 10× objective (UPlanFI 10×/0.3 Ph1) or a 40× magnification objective (LUCplaneFI 40×/0.60 Ph2) and the following filters: Olympus U-MWG2 (excitation, 510–550 nm; emission, 590 nm) mirror unit for visualization of rhodamine staining and Olympus U-MNU2 (excitation, 360–370 nm; emission, 420 nm) mirror unit for visualization of DAPI staining.
Isolation of Microvesicles for Electron Microscopy
Secreted microvesicles were recovered from the cell culture supernatant by differential centrifugation. The cell culture supernatants were harvested followed by centrifugation at 1,500 × g for 10 min followed by 3,200 × g for 10 min to remove dead cells and cell debris. The medium was centrifuged at 20,000 × g for 2 h at 4 °C for the isolation of the microparticles. The 20,000 × g supernatant was transferred to a new tube and centrifuged at 100,000 × g for 2 h at 4 °C for the isolation of the exosomes.
Transmission Electron Microscopy
Purified vesicles were washed twice in PBS and fixed in PBS, 2% paraformaldehyde. The purified microvesicles were subsequently loaded on Butvar-coated grids, postfixed in 1% glutaraldehyde, contrasted in 2% uranyl oxalate, pH 7, and finally embedded in 2% methylcellulose, 0.4% uranyl acetate, pH 4. Observations were made using a CM120 transmission electron microscope (Philips) at 80 kV, and the images were recorded with a Morada digital camera (Olympus Soft Imaging Solutions GmbH, Münster, Germany).
Isolation of Microvesicles for Membrane Preparation and Proteomics
The cell culture supernatants were harvested and centrifuged at 1,500 × g for 10 min followed by 3,200 × g for 10 min to remove dead cells and cell debris. The harvested and centrifuged medium from 5 × 10⁷ control cells was mixed 1:1 (v/v) with harvested and centrifuged medium from 5 × 10⁷ stimulated and labeled cells before differential centrifugation. First, the mixed medium was centrifuged at 20,000 × g for 2 h at 4 °C in a Sorvall ultracentrifuge using 36-ml polyallomer tubes (Sorvall 03141). The supernatant was transferred to a new tube, and the pellet (MP pellet) was kept on ice until further use. The 20,000 × g supernatant was centrifuged at 100,000 × g for 2h at 4 °C, the supernatant was discarded, and the pellet (exosome pellet) was stored on ice until further use.
Membrane Isolation, Protein Digestion, and LC-MS Sample Preparation
The two pellets (MPs and exosomes) were dissolved in 1 ml of ice-cold 0.1 m Na2CO3, transferred to an ultracentrifugation tube and spun down at 250,000 × g for 1 h at 4 °C for isolation of the membrane (36). The membrane pellet was washed once with 0.1 m Na2CO3 and spun down at 250,000 × g for 1 h, and the supernatant was removed. The resulting membrane pellet was dissolved in urea buffer (6 m urea, 2 m thiourea, 0.4 m NH4HCO3), reduced with 20 mm DTT (1 h, 56 °C), alkylated using 40 mm iodoacetamide (45 min, room temperature, in the dark), and subsequently digested with 5 μg of Lys-C (Wako, Osaka, Japan) for 3 h at 37 °C. After Lys-C digestion, the solution was diluted eight times to 0.75 m urea, 0.25 m thiourea, and 10 μg of trypsin (Promega) was added for further digestion overnight at 37 °C.
For protein identification, the samples were desalted using a modified StageTip microcolumn consisting of a pipette tip with a C18 Empore disk plug packed with Poros Oligo R3 reversed phase material prior to the LC-MS/MS analysis. The peptides were acidified to pH < 3 using formic acid and loaded on the Oligo R3 microcolumn. The microcolumn was washed with 5% formic acid, and the peptides were eluted with 50% acetonitrile, 0.1% TFA. The eluent was lyophilized and redissolved in A solvent (0.1% formic acid) prior to the LC-MS/MS analysis.
Titanium Dioxide Enrichment of N-Linked Sialylated Glycopeptides
N-Linked sialylated glycopeptides were purified as previously described with minor modifications (33, 34). Briefly, to avoid the binding of “contaminating” phosphopeptides, the sample was treated with alkaline phosphatase for 1 h at 37 °C prior to TiO2 enrichment. For the TiO2 enrichment, the digested sample was diluted 1:5 in loading buffer (1 m glycolic acid, 80% acetonitrile, 5% TFA) and incubated with 1 mg of TiO2 beads rotating at room temperature for 10 min. The TiO2 beads were pelleted (14,000 × g, 30 s) and washed in loading buffer for 10 min, rotating at room temperature. The beads were pelleted (14,000 × g, 30 s), washed in washing buffer (80% acetonitrile, 1% TFA), and pelleted again. Finally the TiO2 was washed with 20% acetonitrile, 0.1% TFA. The supernatant was discarded, and the sialylated glycopeptides were eluted from the TiO2 beads with 5% NH4OH, pH 11.3. The eluted glycopeptides were lyophilized and subsequently redissolved in 50 mm NH4HCO3. Half a unit of endoglycosidase F was added to the redissolved glycopeptides, and the mixture was incubated for 3 h at 37 °C to remove the N-linked glycan structures. Finally, the deglycosylated sample was desalted using a Poros R3 microcolumn as above. The deglycosylated peptides were acidified using formic acid and loaded on the column, washed with 5% formic acid, and eluted with 50% acetonitrile, 0.1% TFA. The eluent was lyophilized and redissolved in A buffer (0.1% formic acid) prior to the LC-MS/MS analysis.
TiO2 Enrichment of Phosphopeptides
Phosphopeptides from the processed membrane preparation were purified as previously described (32, 34, 37). Briefly, to avoid the binding of “contaminating” N-linked sialylated glycopeptides, the sample was treated with endoglycosidase F for 3 h at 37 °C prior to TiO2 enrichment. It should be noted that O-linked sialylated glycopeptides are expected to be co-purified in the phosphopeptide fraction. For the TiO2 enrichment, the digested sample was diluted 1:5 in loading buffer (1 m glycolic acid, 80% acetonitrile, 5% TFA) and incubated with 1 mg of TiO2 beads rotating at room temperature for 10 min. The TiO2 beads were pelleted (14,000 × g, 30 s) and washed as described for the sialylated glycopeptides. The phosphopeptides were eluted from the TiO2 beads with 5% NH4OH, pH 11.3. The eluate was acidified using 100% formic acid, and the phosphopeptides were desalted as described above using a Poros R3 microcolumn. The phosphopeptides were eluted with 50% acetonitrile, 0.1% TFA and lyophilized. The phosphopeptides were redissolved in solvent (0.1% formic acid) prior to the LC-MS/MS analysis.
Liquid Chromatography Tandem Mass Spectrometry
The redissolved sample was loaded on an in-house packed fused silica 15-cm analytical column (100-μm inner diameter, 375-μm outer diameter; ReproSilPur C18 AQ 3 μm (Dr. Maisch, Germany)) and eluted at 250 nl/min by increasing the concentration of acetonitrile using an EASY-nLC system (Proxeon A/S, Odense, Denmark) with a 65-min gradient from 0 to 50% B solvent (A solvent: 0.1% formic acid; B solvent: 0.1% formic acid, 95% acetonitrile) coupled to an LTQ-Orbitrap XL mass spectrometer (Thermo Fisher Scientific) through a nanoelectrospray source (Proxeon A/S). The peptides were analyzed in the LTQ-Orbitrap XL using data-dependent acquisition with the following parameters. MS was performed in the Orbitrap using a target value of 1 × 10⁶ ions, and threshold for selection was 15,000. For each MS full scan, the five most intense ions were selected for MS/MS in the LTQ (target value of 3 × 10⁴ ions and max ion filling time set to 300 ms). The peptides were subjected to collision-induced dissociation for 30 ms. The phosphopeptides were subjected to multistage activation (38) using collision-induced dissociation for 30 ms of each excitation value. Four biological replicates were run for the analysis of nonmodified peptides, and three biological replicates were prepared for the phosphorylated and sialylated peptides.
Bioinformatics
All of the raw data files obtained from the different replicate experiments (four replicated for total proteome, three replicated for phosphoproteome analysis, and three replicated for the N-linked sialiome) were imported into Proteome Discoverer v1.3.0.339 (beta version) using an in-house MASCOT server (version 2.2) before searching them individually against an Uniprot (http://www.uniprot.org/) database containing rat sequences and common contaminants such as bovine serum albumin and human and sheep keratins (Uniprot-Rat updated June 16, 2011; 35,571 sequences). The following settings were used for the database searches in Proteome Discoverer: two missed cleavages; enzyme: trypsin; fixed modifications: carbamidomethyl; variable modifications: deamidation (N) (only in the glycosylation samples); Oxidation (M), Phospho (STY) (only in the phosphorylated peptide samples); MS tolerance, 10 ppm; MS/MS tolerance, 0.5 Da; instrument: ESI-TRAP; quantification: [13C6]lysine and [13C6,15N4]arginine. All of the database searches were performed including decoy, search and a false discovery rate of less than 1% was used as criteria for peptide identification. The spectra that were not assigned with 1% false discovery rate were searched again against Uniprot-Mouse database (Uniprot-Mouse updated June 16, 2011; 46,656 sequences) containing mouse sequences and common contaminants such as bovine serum albumin and human and sheep keratins. Peptides identified with less than 1% false discovery rate were accepted for further analysis. Sialylated, phosphorylated, and nonmodified proteins were considered identified with a minimum of one unique peptide hit. Enrichment reproducibility was calculated as the percentage of nonredundant peptide sequences identified in more than two (modified) or three (total) replicates (Table I).
Table I. Summary of the quantitative proteomics data derived from exosomes and microparticles released from a rat insulinoma cell line upon cytokine stimulation.
Protein and peptide numbers presented in this table are obtained after filtering for a false discovery rate of <1%. nr, nonredundant.
| Phosphorylated fraction |
Glycosylated fraction |
Totala |
||||
|---|---|---|---|---|---|---|
| Exosomes | MPs | Exosomes | MPs | Exosomes | MPs | |
| Mascot ion score threshold | 28.6 | 29.4 | 33.7 | 25.6 | 25.3 | 21.4 |
| Peptide sequences identified (nr)b | 17 | 91 | 56 | 201 | 458 | 1012 |
| Peptide sequences identified in n ≥ 2 or n ≥ 3 (total) experiments (nr) (%) | 11 (64%) | 64 (70%) | 42 (75%) | 162 (80%) | 213 (46%)j | 563 (55%)j |
| Phoshopeptide sequences (phosphosites) identified (nr)c | 21 (21) | 129 (130) | ||||
| Phosphopeptides quantified (nr)d | 16 | 127 | ||||
| Confidently assigned phosphorylation sites (FLR < 1%)e | 16 | 94 | ||||
| Glycopeptide sequences (glycosites) identified (nr)f | 56 (51) | 190 (188) | ||||
| Glycopeptides quantified (nr) | 49 | 177 | ||||
| Identified proteins | 15 | 67 | 38 | 104 | 191 | 401 |
| Unique proteinsg | 9 | 29 | 15 | 44 | 63 | 121 |
| Proteins identified in at least three experiments | 128 (67%) | 286 (71%) | ||||
| Quantified proteinsd | 164 | 366 | ||||
| Average (median) PSMs/proteinh | 11 (5) | 13 (5) | ||||
| Average unique peptides/proteini | 2 | 2 | ||||
a The Total columns indicate the total proteins/peptides identified in the enriched fractions (phosphorylation and glycosylation) and in the nonenriched fraction.
b Nonredundant peptide sequences are defined solely based on the amino acid sequence disregarding any modification.
c Nonredundant phosphopeptides are defined based on the amino acid sequence and phosphorylation site assignment.
d Proteins are quantified using all peptides taking the median of peptide ratios. For each peptide, if both quantification channels are detected, the ratio H/L is calculated. Peptides with missing quantitation channels or inconsistently labeled are removed from protein quantitation. In cases where one channel is missing, manual inspection of the m/z and isotopic pattern is performed to confirm the identity of the peptide before quantitation. Inconsistently labeled peptides are defined based on the missing labeled lysines or arginines within each peptide.
e The false localization rate (FLR) for phosphopeptides is obtained considering the phosphoRS probability ≥0.99 and Mascot delta score ≥10 (collision-induced dissociation/multistage activation) algorithms.
f Nonredundant N-linked sialylated glycopeptides are defined based on the amino acid sequence and glycosylation site assignment.
g Proteins are defined unique if they are not identified with peptide sequences shared by other proteins, which will then constitute a protein group. Leading proteins are defined based on the number of peptides assigned to it.
h PSM, peptide spectrum match.
i It should be noted that included in this calculation are proteins identified in the enriched fraction (phosphorylation and glycosylation) that are identified with one peptide. Moreover, it should be noted that because we have performed a SILAC labeling experiment, we have a double evidence for each peptide.
j It should be noted that in the total fraction are included also phosphoproteins and glycoproteins that were run three times and not four times, as was the nonmodified fraction.
The quantitation was performed using two algorithms of Proteome Discoverer, namely event detector and precursor ions quantifier, applying a 4-ppm mass variability and a 0.2-min retention time tolerance on precursor ion pairs. In particular, the peptide ratio was calculated from the summed extracted ion chromatogram areas of two matched isotope patterns across the chromatographic elution profile of a particular precursor ion using the same number of isotopes. Protein ratios were derived from the median of all peptide ratios. Peptides inconsistently labeled and with missing SILAC channels were excluded from quantitation and manually analyzed for further analyses. Each protein data set was normalized to 1 using the median ratio. Protein grouping was performed using Proteome Discoverer. Separate lists of identified sialylated peptides/proteins (supplemental Tables 3 and 4), phosphorylated peptides/proteins (supplemental Tables 3 and 4), and total peptides/proteins (supplemental Tables 1 and 2) were generated for the microparticles and exosomes samples, respectively.
Areas for each protein were used to calculate an intensity-dependent standard deviation and mean using the Ringo package in R-project (39). This was used to calculate a z-sore and to determine significantly regulated proteins at a 99% confidence level (|z-score| > 2.576) as shown in supplemental Fig. S1.
Phosphorylation site assignment and localization probability were calculated using a combination of phosphoRS score (40) and Mascot delta score (41) because it was shown that using different algorithms leads to different numbers and sets of nonredundant phosphorylation sites (40). In particular, phosphosites were localized at a false localization rate less than 1% using phosphoRS site probability of ≥0.99 and Mascot delta score of ≥10 as shown in Table I.
Sequence motif analysis was performed using the Motif-X software (42). In particular, confidently assigned phosphorylation sites with their surrounding six amino acids to both termini from microparticles and exosomes were considered. A minimum occurrence of 10 and 5 matches was set for consensus sequence identification in the microparticle and exosome data set, respectively.
Gene Ontology analysis was performed using ProteinCenter (Thermo Fisher, Waltham, MA). Venn diagrams were made using BioVenn (http://www.cmbi.ru.nl/cdd/biovenn/).
Ingenuity Pathway Analysis
The quantitative data were analyzed using Ingenuity Pathways Analysis (Ingenuity Systems, www.ingenuity.com) software to find networks involved in cell death and cell signaling. Each protein identifier with the quantitative information was uploaded and mapped to its corresponding object in Ingenuity's Knowledge Base to algorithmically generate molecular networks. In the networks reported below, molecules are represented as nodes, and their relationship is represented as a line. Filled nodes (red or green) represent the proteins identified in the data set and up- or down-regulated, respectively, with the ratio heavy/light SILAC ratio reported below each node. Unfilled nodes represent proteins that are part of the network but that were not identified in this study. Solid lines indicate direct interactions, and dashed lines represent indirect interactions. Moreover Ingenuity Pathways Analysis was used to map the cellular location of the identified proteins.
RESULTS AND DISCUSSION
Pancreatic β-cells have proven to be exceptionally sensitive to the proinflammatory cytokines IL-1β, INFγ, and TNFα compared with the three other cell types in the islets of Langerhans (22). The exposure of β-cells to proinflammatory cytokines accelerates a self-destruction mechanism, which leads to apoptosis. Upon conditions of apoptosis, some cell types have been shown to release microvesicles including hepatocytes (3), endothelial cells (43), and lymphocytes (44). We therefore speculated whether stimulation of β-cells with proinflammatory cytokines would: 1) initiate the release of apoptotic MPs/microvesicles; 2) alter the level of shedding from the plasma membrane, resulting in increased amount of microvesicles; 3) alter the level/content of proteins released in association with the microvesicles; or 4) generate different microvesicles (MPs and exosomes) containing proteins with alterations in their nature and level of post-translational modifications, such as phosphorylation and sialic acid-containing glycosylations.
Cytokines Induce Apoptosis of NHI 6F Tu28 Rat Pancreatic β-Cells
Major physiological changes of β-cells exposed to cytokines are not observed before 24 h after stimulation (45). Previously, it has been described that cocktails consisting of both IL-1β and IFNγ or TNFα would be more effective than IL-1β alone in initiating apoptosis in β-cells. IL-1β alone will only induce dysfunction of the β-cell but not be sufficient for the induction of apoptosis (22). We therefore used the ApopTag kit to fluorescently stain the apoptotic cells after starvation or after stimulation with different combinations of cytokines, using staurosporine as a positive control to identify the most potent apoptotic mixture of cytokines. The results are shown in Fig. 1A. The relative values of apoptosis after 24-h cytokine stimulation are shown in Fig. 1B. The IL-1β-stimulated cells appear very similar to the nonstimulated control cells, whereas the two different cocktails IL-1β/IFNγ or IL-1β/TNFα had both significantly more apoptotic cells. IL-1β/IFNγ produced approximately six times as many apoptotic cells compared with IL-1β, whereas IL-1β/TNFα produced almost 15 times as many apoptotic cells. The mixture containing IL-1β and TNFα therefore seemed to be the most effective apoptotic inducer, although not as effective as the positive control staurosporine. Starvation resulted in a slightly higher apoptosis rate compared with IL-1β only, but much less than the two cocktails. However, in all the experiments the number of apoptotic cells was only a fraction of the total number of cells stained with DAPI. Because of the high rate of apoptosis induced with the IL-1β/TNFα mixture, we chose to use this mixture to induce apoptosis in the β-cells in the following experiments.
Fig. 1.

A, ApopTag images of pancreatic β-cells. The cells were treated as indicated under “Experimental Procedures.” The red cells represent labeled apoptotic cells with DAPI counterstaining of the nuclei. The magnification is 40×. B, relative values of β-cell apoptosis upon different treatments using staurosporine as a positive control. The values are based on death cell counts from 10× magnification images (data not shown) after 24 h of stimulation.
Preparation of Cytokine-stimulated β-Cell-derived Microparticles and Exosomes Using Differential Centrifugation
Previously, the isolation of MPs for proteomic studies has been performed by ultracentrifugation ranging between 100,000 × g and 250,000 × g (11, 46, 47), but this could provide a mixture of the two species of membrane vesicles because the standard protocol for exosome isolation involves centrifugation at 100,000 × g (48), whereas only 20,000 × g is needed for pelleting the MPs (49). Thus, we isolated the two species of microvesicles through sequential centrifugation where the MP fraction was pelleted using 20,000 × g and subsequently the supernatant being centrifuged at 100,000 × g for the pelleting of the exosomes. The isolation efficiency of this approach was confirmed using transmission electron microscopy. Fig. 2 highlights the differences in shape and size of the MPs and exosomes isolated by 20,000 × g and 100,000 × g, respectively. In both the control and in the IL-1β/TNFα-stimulated pancreatic β-cells, both types of microvesicles are clearly present. Exosomes are identified on the basis of their size (40–100 nm) and of their particular cup shape that has previously been described (50–53). MPs are noticeably bigger (200 nm and larger) and more irregular in shape. The isolation of MPs at 20,000 × g will, however, result in the pelleting of some exosomes as observed in the transmission electron microscopy of the control MPs. This could be prevented by lowering the centrifugation speeds and/or the centrifugation time. Both approaches will, however, result in significantly fewer isolated MPs and a risk for contamination by smaller MPs in the exosomal pellet. A fine balance is required for the highly specific isolation, if possible, of the two distinct species of membrane vesicles, providing a future challenge for the field.
Fig. 2.
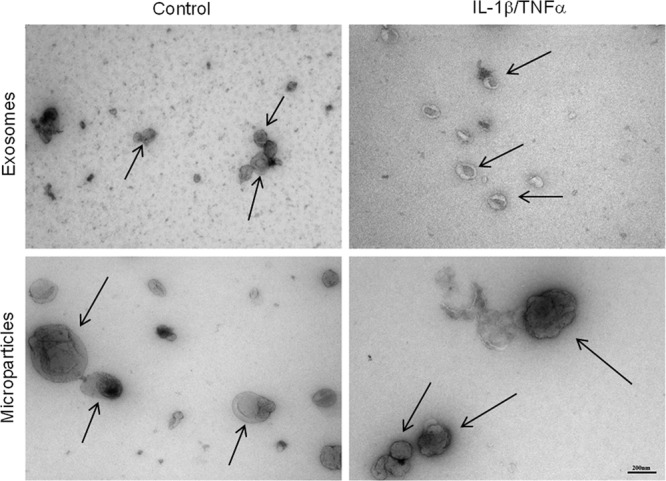
Transmission electron microscopy images of isolated β-cell-derived control and IL-1β/TNFα-stimulated exosomes and MPs. The arrows indicate the two types of microvesicles. The vesicles were fixed in paraformaldehyde and contrasted with uranyl oxalate. The pictures were obtained with 65,000× magnification. The scale bar is 200 nm.
Quantitative Proteomics of Cytokine-stimulated β-Cell-derived Microparticles and Exosomes
For the quantitative studies of microvesicles released from pancreatic β-cells in culture, we utilized SILAC to differentiate microvesicles from nonstimulated and cytokine stimulated β-cells. Fig. 3 illustrates the experimental setup of this study. The conditioned media from the cells were mixed 1:1 (v/v) and differentially centrifuged as described above with 20,000 × g (2 h) to pellet the MPs, and the supernatant was centrifuged at 100,000 × g (2 h) to pellet the exosomes (48, 49).
Fig. 3.

Flow diagram of the strategy used to target the membrane proteins from microparticles and exosomes from control and stimulated β-cells.
Initially, we focused on the identification and quantitation of the whole microvesicle proteomes including trapped cytoplasmic proteins. However, the addition of fetal bovine serum to the medium during growth, to achieve the most optimal growth conditions and elimination of apoptosis as a result of starvation, resulted in large numbers of serum protein identifications, such as serum albumin, immunoglobulins, and fibrinogen (data not shown). The results were not significantly improved by several rounds of washing the vesicles in 1× or 2× PBS buffer. This indicates that microvesicles bind a large number of serum proteins, which is consistent with previous studies where large quantities of serum proteins were found binding to/associating with the microvesicles (11, 54).
Because many of the membrane vesicle-associated proteins are expected to be membrane proteins and because the membrane proteins would presumably have a potential important role in vesicle to cell communication/interaction because of the exterior exposure, we decided to target the membrane proteins and furthermore remove the contaminating serum proteins (Fig. 3). Thus, the isolated microvesicles were treated with sodium carbonate, which results in linearization of the membranes and release of loosely bound proteins from the membranes (36). In addition to analyzing the microvesicle membrane subproteome, we performed TiO2 chromatography of the tryptic peptides originating from the membrane protein fraction to specifically purify phosphorylated peptides and N-linked sialylated glycopeptides (33–34). This was performed first of all to make the proteomics analysis even more specific to the vesicle surfaces, to increase the number of identified proteins from the vesicles, and to direct the analysis to proteins involved in the biological events in vesicles (e.g., interaction, cell-cell communication, and signaling (55)).
Furthermore, it has been shown that after induction of apoptosis of lymphocytes, there is an decrease in the sialic acid content, and the same phenomena was observed on the surface of apoptotic membrane blebs (56). Also, in the last few decades, the glycocalyx has attracted attention, especially in the context of apoptosis and the clearance of apoptotic cells. In addition to well known mediators of apoptotic cell engulfment, such as phosphatidylserine (57), T-cell immunoglobulin and mucin domain-containing molecule 4 (Tim4) (58), or milk fat globule epidermal growth factor 8 (Mfge8) (59), some authors have reported that changes in the glycoprofile influence the phagocytosis of apoptotic cells. Here, among others, galectins (60), C-type lectins (61), CD43 (62), and the asialoglycoprotein receptor (63) are reportedly involved.
Therefore the degree of phagocytosis of apoptotic cells and membrane blebs is related to the glycosylation content on the cell surface. This implies that investigating the modulation of the sugar chains on exosomal surfaces will improve the exosomal marker study.
Identification of Proteins Associated with MP and Exosome Membranes
The tryptic peptides derived from the membrane protein fractions were identified and quantified using high accuracy LC-MS/MS. The resulting lists of proteins identified in the MP and exosome membrane fractions are listed in supplemental Tables 1 and 2, respectively. In total, we identified 401 proteins from the MPs and 191 proteins from the exosomes.
The glyco, phospho, and total proteomes between the two vesicles were compared as shown in Fig. 4 (panels A, B, and C, respectively). We obtained a large overlap of protein content from the two vesicle fractions. There could be several reasons for this finding. Despite optimization of the centrifugation speeds for each individual type of microvesicles, we observed co-sedimentation of the two types of vesicles (Fig. 2). Although their defined postulated sizes do not overlap (exosomes, 40 nm to 100 nm; MPs, 100 nm to 1 μm), their sizes are likely to overlap in vivo. Furthermore, centrifugation is not an accurate isolation technique, and even extensive optimization will most likely not be able to prevent co-pelleting. The overlapping sizes are furthermore indicated by proteins identified from these vesicles by other studies (44). Furthermore, membranes from both MPs and exosomes are thought to originate from lipid rafts (cholesterol-enriched microdomains in cell membranes) and therefore should contain very similar and specific membrane proteins (64, 65). The existence of lipid rafts in the investigated pancreatic β-cell-derived microvesicles is supported by the finding of lipid raft-associated proteins in the microvesicle preparations, such as the glycosylphosphatidylinositol-anchored proteins CD59 and major prion protein (66), Flottilin-1 (65), Fyn (67), and SNARE proteins such as syntaxin-1A, SNAP23, and SNAP25 (68–70). However, the significant number of additional proteins identified in the MP preparation indicated that those membrane vesicles are indeed also created using other compartments of the cellular surface.
Fig. 4.

A, overlap of the identified phosphorylated proteins from exosomes and MPs. B, overlap of the identified N-linked sialylated glycoproteins from exosomes and MPs. C, overlap of the total proteins from exosomes and MPs.
Phosphorylated and N-Linked Sialylated Proteins in MPs and Exosomes
To our knowledge, only one report has been published on modified proteins from microvesicles. Gonzales et al. (71) published the phosphoproteome of urinary exosomes where they identified 14 phosphoproteins and 19 phosphorylation sites, several of them membrane proteins. In this study, we identified 188 sialylated N-glycosylation sites from 104 glycoproteins and 130 phosphorylation sites from 67 phosphoproteins in MPs and 51 sialylated N-glycosylation sites from 38 glycoproteins and 21 phosphorylation sites from 15 phosphoproteins in exosomes, respectively (Table I and supplemental Tables 3 and 4). The enrichment reproducibility from phosphorylated and glycosylated peptides in exosomes and microparticles, across biological replicates, ranged from 64 to 75% and from 70 to 80%, respectively, suggesting TiO2 affinity chromatography as a robust and reproducible technique for selective enrichment of phosphorylated and sialylated peptides derived from microvesicles. It should be noted that the reproducibility for the nonredundant total peptides, defined as the percentage of nonredundant peptides detected at least three times, is 46 and 55%, respectively. This lower reproducibility could be due to the fact that the enrichments were performed three times, whereas the unmodified samples were performed four times. The numbers of reproducibly detected proteins (n ≥ 3) in the exosomes and MPs samples were 128 and 286, respectively, with enrichment efficiency levels of 67 and 71%, respectively. The phosphorylation sites were assigned based on phosphoRS score (40) and Mascot delta score algorithms (41). In particular 94 and 16 phosphorylation sites from MPs and exosomes, respectively, were identified with a false localization rate less than 1%. However, there is little overlap between the phosphoproteins identified by Gonzales et al. and the phosphoproteins identified in the current study, most likely because of the different origin of cells in the two studies and the difference in phosphopeptide enrichment methods. Of both the phosphorylated and sialylated proteins we observed a similar large overlap between the MPs and exosomes (Fig. 4, A and B) as observed with the overall distribution (Fig. 4C), verifying the overlapping purification or origin as discussed above.
Next we asked whether there were any phosphorylation motifs enriched in the data set. We applied the de novo method Motif-X to the surrounding sequences of high confidence phosphorylated serines having a phosphorylation site localization probability of more than 99% in MPs and exosomes data. This resulted in the identification of two significantly overrepresented consensus sequences (supplemental Fig. S2) RXXS and SXE in the MP fraction. In the exosome data, no motifs were identified to be enriched, probably because of the low number of phosphopeptides identified.
The transmembrane domain and signal peptide distribution in exosomes and MPs (supplemental Figs. S3, a and b, and 4, a and b, respectively) show the potential of glycoprotein enrichment for improving the membrane proteome characterization of microvesicles. Furthermore, the fraction enriched for glycosylated proteins from exosomes and MPs samples contains an overrepresentation of proteins localized in the membrane, cell surface, ER and Golgi compartment (supplemental Figs. S3, c and d, and S4, c and d, respectively). Taken together, this evidence confirms the importance of glycoaffinity capture to study the cellular communication targeting membrane proteins in microvesicles.
Overall Protein Composition of Membrane-derived Microvesicles
Proteomics analyses of microvesicles have previously found proteins common to most microvesicles, as well as proteins with specific cellular origins (e.g., platelets, endothelial cell, etc). Whereas exosomes have been more thoroughly investigated (20), the number of proteome studies of MPs is still rather limited (11, 43–44, 46–47, 72–74). It has yet to be discovered whether MPs of different origin have specific proteins in common because investigations of exosomes have revealed that several classes or proteins are commonly found in exosomes (Ref. 75); also see review in Ref. 20). These common exosomal proteins typically include four members of the tetraspanin family (CD9, CD81, CD82, and CD63), markers for lysosome (LAMP1 and LAMP2), chaperones (HSC70 and HSP90), proteins involved in multivesicular body biogenesis (ESCRT proteins, TSG101, Alix), 14-3-3 proteins, integrins, flotillin-1, ubiquitin, annexins, and major histocompatibility complex classes I and II, just to mention a few (see also Table IV in Ref. 20). Independent of the type of sample (total identifications, phosphopeptides, or sialylated glycopeptides), a substantial number of the common exosomal marker proteins were found in this study. They included three of the commonly found four tetraspanin proteins (CD63, CD82, and CD81), LAMP-1 and LAMP-2, ICAM-1, flottilin-1, G-proteins, and Rab proteins. Two proteins involved in multivesicular body biogenesis (PDCD6IP (Alix) and TSG101) were also discovered, strongly indicating the isolation of β-cell-derived exosomes. Furthermore, we found several other vesicle-associated proteins, including a number of proteins being involved in synaptic vesicle transport and vesicular protein trafficking such as transmembrane emp24 domain-containing protein 2, transmembrane emp24 domain-containing protein 10, synaptophysin, syntaxin-1A, SNAP23, SNAP25, VAMP3, synaptic vesicle glycoprotein 2A, and syntenin-1. Several of those have been previously identified in connection with microvesicle studies: VAMP3, syntenin-1, and SNAP23 in microvesicles from human colorectal cancer (76); SNAP23 from platelet-derived microparticles (47); VAMP3 from urinary exosomes (52); syntenin-1 in lymphocyte-derived microparticles (44); SNAP23 and syntenin-1, from urinary microparticles (73); and transmembrane emp24 domain-containing protein 2 and transmembrane emp24 domain-containing protein 10 from rat hepatocyte-derived exosomes (18).
Quantitative Proteomics of Microvesicles Derived from Cytokine-stimulated β-Cells
The quantitative data obtained from the SILAC study are shown in supplemental Tables 1 and 2. When comparing the number of quantifiable proteins based on nonmodified peptides, phosphopeptide, and formerly N-linked sialylated glycopeptides, the majority of the proteins (401 for MPs and 191 for exosomes) are present in equal amounts between the two populations, indicating a high degree of similarity between the microvesicles derived by cellular growth and as a response to apoptosis as shown by the z-score calculation (supplemental Fig. S1). When looking at Fig. 1, it is not surprising because the level of apoptosis after 24 h is not that high. However, a number of proteins were found significantly different between the two populations of microvesicles as shown in the z-score plot (supplemental Fig. S1). The network prediction program Ingenuity Pathways Analysis was used to categorize the proteins that showed alterations into distinct pathways. We have identified several members of the tumor necrosis factor signaling pathway, such as tumor necrosis factor receptor superfamily member 1A, tumor necrosis factor α-induced protein 3, and tumor necrosis factor-interacting kinase receptor-interacting serine-threonine kinase 1. All of these members we found to be up-regulated in the microvesicles originating from the cytokine stimulated cells. The release of TNFR1 into the extracellular space has been described because of the proteolytic cleavage of cell surface receptors and the release of exosome-like vesicles (77, 78). In particular, the TNFR1 up-regulation (see network analysis Fig. 5A and spectrum of the nonmodified peptide SLESGSNFAPLK in Fig. 6A) and tumor necrosis factor α-induced protein 3 (see phosphorylated peptides SLEpSGSNFAPLK in Fig. 6B) in the apoptosis-derived exosomes may modulate TNF-mediated inflammatory or immune events. We therefore speculated whether the cell, by expelling these receptors through the shedding of microvesicles, is attempting to rescue the apoptotic destiny of the cell. A similar function of MPs has been reported by Hussein et al. (79) where the disposing of caspase-3 through the shedding of MPs supports cellular survival.
Fig. 5.

Network analysis of quantitative proteomic data derived from exosomes (A) and MPs (B) from control and stimulated β-cells. Network analysis of cytokine-stimulated β-cell microparticles and exosomes proteome reveals an increase in the levels of TNFR1 (A) and ICAM-1 (B) involved in cell death and cell signaling. The red- and green-filled nodes indicate an up- and down-regulation in cytokine-stimulated β-cells microvesicles. The various shapes of nodes denote the different functions.
Fig. 6.

A, tandem MS/MS spectrum of the peptide SLESGSNFAPLK from tumor necrosis factor receptor superfamily member 1A, identified as significantly “up-regulated” in the exosomes fraction. The MS signals are shown in the inset. B, tandem MS/MS spectrum of the heavy phosphorylated peptide SLEpSGSNFAPLK from tumor necrosis factor α-induced protein 3 identified as significantly “up-regulated” in the exosomes fraction. The MS signals are shown in the inset. C, tandem MSMS spectrum of the sialylated glycopeptide GNETLSR from ICAM-1. The MS signals are shown in the inset.
When investigating the N-linked sialylated glycopeptides identified in both the MPs and the exosomes, we observed an increase of many proteins that could indicate either an increased level of those proteins in the microvesicles or increased sialylation on individual sites. ICAM-1 (see spectrum of glycopeptide GNETLSR in Fig. 6C and network analysis Fig. 5B) was observed with a significant “up-regulation” in MPs. The reason for this rather unique increase is not known. However, cytokine stimulation induces the production of nitric oxide in pancreatic β-cells (22), and increasing the levels of nitric oxide is known to up-regulate ICAM-1 (80). Alternatively, this protein could originate from true apoptotic MPs. One of the typical exosomal markers was also found “up-regulated” in MPs with sialylated glycosylation sites. The tetraspanin CD82 is one of the most typical exosomal markers found in exosome studies (20) and was found to be up-regulated 2-fold. Whether this up-regulation is an indication for an increased number of exosomes/microvesicles, an increased number of CD82 molecules, or perhaps increased sialylation status of the protein is impossible to determine. Several sialyltransferases and glycosyltransferases have been shown to change in abundance as a consequence of cytokine treatment. For example, α2,3-sialyltransferases are increasing upon TNFα treatment (81), and the sialyltransferase ST3Gal IV is increasing upon IL-1β stimulation (28). This change in sialyltranferase will have a direct effect on the level of sialylation of glycopeptides, and this could be in agreement with our observations.
The relative low yield of microvesicles obtained in this study, demonstrated by the large amount of cells that are needed for obtaining a sufficient quantity for further processing, was not expected based on previous studies from plasma. In the present study, we are stimulating fixed cells on surfaces (plate) to release apoptotic induced MPs, whereas MPs from plasma originate mainly from cells in suspension (platelets). One reason for the low yield could be that the surface of MPs and exosomes, which are coated with glycosylated (especially sialylated) membrane proteins, will interact with the plates used for cell growth via interactions through the glycan structures. It is believed that glycosylation of cell surface proteins are participating in cell-cell interaction and communication and cell-surface interactions and that the attachment of cells to plates and surfaces involves the glycan structures of surface proteins. Therefore, the small vesicles that are released from apoptotic cells would interact with the plastic surface of the plate and therefore not be present in the growth medium. This would explain the relative low yield of MPs in this study; however, more experiments will be needed to demonstrate this hypothesis.
Conclusions
We have in this study developed a new strategy for targeting membrane proteins derived from microvesicles originating from β-cells. Using this strategy, we have identified a large number of membrane proteins and membrane-associated proteins in MPs and exosomes from cytokine-stimulated β-cells, strongly indicating that pancreatic β-cells do shed membrane-derived microvesicles both during growth and after cytokine stimulation. The treatment of the isolated microvesicles with sodium carbonate for the linearization and subsequent isolation of the membranes by ultracentrifugation yielded higher specificity toward membrane-protein identification and lower contamination of serum proteins from the conditioned media, which otherwise bind tightly to the vesicles.
Network analysis shows an involvement of TNFR1 and ICAM-1 in mediating cell signaling in cytokine-stimulated microvesicles. On the other hand, the biological function of soluble cytokine receptors in regulating the inflammatory and immune events by functioning as agonists or antagonists of cytokine signaling is not yet fully understood, and these studies will provide new insights into the pathogenesis of this disease.
The novel strategy for targeting microvesicle membrane proteins in this study could form a basis for future studies of membrane-derived microvesicles in the search for biomarker candidates and for a better understanding of the nature of vesicle shedding. In addition, this strategy provides a strong basis for targeting plasma membrane proteins from cells that normally require large amounts of cells and laborious laboratory procedures.
Acknowledgments
We thank Krzysztof Wresinski for assistance with the fluorescence imaging. Lene A. Jakobsen is acknowledged for technical assistance. Kasper Engholm-Keller is acknowledged for assistance in the z-score calculation. We thank the journal reviewer for the valuable feedback for improvement of the manuscript.
Footnotes
* This work was supported by Danish Natural Science Research Council Martin Røssel Larsen Grant 21-030167 and a Danish Strategic Research Council Martin Røssel Larsen Young Investigator Award.
 This article contains supplemental material.
1 The abbreviations used are:
- MP
- microparticle
- MS/MS
- tandem mass spectrometry
- IFN
- interferon
- TNFR1
- tumor necrosis factor receptor superfamily member 1A
- SILAC
- stable isotope labeling of amino acids in cell culture
- ICAM
- intercellular adhesion molecule
- DAPI
- 4′,6′-diamino-2-phenylindole.
REFERENCES
- 1. Wolf P. (1967) The nature and significance of platelet products in human plasma. Br. J. Haematol. 13, 269–288 [DOI] [PubMed] [Google Scholar]
- 2. Jimenez J. J., Jy W., Mauro L. M., Soderland C., Horstman L. L., Ahn Y. S. (2003) Endothelial cells release phenotypically and quantitatively distinct microparticles in activation and apoptosis. Thromb. Res. 109, 175–180 [DOI] [PubMed] [Google Scholar]
- 3. Miyoshi H., Umeshita K., Sakon M., Imajoh-Ohmi S., Fujitani K., Gotoh M., Oiki E., Kambayashi J., Monden M. (1996) Calpain activation in plasma membrane bleb formation during tert-butyl hydroperoxide-induced rat hepatocyte injury. Gastroenterology 110, 1897–1904 [DOI] [PubMed] [Google Scholar]
- 4. Coleman M. L., Sahai E. A., Yeo M., Bosch M., Dewar A., Olson M. F. (2001) Membrane blebbing during apoptosis results from caspase-mediated activation of ROCK I. Nat. Cell Biol. 3, 339–345 [DOI] [PubMed] [Google Scholar]
- 5. Sebbagh M., Renvoizé C., Hamelin J., Riché N., Bertoglio J., Bréard J. (2001) Caspase-3-mediated cleavage of ROCK I induces MLC phosphorylation and apoptotic membrane blebbing. Nat. Cell Biol. 3, 346–352 [DOI] [PubMed] [Google Scholar]
- 6. Hugel B., Martínez M. C., Kunzelmann C., Freyssinet J. M. (2005) Membrane microparticles: Two sides of the coin. Physiology 20, 22–27 [DOI] [PubMed] [Google Scholar]
- 7. VanWijk M. J., VanBavel E., Sturk A., Nieuwland R. (2003) Microparticles in cardiovascular diseases. Cardiovasc. Res. 59, 277–287 [DOI] [PubMed] [Google Scholar]
- 8. Berckmans R. J., Nieuwland R., Böing A. N., Romijn F. P., Hack C. E., Sturk A. (2001) Cell-derived microparticles circulate in healthy humans and support low grade thrombin generation. Thromb. Haemost. 85, 639–646 [PubMed] [Google Scholar]
- 9. Nieuwland R., Berckmans R. J., McGregor S., Böing A. N., Romijn F. P., Westendorp R. G., Hack C. E., Sturk A. (2000) Cellular origin and procoagulant properties of microparticles in meningococcal sepsis. Blood 95, 930–935 [PubMed] [Google Scholar]
- 10. Sabatier F., Darmon P., Hugel B., Combes V., Sanmarco M., Velut J. G., Arnoux D., Charpiot P., Freyssinet J. M., Oliver C., Sampol J., Dignat-George F. (2002) Type 1 and type 2 diabetic patients display different patterns of cellular microparticles. Diabetes 51, 2840–2845 [DOI] [PubMed] [Google Scholar]
- 11. Jin M., Drwal G., Bourgeois T., Saltz J., Wu H. M. (2005) Distinct proteome features of plasma microparticles. Proteomics 5, 1940–1952 [DOI] [PubMed] [Google Scholar]
- 12. Cocucci E., Racchetti G., Meldolesi J. (2009) Shedding microvesicles: Artefacts no more. Trends Cell Biol. 19, 43–51 [DOI] [PubMed] [Google Scholar]
- 13. Trams E. G., Lauter C. J., Salem N., Jr., Heine U. (1981) Exfoliation of membrane ecto-enzymes in the form of micro-vesicles. Biochim. Biophys. Acta 645, 63–70 [DOI] [PubMed] [Google Scholar]
- 14. Johnstone R. M., Adam M., Hammond J. R., Orr L., Turbide C. (1987) Vesicle formation during reticulocyte maturation: Association of plasma membrane activities with released vesicles (exosomes). J. Biol. Chem. 262, 9412–9420 [PubMed] [Google Scholar]
- 15. Pan B. T., Teng K., Wu C., Adam M., Johnstone R. M. (1985) Electron microscopic evidence for externalization of the transferrin receptor in vesicular form in sheep reticulocytes. J. Cell Biol. 101, 942–948 [DOI] [PMC free article] [PubMed] [Google Scholar]
- 16. Heijnen H. F., Schiel A. E., Fijnheer R., Geuze H. J., Sixma J. J. (1999) Activated platelets release two types of membrane vesicles: Microvesicles by surface shedding and exosomes derived from exocytosis of multivesicular bodies and α-granules. Blood 94, 3791–3799 [PubMed] [Google Scholar]
- 17. Théry C., Boussac M., Véron P., Ricciardi-Castagnoli P., Raposo G., Garin J., Amigorena S. (2001) Proteomic analysis of dendritic cell-derived exosomes: A secreted subcellular compartment distinct from apoptotic vesicles. J. Immunol. 166, 7309–7318 [DOI] [PubMed] [Google Scholar]
- 18. Conde-Vancells J., Rodriguez-Suarez E., Gonzalez E., Berisa A., Gil D., Embade N., Valle M., Luka Z., Elortza F., Wagner C., Lu S. C., Mato J. M., Falcon-Perez M. (2010) Candidate biomarkers in exosome-like vesicles purified from rat and mouse urine samples. Proteomics Clin. Appl. 4, 416–425 [DOI] [PMC free article] [PubMed] [Google Scholar]
- 19. Koga K., Matsumoto K., Akiyoshi T., Kubo M., Yamanaka N., Tasaki A., Nakashima H., Nakamura M., Kuroki S., Tanaka M., Katano M. (2005) Purification, characterization and biological significance of tumor-derived exosomes. Anticancer Res. 25, 3703–3707 [PubMed] [Google Scholar]
- 20. Simpson R. J., Jensen S. S., Lim J. W. (2008) Proteomic profiling of exosomes: Current perspectives. Proteomics 8, 4083–4099 [DOI] [PubMed] [Google Scholar]
- 21. Jörns A., Kubat B., Tiedge M., Wedekind D., Hedrich H. J., Klöppel G., Lenzen S. (2004) Pathology of the pancreas and other organs in the diabetic LEW. 1AR1/Ztm-iddm rat, a new model of spontaneous insulin-dependent diabetes mellitus. Virchows Arch. 444, 183–189 [DOI] [PubMed] [Google Scholar]
- 22. Eizirik D. L., Mandrup-Poulsen T. (2001) A choice of death: The signal-transduction of immune-mediated β-cell apoptosis. Diabetologia 44, 2115–2133 [DOI] [PubMed] [Google Scholar]
- 23. Mandrup-Poulsen T. (1996) The role of interleukin-1 in the pathogenesis of IDDM. Diabetologia 39, 1005–1029 [DOI] [PubMed] [Google Scholar]
- 24. Hostens K., Pavlovic D., Zambre Y., Ling Z., Van Schravendijk C., Eizirik D. L., Pipeleers D. G. (1999) Exposure of human islets to cytokines can result in disproportionately elevated proinsulin release. J. Clin. Invest. 104, 67–72 [DOI] [PMC free article] [PubMed] [Google Scholar]
- 25. Pirot P., Eizirik D. L., Cardozo A. K. (2006) Interferon-γ potentiates endoplasmic reticulum stress-induced death by reducing pancreatic β cell defence mechanisms. Diabetologia 49, 1229–1236 [DOI] [PubMed] [Google Scholar]
- 26. Cnop M., Welsh N., Jonas J. C., Jörns A., Lenzen S., Eizirik D. L. (2005) Mechanisms of pancreatic β-cell death in type 1 and type 2 diabete: Many differences, few similarities. Diabetes 54, S97–S107 [DOI] [PubMed] [Google Scholar]
- 27. Mathis D., Vence L., Benoist C. (2001) β-Cell death during progression to diabetes. Nature 414, 792–798 [DOI] [PubMed] [Google Scholar]
- 28. Higai K., Miyazaki N., Azuma Y., Matsumoto K. (2006) Interleukin-1b induces sialyl Lewis X on hepatocellular carcinoma HuH-7 cells via enhanced expression of ST3Gal IV and FUT VI gene. FEBS Lett. 580, 6069–6075 [DOI] [PubMed] [Google Scholar]
- 29. Wogensen L. D., Kolb-Bachofen V., Christensen P., Dinarello C. A., Mandrup-Poulsen T., Martin S., Nerup J. (1990) Functional and morphological effects of interleukin-1β on the perfused rat pancreas. Diabetologia 33, 15–23 [DOI] [PubMed] [Google Scholar]
- 30. Ong S. E., Blagoev B., Kratchmarova I., Kristensen D. B., Steen H., Pandey A., Mann M. (2002) Stable isotope labeling by amino acids in cell culture, SILAC, as a simple and accurate approach to expression proteomics. Mol. Cell. Proteomics 1, 376–386 [DOI] [PubMed] [Google Scholar]
- 31. Zhu H., Pan S., Gu S., Bradbury E. M., Chen X. (2002) Amino acid residue specific stable isotope labeling for quantitative proteomics. Rapid Commun. Mass Spectrom. 16, 2115–2123 [DOI] [PubMed] [Google Scholar]
- 32. Larsen M. R., Thingholm T. E., Jensen O. N., Roepstorff P., Jørgensen T. J. (2005) Highly selective enrichment of phosphorylated peptides from peptide mixtures using titanium dioxide microcolumns. Mol. Cell. Proteomics 4, 873–886 [DOI] [PubMed] [Google Scholar]
- 33. Larsen M. R., Jensen S. S., Jakobsen L. A., Heegaard N. H. (2007) Exploring the sialiome using titanium dioxide chromatography and mass spectrometry. Mol. Cell. Proteomics 6, 1778–1787 [DOI] [PubMed] [Google Scholar]
- 34. Jensen S. S., Larsen M. R. (2007) Evaluation of the impact of some experimental procedures on different phosphopeptide enrichment techniques. Rapid Commun. Mass Spectrom. 21, 3635–3645 [DOI] [PubMed] [Google Scholar]
- 35. Madsen O. D., Andersen L. C., Michelsen B., Owerbach D., Larsson L. I., Lernmark A., Steiner D. F. (1988) Tissue-specific expression of transfected human insulin genes in pluripotent clonal rat insulinoma lines induced during passage in Vivo. Proc. Natl. Acad. Sci. U.S.A. 85, 6652–6656 [DOI] [PMC free article] [PubMed] [Google Scholar]
- 36. Fujiki Y., Hubbard A. L., Fowler S., Lazarow P. B. (1982) Isolation of intracellular membranes by means of sodium carbonate treatment: Application to endoplasmic reticulum. J. Cell Biol. 93, 97–102 [DOI] [PMC free article] [PubMed] [Google Scholar]
- 37. Palmisano G., Lendal S. E., Engholm-Keller K., Leth-Larsen R., Parker B. L., Larsen M. R. (2010) Selective enrichment of sialic acid-containing glycopeptides using titanium dioxide chromatography with analysis by HILIC and mass spectrometry. Nat. Protoc. 5, 1974–1982 [DOI] [PubMed] [Google Scholar]
- 38. Schroeder M. J., Shabanowitz J., Schwartz J. C., Hunt D. F., Coon J. J. (2004) A neutral loss activation method for improved phosphopeptide sequence analysis by quadrupole ion trap mass spectrometry. Anal. Chem. 76, 3590–3598 [DOI] [PubMed] [Google Scholar]
- 39. Toedling J., Skylar O., Krueger T., Fischer J. J., Sperling S., Huber W. (2007) Ringo: An R/Bioconductor package for analyzing ChIP-chip readouts. BMC Bioinformatics 8, 221. [DOI] [PMC free article] [PubMed] [Google Scholar]
- 40. Taus T., Köcher T., Pichler P., Paschke C., Schmidt A., Henrich C., Mechtler K. (2011) Universal and confident phosphorylation site localization using phosphoRS. J. Proteome Res. 10, 5354–5362 [DOI] [PubMed] [Google Scholar]
- 41. Savitski M. M., Lemeer S., Boesche M., Lang M., Mathieson T., Bantscheff M., Kuster B. (2011) Confident phosphorylation site localization using the Mascot Delta Score. Mol. Cell. Proteomics 10.1074/mcp.M110.003830 [DOI] [PMC free article] [PubMed] [Google Scholar]
- 42. Schwartz D., Gygi S. P. (2005) An iterative statistical approach to the identification of protein phosphorylation motifs from large-scale data sets. Nat. Biotechnol. 23, 1391–1398 [DOI] [PubMed] [Google Scholar]
- 43. Peterson D. B., Sander T., Kaul S., Wakim B. T., Halligan B., Twigger S., Pritchard K. A., Jr., Oldham K. T., Ou J. S. (2008) Comparative proteomic analysis of PAI-1 and TNF-α-derived endothelial microparticles. Proteomics 8, 2430–2446 [DOI] [PMC free article] [PubMed] [Google Scholar]
- 44. Miguet L., Pacaud K., Felden C., Hugel B., Martinez M. C., Freyssinet J. M., Herbrecht R., Potier N., van Dorsselaer A., Mauvieux L. (2006) Proteomic analysis of malignant lymphocyte membrane microparticles using double ionization coverage optimization. Proteomics 6, 153–171 [DOI] [PubMed] [Google Scholar]
- 45. D'Hertog W., Overbergh L., Lage K., Ferreira G. B., Maris M., Gysemans C., Flamez D., Cardozo A. K., Van den Bergh G., Schoofs L., Arckens L., Moreau Y., Hansen D. A., Eizirik D. L., Waelkens E., Mathieu C. (2007) Proteomics analysis of cytokine-induced dysfunction and death in insulin-producing INS-1E cells: New insights into the pathways involved. Mol. Cell. Proteomics 6, 2180–2199 [DOI] [PubMed] [Google Scholar]
- 46. Banfi C., Brioschi M., Wait R., Begum S., Gianazza E., Pirillo A., Mussoni L., Tremoli E. (2005) Proteome of endothelial cell-derived procoagulant microparticles. Proteomics 5, 4443–4455 [DOI] [PubMed] [Google Scholar]
- 47. Garcia B. A., Smalley D. M., Cho H., Shabanowitz J., Ley K., Hunt D. F. (2005) The platelet microparticle proteome. J. Proteome Res. 4, 1516–1521 [DOI] [PubMed] [Google Scholar]
- 48. Thery C., Clayton A., Amigorena S., Raposo G. A. (2006) Isolation and characterization of exosomes from cell culture supernatants and biological fluids. P. 3.22.21–23.22.29 in Current Protocols in Cell Biology. John Wiley & Sons, Inc, Hoboken, NJ: [DOI] [PubMed] [Google Scholar]
- 49. Miguet L., Sanglier S., Schaeffer C., Potier N., Mauvieux L., Van Dorsselaer A. (2007) Microparticles: A new tool for plasma membrane subcellular proteomic. Subcell. Biochem. 43, 21–34 [DOI] [PubMed] [Google Scholar]
- 50. Nilsson J., Skog J., Nordstrand A., Baranov V., Mincheva-Nilsson L., Breakefield X. O., Widmark A. (2009) Prostate cancer-derived urine exosomes: A novel approach to biomarkers for prostate cancer. Br. J. Cancer 100, 1603–1607 [DOI] [PMC free article] [PubMed] [Google Scholar]
- 51. Kesimer M., Scull M., Brighton B., DeMaria G., Burns K., O'Neal W., Pickles R. J., Sheehan J. K. (2009) Characterization of exosome-like vesicles released from human tracheobronchial ciliated epithelium: A possible role in innate defense. FASEB J. 23, 1858–1868 [DOI] [PMC free article] [PubMed] [Google Scholar]
- 52. Pisitkun T., Shen R. F., Knepper M. A. (2004) Identification and proteomic profiling of exosomes in human urine. Proc. Natl. Acad. Sci. U.S.A. 101, 13368–13373 [DOI] [PMC free article] [PubMed] [Google Scholar]
- 53. Théry C., Ostrowski M., Segura E. (2009) Membrane vesicles as conveyors of immune responses. Nat. Rev. Immunol. 9, 581–593 [DOI] [PubMed] [Google Scholar]
- 54. Pula G., Perera S., Prokopi M., Sidibe A., Boulanger C. M., Mayr M. (2008) Proteomic analysis of secretory proteins and vesicles in vascular research. Proteomics Clin. Appl. 2, 882–891 [DOI] [PubMed] [Google Scholar]
- 55. Ratajczak J., Wysoczynski M., Hayek F., Janowska-Wieczorek A., Ratajczak M. Z. (2006) Membrane-derived microvesicles: Important and underappreciated mediators of cell-to-cell communication. Leukemia 20, 1487–1495 [DOI] [PubMed] [Google Scholar]
- 56. Meesmann H. M., Fehr E. M., Kierschke S., Herrmann M., Bilyy R., Heyder P., Blank N., Krienke S., Lorenz H. M., Schiller M. (2010) Decrease of sialic acid residues as an eat-me signal on the surface of apoptotic lymphocytes. J. Cell Sci. 123, 3347–3356 [DOI] [PubMed] [Google Scholar]
- 57. Fadok V. A., Bratton D. L., Rose D. M., Pearson A., Ezekewitz R. A., Henson P. M. (2000) A receptor for phosphatidylserine-specific clearance of apoptotic cells. Nature 405, 85–90 [DOI] [PubMed] [Google Scholar]
- 58. Miyanishi M., Tada K., Koike M., Uchiyama Y., Kitamura T., Nagata S. (2007) Identification of Tim4 as a phosphatidylserine receptor. Nature 450, 435–439 [DOI] [PubMed] [Google Scholar]
- 59. Kranich J., Krautler N. J., Heinen E., Polymenidou M., Bridel C., Schildknecht A., Huber C., Kosco-Vilbois M. H., Zinkernagel R., Miele G., Aguzzi A. (2008) Follicular dendritic cells control engulfment of apoptotic bodies by secreting Mfge8. J. Exp. Med. 205, 1293–1302 [DOI] [PMC free article] [PubMed] [Google Scholar]
- 60. Beer A., André S., Kaltner H., Lensch M., Franz S., Sarter K., Schulze C., Gaipl U. S., Kern P., Herrmann M., Gabius H. J. (2008) Human galectins as sensors for apoptosis/necrosis-associated surface changes of granulocytes and lymphocytes. Cytometry A 73, 139–147 [DOI] [PubMed] [Google Scholar]
- 61. Cambi A., Figdor C. G. (2003) Dual function of C-type lectin-like receptors in the immune system. Curr. Opin. Cell Biol. 15, 539–546 [DOI] [PubMed] [Google Scholar]
- 62. van den Berg T. K., Nath D., Ziltener H. J., Vestweber D., Fukuda M., van Die I., Crocker P. R. (2001) Cutting edge: CD43 functions as a T cell counterreceptor for the macrophage adhesion receptor sialoadhesin (Siglec-1). J. Immunol. 166, 3637–3640 [DOI] [PubMed] [Google Scholar]
- 63. Ashwell G., Morell A. G. (1974) The role of surface carbohydrates in the hepatic recognition and transport of circulating glycoproteins. Adv. Enzymol. Relat. Areas Mol. Biol. 41, 99–128 [DOI] [PubMed] [Google Scholar]
- 64. Del Conde I., Shrimpton C. N., Thiagarajan P., López J. A. (2005) Tissue-factor-bearing microvesicles arise from lipid rafts and fuse with activated platelets to initiate coagulation. Blood 106, 1604–1611 [DOI] [PubMed] [Google Scholar]
- 65. de Gassart A., Geminard C., Fevrier B., Raposo G., Vidal M. (2003) Lipid raft-associated protein sorting in exosomes. Blood 102, 4336–4344 [DOI] [PubMed] [Google Scholar]
- 66. Paulick M. G., Bertozzi C. R. (2008) The glycosylphosphatidylinositol anchor: A complex membrane-anchoring structure for proteins. Biochemistry 47, 6991–7000 [DOI] [PMC free article] [PubMed] [Google Scholar]
- 67. Palacios E. H., Weiss A. (2004) Function of the Src-family kinases, Lck and Fyn, in T-cell development and activation. Oncogene 23, 7990–8000 [DOI] [PubMed] [Google Scholar]
- 68. Chamberlain L. H., Burgoyne R. D., Gould G. W. (2001) SNARE proteins are highly enriched in lipid rafts in PC12 cells: Implications for the spatial control of exocytosis. Proc. Natl. Acad. Sci. U.S.A. 98, 5619–5624 [DOI] [PMC free article] [PubMed] [Google Scholar]
- 69. Foster L. J., De Hoog C. L., Mann M. (2003) Unbiased quantitative proteomics of lipid rafts reveals high specificity for signaling factors. Proc. Natl. Acad. Sci. U.S.A. 100, 5813–5818 [DOI] [PMC free article] [PubMed] [Google Scholar]
- 70. Salaün C., Gould G. W., Chamberlain L. H. (2005) The SNARE proteins SNAP-25 and SNAP-23 display different affinities for lipid rafts in PC12 cells: Regulation by distinct cysteine-rich domains. J. Biol. Chem. 280, 1236–1240 [DOI] [PMC free article] [PubMed] [Google Scholar]
- 71. Gonzales P. A., Pisitkun T., Hoffert J. D., Tchapyjnikov D., Star R. A., Kleta R., Wang N. S., Knepper M. A. (2009) Large-scale proteomics and phosphoproteomics of urinary exosomes. J. Am. Soc. Nephrol. 20, 363–379 [DOI] [PMC free article] [PubMed] [Google Scholar]
- 72. Sander T. L., Ou J. S., Densmore J. C., Kaul S., Matus I., Twigger S., Halligan B., Greene A. S., Pritchard K. A., Oldham K. T. (2008) Protein composition of plasminogen activator inhibitor type 1-derived endothelial micorparticles. Shock 29, 504–511 [DOI] [PubMed] [Google Scholar]
- 73. Smalley D. M., Sheman N. E., Nelson K., Theodorescu D. (2008) Isolation and identification of potential urinary microparticle biomarkers of bladder cancer. J. Proteome Res. 7, 2088–2096 [DOI] [PubMed] [Google Scholar]
- 74. Choi D. S., Park J. O., Jang S. C., Yoon Y. J., Jung J. W., Choi D. Y., Kim J. W., Kang J. S., Park J., Hwang D., Lee K. H., Park S. H., Kim Y. K., Desiderio D. M., Kim K. P., Gho Y. S. (2011) Proteomic analysis of microvesicles derived from human colorectal cancer ascites. Proteomics 11, 2745–2751 [DOI] [PubMed] [Google Scholar]
- 75. Théry C., Zitvogel L., Amigorena S. (2002) Exosomes: Composition, biogenesis and function. Nat. Rev. Immunol. 2, 569–579 [DOI] [PubMed] [Google Scholar]
- 76. Choi D. S., Lee J. M., Park G. W., Lim H. W., Bang J. Y., Kim Y. K., Kwon K. H., Kwon H. J., Kim K. P., Gho Y. S. (2007) Proteomic analysis of microvesicles derived from human colorectal cancer cells. J. Proteome Res. 6, 4646–4655 [DOI] [PubMed] [Google Scholar]
- 77. Hawari F. I., Rouhani F. N., Cui X., Yu Z. X., Buckley C., Kaler M., Levine S. J. (2004) Release of full-length 55-kDa TNF receptor 1 in exosome-like vesicles: A mechanism for generation of soluble cytokine receptors. Proc. Natl. Acad. Sci. U.S.A. 101, 1297–1302 [DOI] [PMC free article] [PubMed] [Google Scholar]
- 78. Schall T. J., Lewis M., Koller K. J., Lee A., Rice G. C., Wong G. H., Gatanaga T., Granger G. A., Lentz R., Raab H. (1990) Molecular cloning and expression of a receptor for human tumor necrosis factor. Cell 61, 361–370 [DOI] [PubMed] [Google Scholar]
- 79. Abid Hussein M. N., Böing A. N., Sturk A., Hau C. M., Nieuwland R. (2007) Inhibition of microparticle release triggers endothelial cell apoptosis and detachment. Thromb. Haemost. 98, 1096–1107 [DOI] [PubMed] [Google Scholar]
- 80. Radisavljevic Z., Avraham H., Avraham S. (2000) Vascular endothelial growth factor up-regulates ICAM-1 expression via the phosphatidylinositol 3 OH-kinase/AKT/nitric oxide pathway and modulates migration of brain microvascular endothelial cells. J. Biol. Chem. 275, 20770–20774 [DOI] [PubMed] [Google Scholar]
- 81. Delmotte P., Degroote S., Lafitte J. J., Lamblin G., Perini J. M., Roussel P. (2002) Tumor necrosis factor α increases the expression of glycosyltransferases and sulfotransferases responsible for the biosynthesis of sialylated and/or sulfated Lewis x epitopes in the human bronchial mucosa. J. Biol. Chem. 277, 424–431 [DOI] [PubMed] [Google Scholar]