

Abstract
Peptide identification using tandem mass spectrometry is a core technology in proteomics. Latest generations of mass spectrometry instruments enable the use of electron transfer dissociation (ETD) to complement collision induced dissociation (CID) for peptide fragmentation. However, a critical limitation to the use of ETD has been optimal database search software. Percolator is a post-search algorithm, which uses semi-supervised machine learning to improve the rate of peptide spectrum identifications (PSMs) together with providing reliable significance measures. We have previously interfaced the Mascot search engine with Percolator and demonstrated sensitivity and specificity benefits with CID data. Here, we report recent developments in the Mascot Percolator V2.0 software including an improved feature calculator and support for a wider range of ion series. The updated software is applied to the analysis of several CID and ETD fragmented peptide data sets. This version of Mascot Percolator increases the number of CID PSMs by up to 80% and ETD PSMs by up to 60% at a 0.01 q-value (1% false discovery rate) threshold over a standard Mascot search, notably recovering PSMs from high charge state precursor ions. The greatly increased number of PSMs and peptide coverage afforded by Mascot Percolator has enabled a fuller assessment of CID/ETD complementarity to be performed. Using a data set of CID and ETcaD spectral pairs, we find that at a 1% false discovery rate, the overlap in peptide identifications by CID and ETD is 83%, which is significantly higher than that obtained using either stand-alone Mascot (69%) or OMSSA (39%). We conclude that Mascot Percolator is a highly sensitive and accurate post-search algorithm for peptide identification and allows direct comparison of peptide identifications using multiple alternative fragmentation techniques.
Collision induced dissociation (CID)1 is the most common fragmentation technique used in tandem mass spectrometry (MS/MS) proteomics experiments. However, there has recently been a significant rise in the number of proteomics studies using electron transfer dissociation (ETD) fragmentation and electron capture dissociation (ECD) (1, 4–6). These alternative fragmentation techniques can be advantageous for the identification and localization of labile modifications such as phosphorylation (7–12), as well as sampling peptides that are not readily identified through CID fragmentation (5).
There are several factors to consider when interpreting ETD fragmented data. The first is that ETD produces different ion series to CID, electron transfer from the radical anion reagent to the cation peptides results in predominantly c/c – 1, z/z + 1, and to a lesser extent, y and a + 1 ions (13, 14). Moreover, the interfering effects of basic residues that influence protonation and direct dissociation to specific sites along the peptide backbone in CID fragmentation are not commonly observed with ETD fragmentation. Consequently, ETD spectra demonstrate less bias in fragmentation site preference displaying a more distributed fragment intensity across the m/z range that encompasses an extended range of fragment ions (15). ETD spectra are also free from many of the dominating neutral loss peaks (from labile PTMs) that commonly feature in CID. Optimal ETD fragmentation has been observed for low m/z precursors that correspond to higher charge peptides. Consequently, ETD can produce fragment ions of a higher charge state than would normally be considered in traditional trypsin based shotgun proteomics experiments. This characteristic is a major limitation for many mainstream search engines, which are capped to using a maximum of only the doubly charged fragment ions. Moreover, other ETD specific features, such as charge-reduced precursor peaks and ETD/ECD neutral losses, are not generally taken into consideration in search engines, and are usually removed as part of spectral processing.
Commonly used database search engines for tandem MS have been developed and adapted for CID based sequencing. Several studies have evaluated popular search algorithms such as Mascot (16), The Open Mass Spectrometry Search Algorithm (OMSSA) (17), Spectrum Mill (Agilent), and X!Tandem (18), using ETD data and demonstrated Mascot performance is near the top of the group (19–21). These studies also reveal the variability between different search algorithms is much greater for ETD fragmented data than for CID fragmented data, suggesting that comprehensive analysis of these data sets would require multiple search algorithms. In particular, a charge state bias has been highlighted, resulting in large differences in numbers of significant doubly charged peptide identifications. These observations have led to the development of ETD specific search algorithms and scoring functions that leverage features specific to ETD fragmentation (22–25).
Protein Prospector (26) has been optimized for ETD data analysis, it uses an ion type weighting based on the precursor charge state and peptide sequence composition. These alterations to the scoring regime were shown to give considerable increase in the numbers of PSMs at a 1% FDR compared with standard search algorithms (22). OMSSA is another commonly used search tool for ETD data, it offers a large set of configurable search parameters some of which can be advantageous when examining ETD data (17). These parameters include the ability to increase the maximum fragment charge considered above 2+, a constraint of many other search algorithms including Mascot. This has lead to OMSSA being the search tool of choice in several ETD studies (20, 27). Notably, its been reported that OMSSA also suffers from a few restrictions itself including a limit of up to 3 missed cleavages and difficulties matching spectra from 2+ precursors when searching ETD data (19).
Sound scoring methods underpin sequence database search algorithms and are imperative for sensitive and accurate peptide and protein identification from proteomics data. Percolator (2) is a post-search statistical rescoring tool that uses semi-supervised machine learning to iteratively train using features from target and decoy database searches, and rescore peptide spectrum matches (PSMs) using q-values and posterior error probabilities (PEPs).
Standard FDR calculations generally correlate negatively with but are not necessarily a monotonically decreasing function of the identification score. As a consequence, two different scores could have the same FDR. In some situations this would mean that a more relaxed scoring threshold returns a lower FDR, but this problem can be avoided by using q-values (28). A q-value is defined as the minimal FDR threshold at which a particular spectral identification can be made. Percolator also calculates posterior error probabilities (PEPs) for each PSM, sometimes referred to as “local FDR,” which represent the probability that a particular PSM is incorrect. It is worth noting that in this study we also examine the numbers of unique peptide and protein identifications made by Mascot Percolator, and that as we move from PSMs to peptides and then to proteins the size of the data set changes and so does the FDR (29). Although we do not recalculate the FDR at the peptide level we do so at the protein level after clustering proteins by the peptides they match and assigning both target and decoy protein clusters scores.
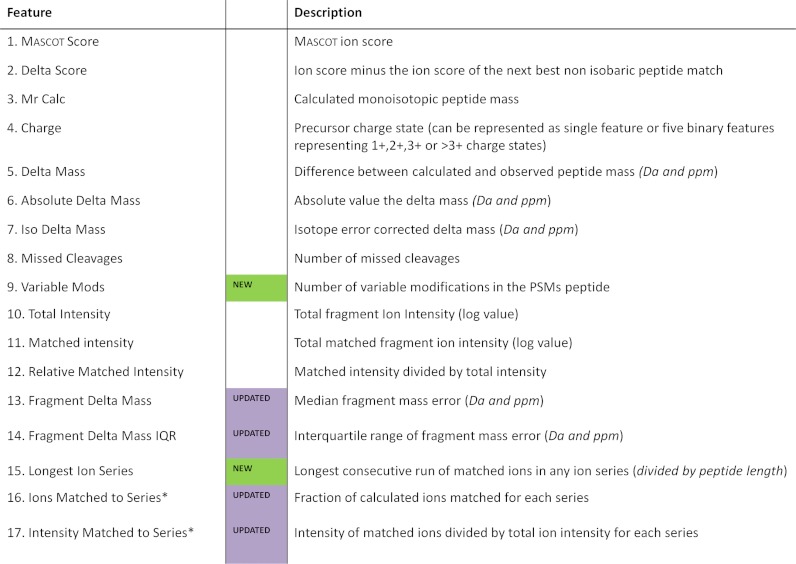
Mascot Percolator (3) made the Percolator algorithm compatible with the popular search engine Mascot. We implemented it as a standalone interface that extracts and computes relevant features from Mascot search results, trains Percolator, applies the resulting statistical score to each PSM and writes a results file. Our evaluation of its performance with several LC-MS/MS data sets demonstrated vast, consistent improvements in the identification of high confidence PSMs over the standard Mascot scoring of CID spectra in both low and high resolution data (3). Subsequently, Percolator has been incorporated into the core Mascot v2.3 software, although our standalone version of Mascot Percolator used in this study is also available on the Wellcome Trust Sanger Institutes website (http://www.sanger.ac.uk/resources/software/mascotpercolator/). Table I shows a summary of the current features used, several of which have changed or been updated since the original Mascot Percolator publication (3). Most significantly, as of version 1.10 of Mascot Percolator, we have enabled the inclusion of variable peptide modifications and removed restriction to b and y ion features instead any ion series used in Mascot is now compatible with Mascot Percolator. The adjusted feature calculation thereby extends Mascot Percolator compatibility to other fragmentation data such as ETD.
Table I. Mascot Percolator Features—A list of the extended features used in Mascot Percolator v2 to train Percolator support vector machines. A set of features is calculated for each PSM in both the target and decoy searches. New and updated features are highlighted.
*These features occur for each ion series considered in the original Mascot search.
Here we benchmark the new version of Mascot Percolator and validate its FDR estimations using CID and ETcaD data obtained from universal protein standards (UPS). Then using a large collection of publicly available yeast data, we evaluate the sensitivity and selectivity performance of Mascot Percolator with ETD and ETcaD data, against both Mascot and OMSSA. A detailed assessment of Mascot Percolator's performance using in-house E.Coli data sets was conducted examining the two different fragmentation methods using parallel and sequential experimental workflows, described Fig. 1. The parallel experiments allow us to evaluate CID and ETD/ETcaD fragmentation as standalone techniques, whereas the sequential experiments enable direct comparison of fragmentation methods at the peptide level. In addition to low resolution ion trap fragmentation data, we also evaluate FT-ETcaD experiments in which high resolution MS/MS spectra are acquired. Overall, using a range of CID and ETD data sets we demonstrate substantial increase in the number of peptide spectrum matches (PSMs) using Mascot Percolator.
Fig. 1.

Experimental setups—Experimental setups for combinations of CID and ETD fragmentation. Parallel experiments use only one fragmentation method, sequential experiments collect both CID and ETD fragmented spectra for each precursor. A third type known as decision tree experiments can use a logic tree to select CID or ETD fragmentation for each precursor ion.
EXPERIMENTAL PROCEDURES
Data Sets
1: Solution digests of human universal proteomics standard (UPS) (Cat# UPS1, Sigma). The UPS sample was denatured with 8 m Urea, reduced with TCEP, alkylated using Iodoacetamide and then adjusted to a final concentration of 1.5 m Urea/100 mm ammonium bicarbonate and digested for 6 h using 1:20 ratio of trypsin sequencing grade (Roche, Indianapolis, IN) at 37 °C.
2: Yeast raw data was downloaded from PeptideAtlas (30) (PAe001453). This data was originally published by Swaney et al. at the University of Wisconsin (27). Data were collected from 12 SCX fractions analyzed over a 40 min gradient on a modified hybrid linear ion trap-Orbitrap (Thermo Scientific). We used two of the available Yeast data sets from PeptideAtlas, ETD (Trial 2, BioRep 2) and ETcaD (Single Trial).
3: E. coli solution tryptic digest (sPREP E. coli Digestion Standard (pre-digested) cat# 186003196; Waters, Milford, MA).
4: E. coli partial tryptic digest. E. coli whole cell lysate (cat# ab2431, from Abcam, Cambridge, MA) was denatured with 8 m Urea, reduced with dithiothreitol, adjusted to a final concentration of 1.5 m Urea/100 mm ammonium bicarbonate and digested for 90 min using 1:20 ratio of trypsin Gold (Promega, Madison, WI) at 37 °C.
Mass Spectrometry
The UPS and E. coli data sets were analyzed by LC-MS/MS using a dual pressure linear ion trap orbitrap instrument capable of both CID and ETcaD fragmentation. Two types of experimental workflow were used in the acquisition of data (Fig. 1). Parallel experiments used a single fragmentation method with standard data dependant acquisition, fragmenting and collecting spectra for the top 10 most abundant precursor ions in MS1 scans. The sequential experiments used the same selection criteria for fragmentation; however, the instrument switched between CID and ETcaD fragmentation to collect both types of spectra for each precursor selected. Supplementary activation (ETcaD) was used for all in-house ETD experiments (31) and LC gradients of 60 and 120 mins were used. Peptide samples were analyzed online using an Ultimate 3000 Nano/Capillary LC System (Dionex, Sunnyvale, CA) coupled to an LTQ Orbitrap Velos hybrid mass spectrometer (Thermo Scientific, West Palm Beach, FL) equipped with a nanospray ion source. Peptides were desalted on-line at a flow rate of 25 μl/min using a micro-Precolumn cartridge (C18 Pepmap 100, LC Packings) and then separated using a RP gradient (4–32% acetonitrile/0.1% formic acid) on a BEH C18 analytical column (1.7 μm, 75 μm id x 10 cm, Waters) at a flow rate of 0.3 μl/min. The mass spectrometer was operated in standard data dependent acquisition mode controlled by Xcalibur 2.1. The instrument was operated with a cycle of one MS (in the Orbitrap) acquired at a resolution of 60,000 at m/z 400, with the top 10 most abundant multiply charged (2+ and higher) ions in a given chromatographic window were subjected to either CID or ETcaD fragmentation in the linear ion trap. An FTMS target value of 1e6 and an ion trap MSn target value of 1e4 were used. Dynamic exclusion was enabled with a repeat duration of 45s with an exclusion list of 500 and exclusion duration of 30s. For FT-ETcaD experiments, MS/MS spectra were collected at a resolution of 15,000 in the Orbitrap with a target value of 1e5.
All raw MS data files were processed and converted into MGF file format using Proteome Discoverer 1.1 (Thermo Scientific). A precursor filter of 600–10,000 Da was applied to in-house data and a nonfragment filter was applied to in-house ETcaD spectra to remove unreacted precursor peaks, charged reduced precursor peaks, neutral losses from charge reduced precursors and FT Overtones using default settings. All ion trap spectra with less than 15 fragmentation peaks and FT spectra with less than 10 fragmentation peaks were removed and a signal to noise filter of three was applied to all spectra. MS data and Mascot search result files were converted to PRIDE XML files using PRIDE Converter v2.5.0 (32) and uploaded to the PRIDE database (http://www.ebi.ac.uk/pride/) with accession numbers 18989–18991 and 19000–19004.
Database Searching Mascot, Mascot Percolator, OMSSA, and Protein Prospector
All data sets were searched using Mascot v2.2 (Matrix Science, Boston, MA). For the sequential experiments, CID and ETD/ETcaD spectra were processed and searched separately. ETD/ETcaD spectra were searched using c, z, and y ion series and CID data was searched using b and y ion series. All searches used Mascot's automated decoy database searching. Table II details the specific search parameters applied to each data set. The Mascot search logs were further processed using our new Mascot Percolator implementation v2.0 (http://www.sanger.ac.uk/resources/software/mascotpercolator/) together with Percolator v1.14 (https://github.com/percolator/percolator) using the full set of features as described in Table I. Only top ranked hits were reported.
Table II. Summary of Search Parameters—The search parameters used for each data set for Mascot, OMSSA and Mascot Percolator.
*The Yeast ORF was not available for use with Protein Prospector hence the SwissProt database was used with S. Cerevisiae taxonomy for that analysis.
**For the bipartite database only selected human IPI sequences were used, combined with 500 shuffled entrapment proteins.

All data sets were also searched using a local install of OMSSA (http://pubchem.ncbi.nlm.nih.gov/omssa/). The majority of OMSSA settings were kept the same as used for Mascot. However, precursor search tolerance was set to 1.5 Da and the results were filtered post search to within a 10ppm tolerance. Target and decoy searches were conducted against separate decoy databases generated using the Mascot decoy database Perl script. Only the top ranked hit for each spectrum was considered in the final results. All data was parsed and assigned q-values based on the decoy search results to allow comparisons between the different scoring algorithms, using homology scoring in Mascot and p values in OMSSA. Finally the two Yeast data sets were searched using the Protein Prospector v5.9.0 Batch-Tag Web tool (http://prospector2.ucsf.edu/prospector/mshome.htm) against the SwissProt (Release 11.01.2011) using the same search parameters as shown in Table II. The results of these searches were exported in a tab delimited format and q-value calculated in the same manner as for the other search algorithms. We report all the results at a PSM q-value threshold of 0.01. Protein clustering was conducted using an in-house tool that initially filters the target and decoy PSMs at a 0.01 q-value threshold to generate a list of significant peptides. The target and decoy proteins to which these peptides match are then iteratively clustered so that every cluster has at least one unique peptide sequence. Each protein cluster is assigned a score by multiplying together the p values (or PEP scores for Mascot Percolator) of constituent peptides. The target and decoy protein clusters are then used to estimate a 1% FDR threshold for the protein cluster scores.
RESULTS AND DISCUSSION
Improvements to Mascot Percolator
Since its original publication Mascot Percolator (3) has undergone several updates to improve and extend functionality, as well as to remain compatible with new releases of Percolator (33) up to version 1.14. Table I details each of the features used by the current version of Mascot Percolator in the rescoring of PSMs. It is difficult to assess the contribution of individual features to the training. Features are selected based on their discrimination between target and decoy PSMs without introducing bias toward any particular type of peptide. The binomial score and sequence coverage features are no longer used and have been removed. These have been replaced with a single feature representing the longest matched consecutive series of ions as a fraction of the peptide length, which is more appropriate when considering multiple ion series. To take account of heavily modified PSMs, a feature representing the number of variable modifications in each spectral assignment has been added. The median and interquartile range (IQR), are used for the fragment mass error features instead of the mean error (the absolute mean fragment error feature has also been removed). These alternative statistics are more robust than using a mean and are less biased by a single accurate fragment match or a single high error fragment match. An internal filter, which can be deactivated for high resolution fragment data, also removes spectra with very low numbers of peaks, less than 15, as these low quality spectra can affect Percolator's training. Finally, as mentioned previously, the fraction of ions matched and relative intensity matched per series has been opened up to included all ion series available for searching in Mascot.
To ensure the improved feature set is not biased toward either target or decoy PSMs, a universal human protein standard mix of 48 proteins was analyzed using both CID and ETcaD in separate experiments, allowing the validation of q-values. The numbers of spectra, peptides and proteins identified from a search of the entire human IPI database are shown in Table IIIA. Mascot Percolator identified 80% more CID spectra and 47% more ETcaD spectra than Mascot alone using a q-value threshold of 0.01. This corresponds to an increase of spectra identified from 17% to 31% for the CID experiments and from 24% to 36% for the ETcaD experiments. The significant peptides were then clustered into unique protein clusters for both the target and decoy search results and then filtered to a protein level FDR of 1%. Mascot Percolator generated 73 CID protein clusters and 66 ETcaD protein clusters, a 16% increase for both CID and ETcaD over Mascot. Manual examination of these protein clusters shows that at this 1% FDR threshold 46 of the 48 proteins in the standard have been identified for both the CID and ETcaD experiments, the other clusters either corresponded to different isoforms of the 48 proteins or a set of contaminant proteins that were observed in multiple experiments. A full list of these proteins is available in supplementary materials.
Table III. Search Results for UPS1 and Yeast—These Tables show the number of PSMs at a 0.01 q-value threshold and their percentage coverage of the data set. The PSMs at this same threshold matched to 3+ or greater charged spectra. The number of unique peptide sequences identified by PSMs at this threshold and finally the number of unique protein clusters at a 1% protein level FDR. The colored bars below OMSSA and Mascot results show the increase achieved with Mascot Percolator.
(A) The search results for an in-house tryptically digested UPS1 CID and ETcaD experiments. (B) The search results for a downloaded PeptideAtlas Yeast LysC digested ETD and ETcaD data sets. *The number in brackets represents the number of UPS1 proteins identified at a 1% protein FDR.

To complete the validation, spectra from these UPS experiments were then searched against a bipartite database (34) containing only the IPI sequences for the 48 proteins in the standard, plus common contaminates. These selected sequences are concatenated with 10 times that number of shuffled entrapment protein sequences. The resulting PSMs from this database were filtered and hits to the entrapment proteins used to estimate false positives over a range of Mascot Percolator q-values. Fig. 2 depicts the plotted q-value and FDR estimates from Mascot Percolator for both the CID and ETcaD UPS data on a log scale. Employing a two-sample Kolmogorov-Smirnov (K-S) test to the bipartite database FDR estimates and the Mascot Percolator q-values, we achieve a maximum difference of 0.02 for the CID data and 0.13 for the ETcaD data. The slightly higher value for the ETcaD data is likely because of the much smaller data set size, also if we examine the plot in Fig. 2 we can see that the majority of the difference between the estimated FDR and Mascot Percolator's q-values is for PSMs below the typical 1% false discovery rate threshold. If we perform the K-S test on the same CID data processed using Mascot Percolator v1.09 the maximum difference is 0.03, reflective of a consistent performance between the different versions. This comparison cannot be done for the ETD data as that version of the software could only generate features for b and y ion series.
Fig. 2.

False discovery rate validation—Two statistical analyses to evaluated the accuracy of values reported by Mascot Percolator. A, This log based graph plots the reported q-values from Mascot Percolator against the FDR estimated from a bipartite database search. Both the CID and ETcaD data sets show good consistency between the estimated FDR and p values with the majority of deviation from y = x occurring below the 0.01 p value threshold. The dotted lines represent y = 2x and y = x/2. B, This is a QQ plot of the observed Mascot Percolator null value (entrapment PSM) p values against a theoretical uniform p value distribution.
The second part of Fig. 2 is a quantile–quantile (QQ) plot of the p value scores, obtained using Mascot Percolator, which is a reliable method for calibrating scoring functions (35). In this QQ plot we have plotted the observed Mascot Percolator p values of the entrapment PSMs from the bipartite database against a uniform theoretical set of p values. Using the K-S test these distributions produce a maximum difference of 0.4 for CID and 0.5 for ETcaD, this compares to a maximum difference of 0.7 for the CID data when using Mascot Percolator v1.09. Although it can be noted form the QQ plot that this is always toward a more conservative p value.
Overall, this analysis demonstrates that the performance Mascot Percolator v2.0 with the improved feature set is similar if not an improvement on previous versions when analyzing CID data. At a 0.01 q-value threshold the difference between the original and new versions of Mascot Percolator for CID spectra is less than 1 and 3% at a 0.01 PEP threshold. Importantly, the sensitivity and specificity performance benefits originally described for CID data is similar to that observed using ETD/ETcaD data in the new implementation described here. Mascot Percolator is directly applicable to all fragmentation methods supported by Mascot, and offers a robust statistical scoring method for all data sets.
Evaluating Mascot Percolator for ETD Data
Two LysC digested Yeast experimental ETD and ETcaD data sets generated by the Coon Research Group to optimize the decision tree protocol (27) were chosen because of their previous detailed analysis using OMSSA and large size, having more than 50,000 spectra in each set. The principle difference between the two data sets is that in the ETcaD set, supplemental activation was employed to improve ETD fragmentation efficiency for doubly charged precursor ions (31). This is the only ETD data set we present in this study that does not use supplemental activation. The corresponding raw MS files were processed using Proteome Discoverer rather than COMPASS (36), as reported in the original publication. A fractional difference of 502 and 18 spectra is observed for the ETD and ETcaD data sets because of the different processing methods. A summary of the results obtained at a PSM q-value threshold of 0.01 for each search method is shown in Table 3B. At this high confidence threshold Mascot identifies 20 and 25% of the total spectra for the ETD and ETcaD data sets; the data set coverage is slightly lower for OMSSA, identifying 17 and 18% of spectra respectively. Further processing of the Mascot search results using Mascot Percolator increases the percentage of spectra identified to 32 and 35% respectively, resulting in an average gain in the number of PSMs of 50% across the two experiments. The q-value PSM plots displayed in Fig. 3 highlight the observed performances from OMSSA, Mascot, and Mascot Percolator. Detailed inspection of individual precursor charge state q-value PSM plots shown in Fig. 3 indicate that Mascot outperforms OMSSA at lower charge states, but at higher charge states OMSSA performs better. Notably, Mascot Percolator shows gains over the stand alone search methods at all charge states, resulting in a rise in ETD (ETcaD) PSMs, for 2+, 3+, and >3+ precursors, of 2311 (1760), 2096 (1828), and 2632 (2519) over Mascot and 3436 (4570), 3750 (3402), and 2092 (2044) over OMSSA at a q-value threshold of 0.01. For both the ETD and ETcaD data sets only 32 doubly charged peptides are identified with OMSSA, a low identification rate for doubly charged spectra when conducting an ETD search has been previously documented as a limitation of the engine (19). Finally, these plots show that the use of supplemental activation substantially enhances identification of 2+ charge PSMs significantly increasing the identification rate with Mascot and Mascot Percolator, this trend is not noticeable for 3+ or greater charged PSMs. In the original publication of this data, 12,193 and 11,470 PSMs are reported for the ETD and ETcaD data sets at a 1% false positive rate (27). Mascot Percolator shows an increase of 59 and 77% in the number of PSMs over those originally reported.
Fig. 3.

Yeast peptide spectrum match q-p plots—These four q-value PSM plots display the estimated number of correct PSMs for the Yeast ETD and ETcaD data sets using Mascot, OMSSA, and Mascot Percolator across a range of q-value thresholds. Plot A, shows all the complete data set and plots B, C, and D, show the estimated correct PSMs for 2+, 3+, and >3+ precursor charge states.
At the peptide level, large gains of 48% in the ETD and 34% in the ETcaD data sets for Mascot Percolator over the original Mascot search are again noted (Table 3B). The prominent gain in the standard ETD experiment can be attributed to the lower number of doubly charged peptides in this data. The number of unique 2+ peptides identified from the ETD data increases from 818 for Mascot to 2479 for Mascot Percolator, similarly for the ETcaD data it increases from 2065 to 3162. This represents an increase of 203% for ETD and 53% for the ETcaD; when compared with unique peptides >2+ the improvement remains more consistent at 30% for the ETD and 28% for the ETcaD. The Venn diagrams in Figure 4 show that Mascot Percolator boosts the significance of unique peptides that were significant in the OMSSA search but not the Mascot search, including many peptides at higher charge states. Moreover, Mascot Percolator gives confidence to a large number of unique peptides that are not reported as significant in either of the stand alone searches at this q-value threshold. Less than 1.4% of the total unique peptide identifications at a 0.01 q-value threshold across the three different analysis tools are not significant in the Mascot Percolator results; it is noticeable that these are only observed by one of the search engines. The number of protein clusters identified at a cluster level FDR of 1% increases from 1176 in the ETD data and 1183 in the ETcaD data for OMSSA to 1264 in the ETD data and 1300 in the ETcaD data for Mascot and then up to 1574 in the ETD data and 1611 in the ETcaD data for Mascot Percolator. This corresponds to an increase of 25 and 24% for the ETD and ETcaD data sets, respectively. This implies that greater proteome coverage can be achieved with fewer experiments using Mascot Percolator.
Fig. 4.

Yeast unique peptide venn plots—The overlap in unique peptides identified between Mascot, OMSSA, and Mascot Percolator at a PSM q-value threshold of 0.01 for the Yeast ETD and ETcaD data sets. These Venn plots are not drawn to scale.
Next we compared the performance of Mascot Percolator to the Protein Prospector web tool using the same Yeast ETD data. Protein Prospector has some specific scoring features that have been previously shown to increase significant ETD PSMs by up to 80% (22). The Yeast data was researched using a SwissProt database (with S. Cerevisiae taxonomy) because of database restrictions in Protein Prospector. The results from Protein Prospector and an equivalent search using Mascot and Mascot Percolator against the SwissProt database can be found in the supplemental information. The gain in PSMs when using Mascot Percolator is more modest when compared with Protein Prospector than that of Mascot and OMSSA, however, it does provide 28 and 20% more significant PSMs for the Yeast ETD and ETcaD data sets. These results clearly demonstrate the significant gains in PSM and peptide identification that can be made using Mascot Percolator as compared with other database searches methods even those with ETD specific features.
Comparing Mascot Percolator Performance across CID and ETD Experiments
Mascot Percolator was also used to process in-house LTQ Orbitrap Velos data from full and partial tryptic digests of E. coli. This instrument can be directed to switch between CID and ETcaD enabling a detailed assessment of Mascot Percolator's performance across the two fragmentation methods. All ETD data collected for this analysis was with supplemental activation.
Initially, we analyzed a full tryptic digest in parallel CID and ETcaD experiments (Table IVA). Mascot significantly identified 39 and 40% of the collected CID and ETcaD spectra and this increased to 49% coverage for the CID spectra and 53% coverage for the ETcaD spectra with Mascot Percolator. OMSSA performs at a very similar level to Mascot for the CID experiments; however, for the ETcaD experiments only 14% of the spectra are identified, a large decrease in performance compared with Mascot. Closer examination of the spectra based on precursor charge states reveals that 84% of the spectra in this data set are doubly charged, again highlighting this to be a problem for OMSSA when searching ETD/ETcaD data (19).
Table IV. Search Results for E. Coli Experiments—These Tables show the number of PSMs at a 0.01 q-value threshold and their percentage coverage of the data set. The PSMs at this same threshold matched to 3+ or greater charged spectra. The number of unique peptide sequences identified by PSMs at this threshold and finally the number of unique protein clusters at a 1% protein level FDR. The colored bars below OMMSA and Mascot results shows the increase achieved with Mascot Percolator.
(A) The search results for in-house tryptically digested E. Coli CID and ETcaD experiments. (B) The search results for in-house partially tryptic digested E. Coli CID, ETcaD, Sequential CID/ETcaD, Decision Tree and FT-ETcaD experiments.

To alleviate the bias toward doubly charged precursors a partial tryptic digest was performed, the increased number of missed cleavages generates higher charged peptides. Interrogation of this data set reflects that 47% of the spectra have a precursor charge state greater than 2+. Fig. 5 displays q-value PSM plots for the parallel CID and ETcaD data sets, it shows that Mascot and OMSSA have a very similar performance for this data set, the only significant deviation being the doubly charged OMSSA ETcaD PSMs. Mascot Percolator performs well at all charge states for both CID and ETcaD data, resulting in a 28% CID and 171% ETcaD increase in PSMs compared with OMSSA and a 32% CID and 36% ETcaD increase with respect to Mascot (Table 4B). A list of peptides uniquely identified by Mascot Percolator for the E. coli CID and ETcaD data sets is provided in the supplementary material.
Fig. 5.

E. coli peptide spectrum match q-p plots—These four q-value PSM plots display the estimated number of correct PSMs for the partial E. coli digest data sets using Mascot, OMSSA, and Mascot Percolator across a range of q-value thresholds. Plot A, shows all the complete data sets and plots B, C, and D, show the estimated correct PSMs for 2+, 3+, and >3+ precursor charge states.
We also conducted sequential fragmentation experiments using the partially digested E. coli sample, in which each precursor is analyzed sequentially by CID and ETcaD, thereby generating spectral pairs for direct comparison of fragmentation patterns (Table 4B). 20,016 CID/ETD spectra pairs were collected in this data set. Fig. 6 compares the number of PSMs identified from the CID and ETcaD spectra using the search methods across the full range of m/z and charge state. Direct comparison between search methods has been made by calculating the percentage increase in PSMs identified by Mascot Percolator compared with Mascot and OMSSA at each m/z and charge state bin using a PSM q-value threshold of 0.01. The heat map highlights that Mascot Percolator boosts spectral identifications across the whole mass and charge ranges of both fragmentation types. Mascot Percolator is especially effective in improving the identification of spectra from larger and more highly charged peptides, significantly identifying eight CID PSMs with a 6+ charge state compared with the two and three PSMs identified by Mascot and OMSSA, and at the same time increasing the number of PSMs at the highest m/z for each charge state. This increase in range is also seen in the ETcaD data set where Mascot Percolator finds three significant PSMs with an 8+ charge state when none are significant in the Mascot and OMSSA results, also 83 PSMs with an m/z of 1000 or greater are significant compared with only 37 for Mascot and 58 for OMSSA. Examining the three right hand heat maps from Fig. 6, in which the ETcaD PSMs have been subtracted from the CID PSMs, ETcaD performs better than CID for high-charge low-mass peptides with both Mascot and OMSSA, as reported in previous studies (5, 27, 37). Moreover, this difference is apparent for OMSSA where the 3+ charge m/z bin at which the number of CID PSMs becomes greater than ETcaD PSMs is 500 m/z compared with the 800 m/z bin for Mascot. number of ETcaD PSMs at 4+ charge states below 700 m/z increases. Interestingly, Mascot Percolator extends CID spectral identifications to provide better coverage of higher charge states. This effect is also seen with the ETcaD data, improving the number of PSMs above the strict q-value threshold at very high charge states (greater than 4+).
Fig. 6.

E. coli sequential experiments—Heat maps highlighting the numbers of unique peptide identifications for Mascot, OMSSA, and Mascot Percolator across the range of m/z and precursor charge state, where a PSM q-value threshold of 0.01 has been applied. The top left six maps show the distribution of unique peptide identifications for CID or ETcaD PSMs for each identification method. The three right hand heat maps show the difference in numbers of CID and ETcaD peptide identifications; a negative number reflects a greater number of ETcaD peptides and a positive number reflects a greater number of CID peptides. The lower four heat maps show the differences in unique peptide identifications between Mascot versus Mascot Percolator, and OMSSA versus Mascot Percolator; a positive percentage represents a gain in the number of significant peptides identified with Mascot Percolator.
Fig. 7 contains an expanded analysis of the sequential E. coli experiment for each precursor, the CID and ETcaD fragmentation spectral pairs are directly compared. Fig. 7A depicts the performance of each search method; these have been further divided up by precursor charge state. As has been seen throughout this study, Mascot Percolator enhances the number of PSMs for both CID and ETcaD significantly identifying 8723 spectral pairs compared with 7178 for Mascot and 6689 for OMSSA. The total overlap in spectral pairs identified by both CID and ETcaD at a 0.01 q-value threshold covers 83% of the total significant spectral matched pairs for Mascot Percolator compared with 69 and 39% for Mascot and OMSSA. The fragmentation and charge bias seen in Mascot and OMSSA is less prominent with Mascot Percolator. In particular an extended overlap in identified CID/ETcaD spectral pairs for Mascot Percolator, where triply charged PSMs show 88% coincidence and 66% for PSMs with >3+ charge states, compared with 77 and 42% for Mascot, and 70 and 50% for OMSSA. Mascot and OMSSA significantly identify 50 and 57% of the 3+ charged CID spectra in the identified spectral pairs respectively, using Mascot Percolator this increases to 70%. Reciprocally, Mascot Percolator finds 90% of the 2+ identified spectral pairs to have significant ETcaD spectra compared with 81% for Mascot and only 6% for OMSSA.
Fig. 7.

E. coli sequential experiment spectral pair analysis—This figure provides an in-depth breakdown of the spectral pairs in the E. coli partial tryptic digest sequential data set. A, This table shows the ratio of spectral pairs identified significantly by CID and ETcaD, CID only, and ETcaD only at a 0.01 q-value threshold across the range of precursor charge states. B, This chart shows the number of spectral pairs where the CID spectra or the ETcaD has the best score. For Mascot Percolator the PEP is used, for Mascot the ion score is used and for OMSSA the e-value is used. This data is displayed for all the spectral pairs with a match above the q-value threshold and also for only the spectral pairs where both CID and ETcaD PSMs are above the q-value threshold.
A restriction of Mascot is that it only examines singly and doubly charged fragment ion series and looks for these in the highest intensity fragment peaks, unassigned higher charged ions can therefore mask the ratio of matched to unmatched ions. The features generated by Mascot Percolator examine all the fragment peaks and possible ion matches irrespective of their intensity, enabling spectra containing high charge fragment ions to be rescored based on the accuracy of fragment ion matches as well as fragment ion intensities.
Fig. 7B graphs the CID/ETcaD spectral pairs this time showing the best score. The red and blue bars are equivalent to the red and blue plus the purple bars in Fig. 7A and show the numbers of spectra that are significant in total, the outlined purple bars show the numbers of spectral pairs where both spectra in the pair are significant. In each instance, the spectra are now further resolved by the PSM with the best PEP score. Consistently for all three scoring methods we observe that CID identifies more doubly charged spectral pairs with better scores than ETcaD, whereas for greater than triply charged spectral pairs ETcaD identifies more pairs at better scores. For triply charged spectral pairs ETcaD dominates in the Mascot search, with 2182 pairs with a best scoring ETcaD spectra and only 474 pairs with a best scoring CID spectra. This is less pronounced for OMSSA with CID identifying 1126 spectra with best score compared with 1438 ETcaD spectra. The numbers of triply charged PSMs significantly identified by Mascot Percolator is consistent to the numbers of doubly charged PSMs for both fragmentation methods; noticeably here CID fragmentation generates more PSMs with better PEPs compared with other methods. Overall, this highlights the extent to which spectral assignments are influenced by data analysis methods and demonstrates that spectrum identification by individual methods depends on the fragmentation method as well as in a mass and charge dependent manner. These analyses show that data analysis approaches, especially around the 3+ precursor cutoff, should be considered along with fragmentation method when setting up a decision tree experiment.
It has been previously demonstrated that a combined approach using a decision tree to select each precursor ion for either CID or ETD/ETcaD fragmentation can be applied (27). This decision tree approach allows improved data set coverage by taking advantage of the qualities of both fragmentation methods. A decision tree experiment using the partial E.Coli digest is reported in Table 4B. This decision tree experiment tries to take advantage of the switching between CID and ETcaD fragmentation to optimize the coverage of the sample. This experiment does generally show better significant coverage of the spectra. The rate of acquisition was still slower than a straight forward parallel CID experiment, and with a sample as complex as this one this meant fewer identifications. However, this experiment could be improved further by adjusting the charge and mass thresholds at which ETcaD is used rather than CID. A full optimization of the decision tree was not conducted in this study.
Another method that can be used to experimentally improve the rate of identification is to analyze the fragment MS/MS ions at high resolution. We have conducted ETcaD experiments recording the MS/MS ions in the Orbitrap analyzer to produce a FT-ETcaD data set. This higher resolution data, although much slower to collect, has a better rate of spectral identification (Table 4B). Spectral identification by Mascot increases to 37% for the FT-ETcaD data, 10% better than for the standard ETcaD experiment. This gain is equivalent to that achieved for the ETcaD experiment using Mascot Percolator instead of Mascot. With the higher resolution data, Mascot Percolator continues to provide an increase over Mascot, increasing spectral identification by 5% to 42%. An important benefit of collecting high resolution MS/MS spectra is that for highly charged spectra it would be possible to deconvolute the spectra, however, the considerable trade off against the rate of acquisition currently limits its utility for proteomics application and thus was not investigated further.
CONCLUSION
Modifications to the Mascot Percolator algorithm described here have improved the features selected for the semi-supervised machine learning, making the tool compatible with any fragmentation method available in Mascot. The fact that Mascot Percolator does not require separate decoy databases, using the integrated decoy capabilities built into Mascot, allows all of Mascot's search parameters including the full range of peptide cleavage rules and protein modifications to be used. Percolator continues to provide increased PSMs while maintaining accurate FDR and PEP values over stand-alone database searches. The posterior error probabilities (PEPs) provided by Mascot Percolator are a powerful scoring mechanism and, although more conservative than using q-value thresholds, they provide a measure of the probability of error for each individual PSM and allow identifications to be considered independently of the whole data set. Fragmentation and charge bias is also less prominent with Mascot Percolator. This in turn promotes Mascot Percolator as an ideal framework for making cross data set comparisons. This study demonstrates the sensitivity and specificity of Mascot Percolator, establishing it as a very powerful tool for spectral identification and also for whole proteome analysis.
Acknowledgments
We thank Joshua Coon and Danielle Swaney for advising us on how they processed and searched their data sets, Lewis Geer and John Cottrell for helping us with optimal search parameters for OMSSA and Mascot, and Mercedes Pardo for proof reading the final draft prior to submission.
Footnotes
* This work was supported by the Wellcome Trust [079643/Z/06/Z].
 This article contains supplemental Table.
1 The abbreviations used are:
- CID
- collision induced dissociation
- EBI
- European Bioinformatics Institute
- ECD
- electron capture dissociation
- ETcaD
- ETD with supplemental activation
- ETD
- electron transfer dissociation
- FDR
- false discovery rate
- IQR
- inter quartile range
- K-S
- Kolmogorov-Smirnov Test
- LC
- liquid chromatography
- MS/MS
- tandem mass spectrometry
- OMSSA
- open mass spectrometry search algorithm
- PEP
- posterior error probability
- PSM
- peptide spectrum match
- SCX
- strong cation exchange
- UPS
- universal protein standard.
REFERENCES
- 1. Appella E., Anderson C. W. (2007) New prospects for proteomics–electron-capture (ECD) and electron-transfer dissociation (ETD) fragmentation techniques and combined fractional diagonal chromatography (COFRADIC). Febs J. 274, 6255. [DOI] [PubMed] [Google Scholar]
- 2. Käll L., Canterbury J. D., Weston J., Noble W. S., MacCoss M. J. (2007) Semi-supervised learning for peptide identification from shotgun proteomics datasets. Nat. Methods 4, 923–925 [DOI] [PubMed] [Google Scholar]
- 3. Brosch M., Yu L., Hubbard T., Choudhary J. (2009) Accurate and sensitive peptide identification with Mascot Percolator. J. Proteome Res. 8, 3176–3181 [DOI] [PMC free article] [PubMed] [Google Scholar]
- 4. Good D. M., Wirtala M., McAlister G. C., Coon J. J. (2007) Performance characteristics of electron transfer dissociation mass spectrometry. Mol. Cell. Proteomics 6, 1942–1951 [DOI] [PubMed] [Google Scholar]
- 5. Mikesh L. M., Ueberheide B., Chi A., Coon J. J., Syka J. E., Shabanowitz J., Hunt D. F. (2006) The utility of ETD mass spectrometry in proteomic analysis. Biochim. Biophys. Acta 1764, 1811–1822 [DOI] [PMC free article] [PubMed] [Google Scholar]
- 6. Zubarev R. A. (2004) Electron-capture dissociation tandem mass spectrometry. Curr. Opin. Biotechnol. 15, 12–16 [DOI] [PubMed] [Google Scholar]
- 7. Chi A., Huttenhower C., Geer L. Y., Coon J. J., Syka J. E., Bai D. L., Shabanowitz J., Burke D. J., Troyanskaya O. G., Hunt D. F. (2007) Analysis of phosphorylation sites on proteins from Saccharomyces cerevisiae by electron transfer dissociation (ETD) mass spectrometry. Proc. Natl. Acad. Sci. U. S. A. 104, 2193–2198 [DOI] [PMC free article] [PubMed] [Google Scholar]
- 8. Domon B., Bodenmiller B., Carapito C., Hao Z., Huehmer A., Aebersold R. (2009) Electron transfer dissociation in conjunction with collision activation to investigate the Drosophila melanogaster phosphoproteome. J. Proteome Res. 8, 2633–2639 [DOI] [PubMed] [Google Scholar]
- 9. Molina H., Horn D. M., Tang N., Mathivanan S., Pandey A. (2007) Global proteomic profiling of phosphopeptides using electron transfer dissociation tandem mass spectrometry. Proc. Natl. Acad. Sci. U. S. A. 104, 2199–2204 [DOI] [PMC free article] [PubMed] [Google Scholar]
- 10. Wiesner J., Premsler T., Sickmann A. (2008) Application of electron transfer dissociation (ETD) for the analysis of posttranslational modifications. Proteomics 8, 4466–4483 [DOI] [PubMed] [Google Scholar]
- 11. McAlister G. C., Berggren W. T., Griep-Raming J., Horning S., Makarov A., Phanstiel D., Stafford G., Swaney D. L., Syka J. E., Zabrouskov V., Coon J. J. (2008) A proteomics grade electron transfer dissociation-enabled hybrid linear ion trap-orbitrap mass spectrometer. J. Proteome Res. 7, 3127–3136 [DOI] [PMC free article] [PubMed] [Google Scholar]
- 12. Nagaraj N., D'Souza R. C., Cox J., Olsen J. V., Mann M. (2010) Feasibility of large-scale phosphoproteomics with higher energy collisional dissociation fragmentation. J. Proteome Res. 9, 6786–6794 [DOI] [PubMed] [Google Scholar]
- 13. Biemann K. (1990) Sequencing of peptides by tandem mass-spectrometry and high-energy collision-induced dissociation. Methods Enzymol. 193, 455–479 [DOI] [PubMed] [Google Scholar]
- 14. Syka J. E., Coon J. J., Schroeder M. J., Shabanowitz J., Hunt D. F. (2004) Peptide and protein sequence analysis by electron transfer dissociation mass spectrometry. Proc. Natl. Acad. Sci. U. S. A. 101, 9528–9533 [DOI] [PMC free article] [PubMed] [Google Scholar]
- 15. Hart S. R., Lau K. W., Gaskell S. J., Hubbard S. J. (2011) Distributions of ion series in ETD and CID spectra: making a comparison. Methods Mol. Biol. 696, 327–337 [DOI] [PubMed] [Google Scholar]
- 16. Perkins D. N., Pappin D. J., Creasy D. M., Cottrell J. S. (1999) Probability-based protein identification by searching sequence databases using mass spectrometry data. Electrophoresis 20, 3551–3567 [DOI] [PubMed] [Google Scholar]
- 17. Geer L. Y., Markey S. P., Kowalak J. A., Wagner L., Xu M., Maynard D. M., Yang X., Shi W., Bryant S. H. (2004) Open mass spectrometry search algorithm. J. Proteome Res. 3, 958–964 [DOI] [PubMed] [Google Scholar]
- 18. Craig R., Beavis R. C. (2004) TANDEM: matching proteins with tandem mass spectra. Bioinformatics 20, 1466–1467 [DOI] [PubMed] [Google Scholar]
- 19. Kandasamy K., Pandey A., Molina H. (2009) Evaluation of several MS/MS search algorithms for analysis of spectra derived from electron transfer dissociation experiments. Anal. Chem. 81, 7170–7180 [DOI] [PubMed] [Google Scholar]
- 20. Sweet S. M., Jones A. W., Cunningham D. L., Heath J. K., Creese A. J., Cooper H. J. (2009) Database search strategies for proteomic data sets generated by electron capture dissociation mass spectrometry. J. Proteome Res. 8, 5475–5484 [DOI] [PMC free article] [PubMed] [Google Scholar]
- 21. Good D. M., Wenger C. D., Coon J. J. (2010) The effect of interfering ions on search algorithm performance for electron-transfer dissociation data. Proteomics 10, 164–167 [DOI] [PMC free article] [PubMed] [Google Scholar]
- 22. Baker P. R., Medzihradszky K. F., Chalkley R. J. (2010) Improving software performance for peptide electron transfer dissociation data analysis by implementation of charge state- and sequence-dependent scoring. Mol. Cell. Proteomics 9, 1795–1803 [DOI] [PMC free article] [PubMed] [Google Scholar]
- 23. Deutsch E. W., Shteynberg D., Lam H., Sun Z., Eng J. K., Carapito C., von Haller P. D., Tasman N., Mendoza L., Farrah T., Aebersold R. (2010) Trans-Proteomic Pipeline supports and improves analysis of electron transfer dissociation data sets. Proteomics 10, 1190–1195 [DOI] [PMC free article] [PubMed] [Google Scholar]
- 24. Liu X., Shan B., Xin L., Ma B. (2010) Better score function for peptide identification with ETD MS/MS spectra. BMC Bioinformatics 11 Suppl 1, S4. [DOI] [PMC free article] [PubMed] [Google Scholar]
- 25. Sadygov R. G., Good D. M., Swaney D. L., Coon J. J. (2009) A new probabilistic database search algorithm for ETD spectra. J. Proteome Res. 8, 3198–3205 [DOI] [PMC free article] [PubMed] [Google Scholar]
- 26. Chalkley R. J., Baker P. R., Medzihradszky K. F., Lynn A. J., Burlingame A. L. (2008) In-depth analysis of tandem mass spectrometry data from disparate instrument types. Mol. Cell. Proteomics 7, 2386–2398 [DOI] [PMC free article] [PubMed] [Google Scholar]
- 27. Swaney D. L., McAlister G. C., Coon J. J. (2008) Decision tree-driven tandem mass spectrometry for shotgun proteomics. Nat. Methods 5, 959–964 [DOI] [PMC free article] [PubMed] [Google Scholar]
- 28. Käll L., Storey J. D., MacCoss M. J., Noble W. S. (2008) Posterior error probabilities and false discovery rates: two sides of the same coin. J. Proteome Res. 7, 40–44 [DOI] [PubMed] [Google Scholar]
- 29. Gupta N., Pevzner P. A. (2009) False discovery rates of protein identifications: a strike against the two-peptide rule. J. Proteome Res. 8, 4173–4181 [DOI] [PMC free article] [PubMed] [Google Scholar]
- 30. Desiere F., Deutsch E. W., King N. L., Nesvizhskii A. I., Mallick P., Eng J., Chen S., Eddes J., Loevenich S. N., Aebersold R. (2006) The PeptideAtlas project. Nucleic Acids Res. 34, D655–D658 [DOI] [PMC free article] [PubMed] [Google Scholar]
- 31. Swaney D. L., McAlister G. C., Wirtala M., Schwartz J. C., Syka J. E., Coon J. J. (2007) Supplemental activation method for high-efficiency electron-transfer dissociation of doubly protonated peptide precursors. Anal. Chem. 79, 477–485 [DOI] [PMC free article] [PubMed] [Google Scholar]
- 32. Vizcaino J. A., Côté R., Reisinger F., Foster J. M., Mueller M., Rameseder J., Hermjakob H., Martens L. (2009) A guide to the Proteomics Identifications Database proteomics data repository. Proteomics 9, 4276–4283 [DOI] [PMC free article] [PubMed] [Google Scholar]
- 33. Spivak M., Weston J., Bottou L., Käll L., Noble W. S. (2009) Improvements to the percolator algorithm for Peptide identification from shotgun proteomics data sets. J. Proteome Res. 8, 3737–3745 [DOI] [PMC free article] [PubMed] [Google Scholar]
- 34. Klimek J., Eddes J. S., Hohmann L., Jackson J., Peterson A., Letarte S., Gafken P. R., Katz J. E., Mallick P., Lee H., Schmidt A., Ossola R., Eng J. K., Aebersold R., Martin D. B. (2008) The standard protein mix database: a diverse data set to assist in the production of improved Peptide and protein identification software tools. J. Proteome Res. 7, 96–103 [DOI] [PMC free article] [PubMed] [Google Scholar]
- 35. Granholm V., Noble W. S., Kall L. (2011) On using samples of known protein content to assess the statistical calibration of scores assigned to peptide-spectrum matches in shotgun proteomics. J. Proteome Res. 10, 3844. [DOI] [PMC free article] [PubMed] [Google Scholar]
- 36. Wenger C. D., Phanstiel D. H., Lee M. V., Bailey D. J., Coon J. J. (2011) COMPASS: a suite of pre- and post-search proteomics software tools for OMSSA. Proteomics 11, 1064–1074 [DOI] [PMC free article] [PubMed] [Google Scholar]
- 37. Molina H., Matthiesen R., Kandasamy K., Pandey A. (2008) Comprehensive comparison of collision induced dissociation and electron transfer dissociation. Anal. Chem. 80, 4825–4835 [DOI] [PMC free article] [PubMed] [Google Scholar]