Abstract.
Coherent speckle influences the resulting image when narrow spectral line-width and single spatial mode illumination are used, though these are the same light-source properties that provide the best radiance-to-cost ratio. However, a suitable size of the detection pinhole can be chosen to maintain adequate optical sectioning while making the probability density of the speckle noise more normal and reducing its effect. The result is a qualitatively better image with improved contrast, which is easier to read. With theoretical statistics and experimental results, we show that the detection pinhole size is a fundamental parameter for designing imaging systems for use in turbid media.
Keywords: microscopy, turbid, speckle, confocal, detection pinhole
1. Introduction
The use of laser illumination has allowed high-speed reflectance-based confocal imaging in human skin and other tissues.1–3 Confocal reflectance microscopy provides images with optical sectioning and resolution comparable to that of histology.1 However, when illuminating and detecting with coherent light within turbid tissue, the light field at the detector plane is predominantly speckle. This is due to the multitude of randomly phased dipoles both in the focal plane and in the multiply scattered background. The speckles interfere with the nominal object reflectance. Goodman showed that the spatial frequency of the speckle noise spans the bandpass of the optical system.4 Thus the effect is particularly disruptive when viewing images of turbid media such as human tissues. When integrated by the detection pinhole and square-law detector, a given pixel value is affected by the number of speckles that are averaged. Generally, if the pinhole is small, the signal will have larger variations, as speckles translate across and/or boil in the aperture, than if the pinhole is large, in which more speckles are averaged. These variations are not representative of the true structure of the object. In the limiting case of no pinhole and an infinitely large detector, integration of the speckles will cause the signal to approach a constant average value. However, opening the pinhole also reduces the optical sectioning capability of the microscope, reducing contrast of object structures in the focal plane.
The effect of the detection pinhole size is usually described in terms of optical sectioning, background rejection, and detected signal to noise.5 However, the size of the detection pinhole in relation to speckle noise is an equally important consideration. For example, when using a dual-clad fiber with two discrete detection aperture sizes (multimode versus single mode fiber), the larger aperture suppressed speckle noise6 but with significant loss in optical sectioning. Similarly, excellent sectioning and contrast for imaging of skin with reduced speckle, and the resulting high sensitivity and specificity for detecting cancer, have relied on pinholes with size in the range of 3 to 5 resels (to be defined in the following section).7,8 Thus an appropriately sized pinhole reduces speckle noise without dramatic loss of sectioning. In this paper, we present our findings for the role of pinhole size in optimizing the trade-off between reducing speckle noise and maintaining optical sectioning for cellular-level imaging in human skin. The use of pinhole size as the driving variable for system design is also described.
2. Theory
Our analysis is based on earlier reports9–12 on the probability density of the signal statistics when speckle intensity is detected by a circular aperture. We define the size of the pinhole with a parameter that approximates the number of speckles within the aperture. The pinhole size can be represented by the number of resels across its diameter, where 1 resel is approximately equal to the full width at half maximum (FWHM) of the point-spread-function (PSF):
| (1) |
where is the wavelength of illumination and detection, NA is the working numerical aperture of the objective lens, and is the magnification of the confocal system to the pinhole plane. For pinhole radius , the number of resels, , is:
| (2) |
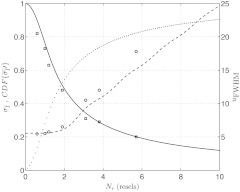
For any given object point that is imaged, we will assume there is a fully developed speckle pattern across the detection plane. This assumption is supported by the relatively low number of scatterers required to generate a fully developed speckle pattern, compared with the high number that is actually illuminated.13 This speckle pattern is due to scatterers both in the nominal object plane and in multiply scattered background that returned to the detection plane. A field of view is produced by scanning the focused illumination (and conjugate detection aperture) within the turbid object. As we scan, the speckle pattern both translates across as well as boils in the pinhole aperture, leading to a new speckle realization. The ensemble probability density function (PDF) of the normalized speckle intensity, , that is averaged by the detection-pinhole was calculated from Ref. 12 in terms of our resel parameter and is plotted in Fig. 1 for a range of pinhole sizes. For infinitesimally small pinholes, the probability density is a negative exponential. As the pinhole grows in size, the probability distribution begins to appear more normal in shape and narrower in width. This implies that the variations in the detected intensity diminish. For a hypothetical uniform object in focus, with speckle generated by multiple scattering in the background, these variations would disrupt the accurate reporting of the uniform reflectance of the object. Thus a narrower probability density is desired to accurately represent the object.
Fig. 1.
Normalized probability distributions of speckle intensity averaged by detection pinholes of 0, 1, 3, and 5 resel diameters.
In Fig. 2, we show the RMS speckle noise, , calculated from Ref. 12 in terms of resels. This RMS value represents the width of the detected signal distribution (the width of the PDF in Fig. 1). As the pinhole size increases, the speckle noise decreases. For a detection pinhole whose diameter is 3 resels, the speckle noise is reduced to almost a third of the noise with a coherent (infinitesimal) pinhole; for a 5 resel pinhole, the noise drops to a fourth. Overlaid in Fig. 2 is the diffraction-limited axial sectioning (FWHM) for increasing pinhole size with uniform (nonapodized) illumination and detection pupils,5 where the axial sectioning is normalized to the optical coordinate by:
| (3) |
Fig. 2.
RMS speckle noise (solid line, left axis), cumulative density of the slope of RMS speckle noise (dotted line, left axis), and FWHM optical sectioning (dashed line, right axis) for increasing pinhole size. Measured FWHM sectioning (circles) and measured speckle index (squares) are also plotted for experiment parameters listed in Tables 1 and 2. Normalized sectioning values were converted from physical measurements by Eq. (3).
It is also interesting to look at the remaining available reduction in speckle noise as the pinhole is enlarged. This can be calculated as the cumulative density of the normalized slope of :
| (4) |
where the normalized slope of the RMS speckle noise, , is:
| (5) |
Equation (4) is also overlaid in Fig. 2. It can be seen that 80% of the change in speckle noise has occurred by 5 resels; further marginal reductions will require significantly larger pinholes.
3. Materials and Methods
3.1. Experiments
The analytical model for the trade-off between reduction of speckle noise and optical sectioning was experimentally validated for two configurations. In one configuration that is most commonly implemented, we increased the pinhole size to increase speckle averaging and signal, at the expense of optical sectioning and resolution, while maintaining a constant NA with a desired objective lens. In the other configuration, we maintain a nominal desired constant sectioning by varying NA and pinhole size together. This configuration allows us to determine the effect of speckle averaging in a given object section with a given number of scatterers within the probe volume.
3.2. Samples and Instrumentation
Thick () ex vivo specimens of human epidermis, obtained as discarded tissue from Mohs surgeries, were imaged with a confocal microscope (Vivascope 2000, Lucid, Rochester, NY). The microscope uses an 830-nm diode laser for illumination and a combination of polygon and galvanometric mirrors to scan the focused spot within the sample. A water immersion objective lens (Photon Gear, Ontario, NY) was used, with an adjustable iris allowing the effective NA to be selected between 0.5 and 0.9. With this objective and the Vivascope’s internal magnification and scan timing, a field of view of approximately () was imaged; this is magnification from object plane to pinhole plane. The optical sectioning was measured by translating a planar glass interface through focus with a calibrated piezo-stage (Melles Griot Nanomotion II) and recording the detected signal. The theoretical lateral resolution (0.4 to 0.6 μm) for all investigated combinations of pinholes sizes and NAs was less than or equal to the pixelation (0.6 μm) within the image. For each experimental setting, the laser power was adjusted, and the video signal’s histogram monitored to ensure complete use of the detection channel’s dynamic range with no saturated pixels. Three successive video frames were averaged to remove the effect of the microscope’s asynchronous timing jitter.
3.3. Statistical Analysis
Since our images consist of inherent reflectance and morphology variations of tissue, it is not possible to directly and independently measure the RMS speckle noise. Instead, we used the speckle index14 as a surrogate parameter for assessing the scintillating effect of speckle in images. The speckle index is a measure of localized contrast in the form of an average of local normalized RMS variations. The speckle index is an average of local variations in normalized signal, while the RMS noise is an average of global normalized signal variations. Consequently, the speckle index for a heterogenous object (such as tissue) turns out to be mathematically similar to the RMS noise for an object with uniform variations. This, of course, is provided that the scale sizes of the morphologic features within the object are larger than the kernel size of the speckle index calculation. This is true in the case of cellular-level morphology. Imaging was at a single lateral-and-depth location within the tissue to allow comparison of speckle noise on image quality under fixed-object conditions, for the seven combinations of pinhole size and NA listed in Tables 1 and 2. Measurements of speckle index were performed on the entire image for each combination.
Table 1.
Speckle index versus pinhole size for an objective lens NA of 0.8. These measurements (plotted in Fig. 2) represent the commonly implemented configuration of opening the pinhole to reduce speckle noise.
| Pinhole size (μm) | 25 | 50 | 100 | 150 |
|---|---|---|---|---|
| Effective resel size | 1.0 | 1.9 | 3.8 | 5.7 |
| Measured optical FWHM sectioning (μm) | 1.4 | 1.6 | 3.0 | 4.4 |
| Speckle index of images in Fig. 3 | 0.73 | 0.47 | 0.28 | 0.20 |
Table 2.
Speckle index versus pinhole size and NA for a constant optical sectioning of approximately 4 μm (plotted in Fig. 2).
| Pinhole size (μm) | 25 | 50 | 100 | 150 |
|---|---|---|---|---|
| Objective NA setting | 0.5 | 0.5 | 0.65 | 0.8 |
| Effective resel size | 0.6 | 1.2 | 3.1 | 5.7 |
| Measured optical FWHM sectioning (μm) | 3.7 | 3.9 | 4.1 | 4.4 |
| Speckle index of images in Fig. 4 | 0.82 | 0.63 | 0.31 | 0.20 |
4. Results and Discussion
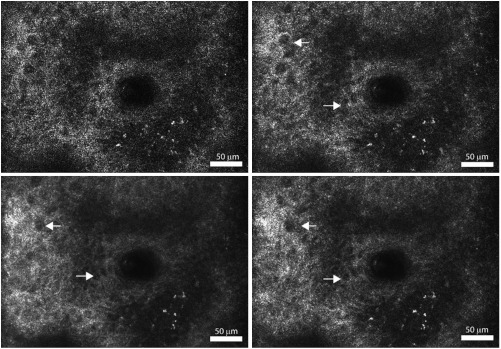
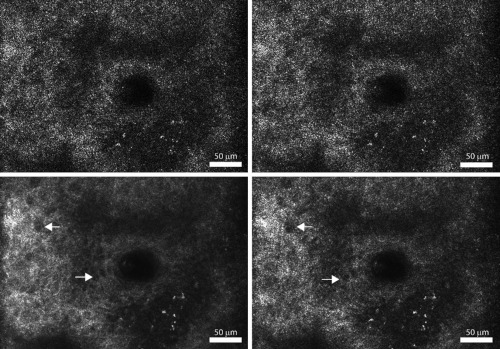
Figure 3 demonstrates the improvement in image quality by opening the pinhole, as is commonly performed, to reduce speckle noise. The increase in sectioning (1.4 to 4.4 μm FWHM) does not appreciably reduce the identification of the cellular morphology. However, the reduction in scintillation is evident both qualitatively in the images of Fig. 3 and as noted by the speckle index (Table 1, Figs. 2, and 3). Also, as the pinhole size is increased, the bright pigment granules in the lower-right portion of the images are better appreciated with significantly improved contrast. Both the qualitative and the quantitative results provide confirmation of the normalization of probability densities (Fig. 1), especially for pinhole sizes approaching 5 resels. From these set of images and the speckle index values, a 5 resel pinhole appears to provide the best qualitative imaging with more accurate pixel intensities.
Fig. 3.
Confocal images of a thick () specimen of human epidermis, using an objective lens of 0.8NA, with increasing effective pinhole size (clockwise from top left): 1.0 resel, 1.9 resel, 3.8 resel, and 5.7 resel. Arrows point to dark nuclei surrounded by bright cellular cytoplasm. Calculated speckle index (clockwise from top left): 0.73, 0.47, 0.31, and 0.20. Measured optical sectioning (FWHM, clockwise from top left): 1.4, 1.6, 3.0, and 4.4 μm. Images have been normalized to the same average brightness for display.
Figure 4 demonstrates the improvement in image quality and reduction in speckle noise, while maintaining optical sectioning, for each of the four combinations of pinhole sizes and NAs (Table 2). Again, it is clear that the use of larger pinhole sizes allows the cellular morphology to be more easily discerned. Since the sectioning is maintained nearly constant for all combinations in all images, speckle noise is the primary reason for the scintillating effect at smaller pinhole sizes. A clear trend of decreasing scintillation is again confirmed by measurements of the speckle index (Table 2).
Fig. 4.
Confocal images of a thick () specimen of human epidermis, with nearly constant sectioning of 4 μm, and increasing effective pinhole size and NA (clockwise from top left): , , , and . Arrows point to dark nuclei surrounded by bright cellular cytoplasm. Calculated speckle index (clockwise from top left): 0.82, 0.63, 0.28, and 0.20. Images have been normalized to the same average brightness for display.
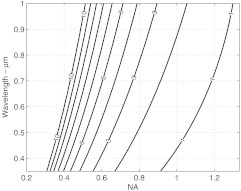
Finally, we demonstrate the usefulness of this analytical and experimental approach for system design. From Fig. 2, a 5 resel pinhole has a normalized FWHM sectioning of approximately 13 optical units. Setting Eq. (3) equal to 13 optical units, and parameterizing against NA and wavelength, we create a contour map of the expected sectioning (in μm). The result is plotted in Fig. 5 for a water immersion index (1.333), typical of imaging in tissues. This is a map of the expected sectioning performance if we hold the pinhole size constant at 5 resels. All points in this map exhibit the same detected speckle statistics. This is a useful design guideline when suppression of speckle is important. The slope of the contours indicates that choice of NA has a stronger effect than wavelength on the sectioning performance. The relatively large parameter space within this map allows design of an optical system with reasonable sectioning at easily achievable NAs.
Fig. 5.
FWHM axial sectioning (μm) contours versus wavelength and NA, for a constant 5 resel detection pinhole size (immersion index of 1.333 is assumed).
From theory and experimental observations, a pinhole size of approximately 5 resels shows reduction of speckle noise with tolerable loss of sectioning. Of course, opening the pinhole (and the loss of sectioning) makes the system more susceptible to multiply scattered background and loss of contrast. This is seen in the images with 5.7 resel pinholes in Figs. 3 and 4. Techniques to recover sectioning and reduce the multiply scattered background include the use of dual axes, divided pupils and modal illumination.15–17 The effect of these techniques on the (potentially asymmetric) PSF relative to the pinhole/detector aperture needs to be accounted for, but similar balancing of speckle statistics against sectioning may be performed. These techniques also hold for an imaging-based detector such as a CCD or CMOS array. For instance, in line-scan confocal imaging, the pixel area must be increased to dampen speckle noise.18
5. Conclusion
In conclusion, the effect of detection pinhole size on the speckle noise was presented. The use of an approximately 5 resel pinhole aperture preserves adequate sectioning while lowering speckle noise in cellular-level imaging in skin. Note that the trade-off is provided by a pinhole size that is not too much larger than ideal diffraction-limited conditions, which offers a significant practical advantage for confocal microscopy. Furthermore, this pinhole size still allows for a wide range of NAs and wavelengths to be utilized. Suitable specification of the optical system can produce optimal trade-off between reducing speckle noise and preserving optical sectioning in coherent reflectance based imaging.
Acknowledgments
This work was supported by Grant R01EB012466 from the NIH/NIBIB’s Image Guided Interventions program. We thank Bill Fox at Lucid, Inc. (Rochester, NY) for technical support, our Mohs histotechnicians (Marie Tudisco, William Phillips) for providing the skin specimens, and Charles A. DiMarzio (Northeastern University) for discussions and critical reading.
References
- 1.Gonzalez S., Gill M., Halpern A., Reflectance Confocal Microscopy of Cutaneous Tumors: An Atlas with Clinical, Dermoscopic and Histological Correlations. p. 292, Informa Healthcare, London: (2008). [Google Scholar]
- 2.Mujat M., et al. , “Compact adaptive optics line scanning ophthalmoscope,” Opt. Express 17(12), 10242–10258 (2009). 10.1364/OE.17.010242 [DOI] [PMC free article] [PubMed] [Google Scholar]
- 3.Farahati B., et al. , “Rigid confocal endoscopy for in vivo imaging of experimental oral squamous intra-epithelial lesions,” J. Oral Path. Med. 39(4), 318–327 (2010). 10.1111/j.1600-0714.2009.00841.x [DOI] [PubMed] [Google Scholar]
- 4.Goodman J. W., “Some fundamental properties of speckle,” J. Opt. Soc. Am. 66(11), 1145–1150 (1976). 10.1364/JOSA.66.001145 [DOI] [Google Scholar]
- 5.Wilson T., Carlini A. R., “Size of the detector in confocal imaging systems,” Opt. Lett. 12(4), 227–229 (1987). 10.1364/OL.12.000227 [DOI] [PubMed] [Google Scholar]
- 6.Yelin D., et al. , “Double–clad fiber for endoscopy,” Opt. Lett. 29(20), 2408–2410 (2004). 10.1364/OL.29.002408 [DOI] [PubMed] [Google Scholar]
- 7.Pellacani G., et al. , “The impact of in vivo reflectance confocal microscopy for the diagnostic accuracy of melanoma and equivocal melanocytic lesions,” J. Invest. Derm. 127(12), 2759–2765 (2007). 10.1038/sj.jid.5700993 [DOI] [PubMed] [Google Scholar]
- 8.Guitera P., et al. , “The impact of in vivo reflectance confocal microscopy on the diagnostic accuracy of lentigo maligna and equivocal pigmented and nonpigmented macules of the face,” J. Invest. Derm. 130(8), 2080–2091 (2010). 10.1038/jid.2010.84 [DOI] [PubMed] [Google Scholar]
- 9.Arsenault H. H., April G., “Properties of speckle integrated with a finite aperture and logarithmically transformed,” J. Opt. Soc. Am. 66(11), 1160–1163 (1976). 10.1364/JOSA.66.001160 [DOI] [Google Scholar]
- 10.Barakat R., “First-order probability densities of laser speckle patterns observed through finite-size scanning apertures,” J. Mod. Opt. 20(9), 729–740 (1973). 10.1080/713818819 [DOI] [Google Scholar]
- 11.Dainty J. C., “Detection of images immersed in speckle noise,” Opt. Acta 18(5), 327–339 (1971). 10.1080/713818445 [DOI] [Google Scholar]
- 12.Dainty J. C., “Some statistical properties of random speckle patterns in coherent and partially coherent illumination,” Opt. Acta. 17 (10), 761–772 (1970). 10.1080/713818245 [DOI] [Google Scholar]
- 13.Goodman J. W., Speckle Phenomena in Optics, p. 384, Roberts and Company Publishers, CO: (2006). [Google Scholar]
- 14.Crimmins T. R., “Geometric filter for speckle reduction,” Appl. Opt. 24(10), 1438–1443 (1985). 10.1364/AO.24.001438 [DOI] [PubMed] [Google Scholar]
- 15.Liu J. T. C., et al. , “Efficient rejection of scattered light enables deep optical sectioning in turbid media with low-numerical-aperture optics in a dual-axis confocal architecture,” J. Biomed. Opt. 13(3), 034020 (2008). 10.1117/1.2939428 [DOI] [PubMed] [Google Scholar]
- 16.Dwyer P. J., DiMarzio C. A., Rajadhyaksha M., “Confocal theta line-scanning microscope for imaging human tissues,” Appl. Opt. 46(10), 1843–1851 (2007). 10.1364/AO.46.001843 [DOI] [PubMed] [Google Scholar]
- 17.Glazowski C., Zavislan J., “Improved contrast by modal illumination in scanning reflectance confocal microscopy,” in Proc. SPIE 8227, 822715 (2012). 10.1117/12.906438 [DOI] [Google Scholar]
- 18.Glazowski C., Abeytunge S., Rajadhyaksha M., “Real-time line-scanning reflectance confocal endoscope to enhance sectioning and reduce speckle for intraoral imaging,” in Proc. SPIE 8207, 82071U (2012). 10.1117/12.908374 [DOI] [Google Scholar]


