


Abstract
RNA duplex stability depends strongly on ionic conditions, and inside cells RNAs are exposed to both monovalent and multivalent ions. Despite recent advances, we do not have general methods to quantitatively account for the effects of monovalent and multivalent ions on RNA stability, and the thermodynamic parameters for secondary structure prediction have only been derived at 1M [Na+]. Here, by mechanically unfolding and folding a 20 bp RNA hairpin using optical tweezers, we study the RNA thermodynamics and kinetics at different monovalent and mixed monovalent/Mg2+ salt conditions. We measure the unfolding and folding rupture forces and apply Kramers theory to extract accurate information about the hairpin free energy landscape under tension at a wide range of ionic conditions. We obtain non-specific corrections for the free energy of formation of the RNA hairpin and measure how the distance of the transition state to the folded state changes with force and ionic strength. We experimentally validate the Tightly Bound Ion model and obtain values for the persistence length of ssRNA. Finally, we test the approximate rule by which the non-specific binding affinity of divalent cations at a given concentration is equivalent to that of monovalent cations taken at 100-fold concentration for small molecular constructs.
INTRODUCTION
RNA hairpins are elementary structures found in many macromolecular assemblies. It is generally accepted that a deeper understanding of their dynamics is a critical step toward the elucidation of many biological processes, like the regulation of gene expression (1–5); the catalytic activity in many reactions (6,7); the ligand-binding specificity (8); or the RNA folding problem (9,10). DNA and RNA hairpins are also appealing model systems for their simplicity as they are amenable to exhaustive studies using a more physically oriented approach, where theoretical models can be rigorously tested using simulations and experiments (11,12).
Many different and complementary biophysical methods have been used to study these structures (13–21). For example, using time-resolved nuclear magnetic resonance (NMR) spectroscopy and thermal denaturation experiments, kinetics and thermodynamics of bistable RNA molecules were studied (22). Recently, a photolabile caged RNA was designed to stabilize one ground-state conformation and study the folding kinetics by NMR and CD spectroscopy under different conditions, including Mg2+ (23). Laser temperature-jump experiments have also been used to characterize the folding kinetics of small RNA hairpins at the ns and μs timescales (24–29). Using coarse-grained Go-like models, it was predicted that hairpins unfold in an all-or-none process in mechanical experiments (30), in agreement with experimental results (31–33).
Within the cell, many dynamical processes involving transient melting events of DNA and RNA double strands are driven by the application of localized forces by molecular motors. Therefore, single-molecule experiments are ideal to understand the thermodynamics and kinetics of macromolecules inside cells (34,35). As pointed out by Hyeon et al. (30), force-denaturation using single-molecule experiments are intrinsically different from thermally induced denaturation: in bulk experiments where the unfolded state is accessed by raising the temperature or lowering the concentration of ions, the unfolded state is a high-entropy state while in mechanical pulling experiments the unfolding process is a transition from a low-entropy state to another low-entropy state. Regions of the free energy landscape normally inaccessible by conventional methods are probed using mechanical experiments. Consequently, pathways and rates of thermally induced and mechanical unfolding processes are expected to be different.
In a previous work (36), we pulled an RNA hairpin using optical tweezers (37,38) to study the base-pairing thermodynamics, kinetics and mechanical properties at a fixed monovalent condition. A kinetic analysis was introduced to determine the location of the force-dependent kinetic barrier, the attempt rate, and the free energy of formation of the molecule. Here, we performed a systematic study by mechanically pulling the same RNA hairpin at different monovalent cation concentrations and also at mixed ionic conditions containing different concentrations of Mg2+ cations. This is important because RNAs are highly charged polyanions whose stability strongly depends on solvent ionic conditions (39–43). Despite its biological significance, we have limited information about RNA helix stability in mixed monovalent/multivalent ionic conditions (44,45). In fact, the thermodynamic parameters for secondary structural elements of RNAs have only been derived at the fixed standard salt condition of 1M [Na+] (15–21). Here, we derived numbers such as the persistence length describing the elastic response of ssRNA and also the free energy of formation of an RNA hairpin at different monovalent and mixed monovalent/Mg2+ conditions. Our results are compatible with predictions obtained using the Tightly Bound Ion (TBI) model for mixed ion solutions, which treats monovalent ions as ionic background and multivalent ions as responsible from ion–ion correlation effects, and which takes into account only non-sequence-specific electrostatic effects of ions on RNA (43–45). Our findings demonstrate the validity of the approximate rule by which the non-specific binding affinity of divalent cations is equal to that of monovalent cations taken around 100-fold concentration for small molecular constructs (46,47).
MATERIALS AND METHODS
Molecular synthesis
The RNA molecule was prepared as previously described (48). Oligonucleotides CD4F (5′-AATTCACACG CGAGCCATAA TCTCATCTGG AAACAGATGAG ATTA TGGCTCGC ACACA-3′) and CD4R (5′-AGCTTGTGT GCGAGCCATA ATCTCATC TGTTTCCAGAT GAGATTATGGC TCGCGTGTG-3′) were annealed and cloned into the pBR322 DNA plasmid (GenBank J01749) digested with EcoRI (position 4360) and HindIII (position 30). The annealed oligonucleotides contain the sequence that codes for a modified version of CD4-42F class I hairpin that targets the mRNA of the CD4 receptor of the human immunodeficiency virus (49). Oligonucleotides T7_Forward (5′-TAATACGACTCA CTATAGG GACTGGTGA GTACTCA ACCAAGTC-3′) and T7_Reverse (5′-TA GGAAGC AGCCCAGT AGTAGG-3′) were used as primers to amplify by PCR a product of 1201 bp from the recombinant clone containing the CD4 insert. This amplicon contains the T7 RNA Polymerase promoter at one end, and was used as a template to synthesize an RNA containing the RNA hairpin (20 bp stem sequence and tetraloop GAAA) and the RNA components of handles A (527 bp) and B (599 bp). The DNA components of handles A and B were obtained by PCR from the pBR322 vector (positions 3836-1 for handle A and positions 31-629 for handle B). Handle A was 3′ biotinylated while handle B was tagged with a 5′ digoxigenin. Hybridization reactions were performed in a formamide-based buffer (50) with a step-cool temperature program: denaturation at 85°C for 10 min, followed by 1.5 h incubation at 62°C, 1.5 h incubation at 52°C and finished with a cooling to 10°C within 10 min.
Measurement protocol
All experiments were performed using a dual-beam force measuring optical trap (37,38) at 25±1°C in buffers containing 100 mM Tris–HCl (pH 8.1), 1mM EDTA and NaCl concentrations of 0, 100, 500 and 1000 mM, or in buffers containing 100 mM Tris–HCl (pH 8.1) and MgCl2 concentrations of 0.01, 0.1, 0.5, 1, 4 and 10 mM. The monovalent cation concentration [Mon+] includes the contributions from [Na+] ions and dissociated [Tris+] ions. At 25°C and pH 8.1, about half of the Tris molecules are protonated, therefore 100 mM Tris buffer adds 50 mM to the total monovalent ion concentration (51). Anti-digoxigenin polyclonal antibody-coated polystyrene microspheres (AD beads) of 3.0–3.4 μm (Spherotech, Libertyville, IL, USA) were incubated at room temperature with the molecular construct for 20 min. The second attachment was achieved inside the microfluidics chamber using a single optically trapped AD bead previously incubated with the RNA hairpin and a streptavidin-coated polystyrene microsphere (SA bead) of 2.0–2.9 μm (G. Kisker GbR, Products for Biotechnologie) positioned at the tip of a micropipette by suction (Figure 1A and B).
Figure 1.
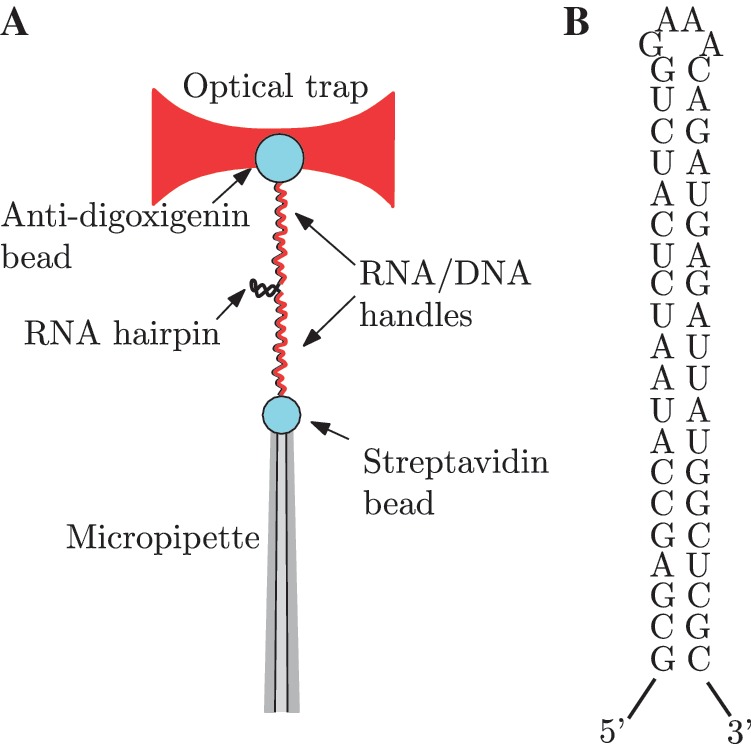
Experimental setup and RNA sequence. (A) A single RNA hairpin is attached to two polystyrene microspheres through RNA/DNA heteroduplexes used as handles. The anti-digoxigenin antibody-coated microsphere is optically trapped while the streptavidin-coated microsphere is positioned at the tip of a micropipette by air suction. (B) RNA hairpin sequence.
Tethered molecules were repeatedly pulled at two constant loading rates of 1.8 pN/s or 12.5 pN/s by moving up and down the optical trap along the vertical axis between fixed force limits and the resulting force-distance curves (FDCs) were recorded (Figure 2A). A pulling cycle consists of an unfolding process and a folding process. In the unfolding process, the tethered molecule is stretched from the minimum value of force, typically in the range of 5–10 pN, where it is always at its native folded state, up to the maximum value of force, typically in the range of 25–30 pN, where the molecule is always unfolded. In the folding process the molecule is released from the higher force limit (unfolded state) up to the lower force limit (native folded state) (52). A minimum of two molecules (different bead pairs) were tested at each ionic condition, and a minimum of 100 cycles were recorded in each case (detailed statistics are given in Section S1 of the Supplementary Data).
Figure 2.
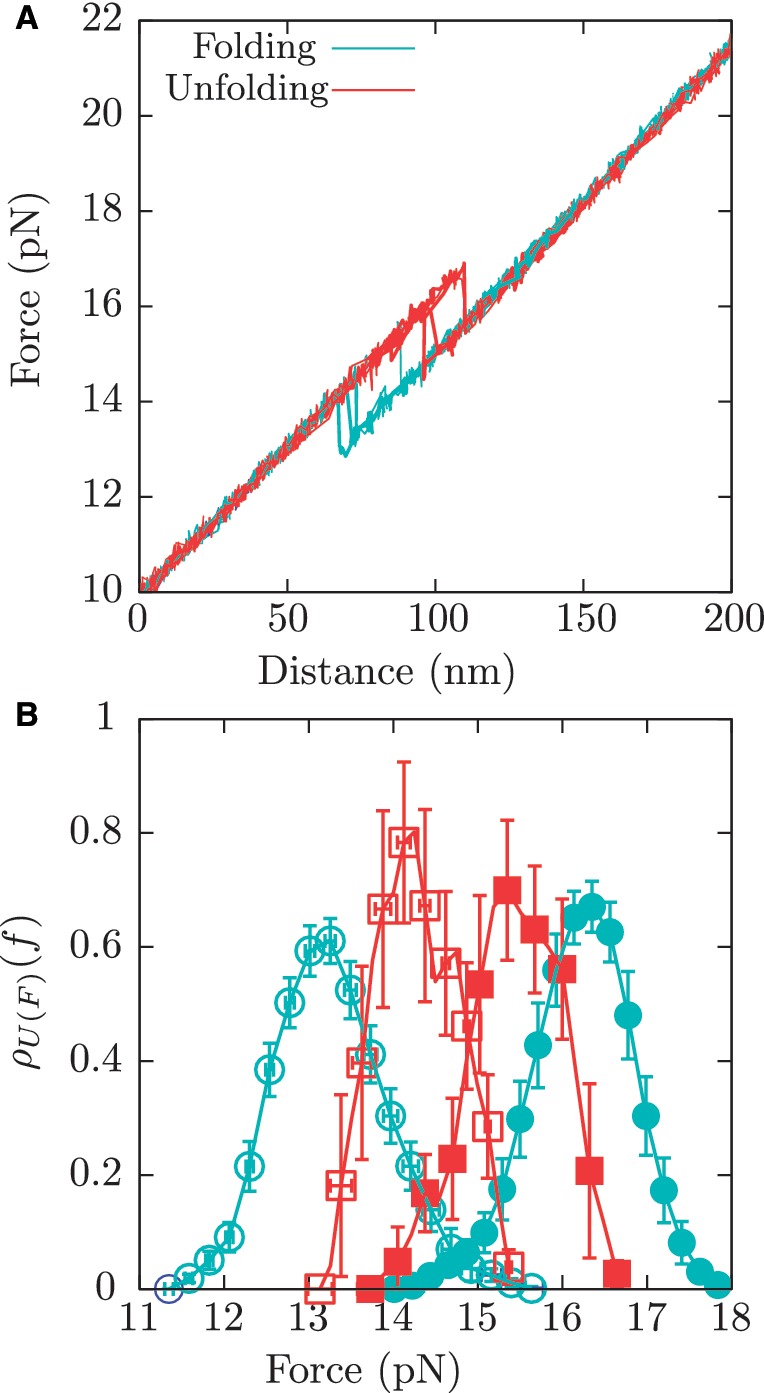
Pulling experiments. (A) A few pulling cycles for the RNA hairpin showing the unfolding (red) and folding (blue) trajectories. (B) Experimental distribution for the unfolding first rupture forces at 1.8 pN/s (red filled squares) and 12.5 pN/s (blue filled circles), and for the folding first rupture forces at 1.8 pN/s (red empty squares) and 12.5 pN/s (blue empty circles).
Hairpin model
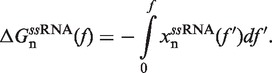
Under applied force it is feasible to reduce the configurational space of an RNA hairpin containing N base pairs (bps) to a minimum set of N + 1 partially unzipped RNA structures (36,53,54). Each configuration in this set contains n adjacent opened bps in the beginning of the fork followed by N − n closed bps, with 0 ≤ n ≤ N. The folded state (F) is defined as the configuration in which n = 0 (all bps are formed), and the unfolded state (U) is the hairpin configuration in which n = N (all bps are dissociated). Based on a simple calculation (see Section S2 of the Supplementary Data) we conclude that fraying (55) plays a rather minor role (if any) on the folding/unfolding kinetics of the sequence under study (Figure 1A) and we do not include it in our analysis. The stability of each configuration n with respect to the F conformation is given by ΔGn(f), the free energy difference a given force f between the duplex containing N − n closed bps and the completely closed configuration (F state),
| (1) |
In Equation 1 ΔGn(0) is the free energy difference at zero force between a hairpin in the partially unzipped configuration n and a hairpin in the completely closed configuration;  is equal to the reversible work needed to stretch the ssRNA strands of the hairpin in configuration n (2n opened bases) from a random coiled state to a force-dependent end-to-end distance xn(f); and
  is the contribution related to hairpin stem orientation (56,57). An estimation of ΔGn(0) at 1M [Mon+] can be obtained by using the nearest-neighbor (NN) energy parameters widely employed to predict the stability of RNA secondary structures (15,19). It is given by the sum of the stacking contributions of the duplex region, containing N − n bps. The elastic term
  is given by (56):
 |
(2) |
The molecular extension of ssRNA,  , can be estimated using polymer theory (see following section). Finally, the last term in Equation 1,
  , is equal to the free energy of orientation of a monomer of length d0 along the force axis (57):
| (3) |
where f is the applied force, kB is the Boltzmann constant, T is the bath temperature and d0 is the diameter of a double stranded chain, taken equal to 2 nm.
Elastic models of ssRNA
To model the elastic response of ssRNA we employed both the interpolation formula for the inextensible Worm Like Chain (WLC) model and the Freely Jointed Chain (FJC) model, which give the equilibrium end-to-end distance x of a polymer of contour length ln stretched at a given force f. These models have been mainly tested for long polymers. However, several studies indicate that they are generally applicable when the contour length is larger than the persistence length. The inextensible WLC is given by:
| (4) |
where kB is the Boltzmann constant, T is the bath temperature and P is the persistence length (58,59). The FJC model is given by
| (5) |
where b is the Kuhn length.
There are other models, such as the Thick Chain, that are more general than the WLC or the FJC and that have been used to fit the elastic response of biopolymers. Despite of their greater complexity, we do not expect a qualitative improvement of our results by using them.
Kinetic analysis
We applied Kramers rate theory (60) to study the kinetics of the transition between states F and U. The framework for understanding the effect of an external force on rupture rates was first introduced in (61) and extended to the case where the loading force increases with time (62,63). The assumption that the transition state does not move under an applied force f can be relieved by considering that the effective barrier that must be crossed by a Brownian particle is force dependent, Beff(f). The unfolding and folding rates can be obtained as the first passage rates over the effective barrier,
| (6a) |
| (6b) |
In Equation 6, F was selected as the reference state and ΔGN(f) has been defined in Equation 1. k0 is the attempt rate for activated kinetics. The effective barrier Beff(f) can be obtained analytically from Kramers rate theory (KT) (64,65) (detailed derivation provided in the Section S3 of Supplementary Data) as
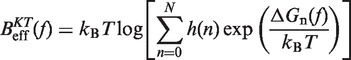 |
(7) |
with  . Importantly, the location of the barrier along the reaction coordinate can be obtained from the first derivatives of Beff(f) with respect to force,
| (8a) |
| (8b) |
where  and
and  are the distances from the effective barrier to the F and U states, respectively. The force-dependent fragility parameter μ(f) (36),
 |
(9) |
lies in the range [−1:1] and is a measurement of the compliance of a molecule under the effect of tension. Compliant structures deform considerably before the transition event and are characterized by positive values of μ(f), i.e. 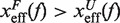 . In contrast, brittle structures are defined by negative values of μ(f),
 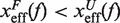 . A given sequence can display different fragilities at different force regimes, due to changes in the location of the transition state (TS) with force.
From the measured transition rates (see following section) we can get estimators for the effective barrier  for unfolding and folding using the expressions in Equation 6:
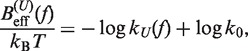 |
(10a) |
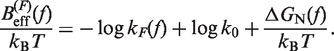 |
(10b) |
By comparing the experimental estimators of the kinetic barrier  with the effective barrier
  as predicted by Kramers rate theory (Equation 7) we can extract the free energy of formation of the hairpin ΔGN(0), the attempt rate k0 and the parameters that characterize the elastic response of the ssRNA (36). While k0 always can be determined by doing this comparison, there is a trade-off between the contributions of the elastic response of the ssRNA and the free energy of formation of the hairpin. Although this is not strictly true (the stretching contribution term is force dependent whereas the free energy of formation term is not) it holds to a very good degree. Therefore, if only the free energy of formation of the hairpin is known a priori, then we can extract the elastic properties of the ssRNA by matching Equation 10a and b with Equation 7. On the contrary, if we only know the elastic properties of the ssRNA, then we can extract the free energy of formation of the hairpin (see Section S4 of the Supplementary Data).
Data analysis
The molecular transitions during unfolding and folding can be identified as force rips in a FDC (56). In order to extract the unfolding and folding rates (Equations 6a and b) from experiments we have collected the first rupture forces associated with the unfolding and folding parts of each pulling cycle (Figure 2A and B). By plotting the number of trajectories in which the molecule remained at the initial configuration (F state during the stretching part and U state in the releasing part of the cycle) as a function of force N(fi), divided by the total number of trajectories N0, we obtained experimental estimators for survival probabilities PU/F(fi) = N(fi)/N0 of the U and F states. Moreover, we obtained an experimental estimator for the probability densities ρU/F(f) of unfolding and folding first rupture forces by doing normalized histograms of both data sets (ρU/F(f) = ΔN/(Δf × N0), where ΔN is the number of events in the range between f and f + Δf). The survival probabilities are related to ρU(F)(f) by the following equations,
 |
(11a) |
 |
(11b) |
If we assume a two-state transition, the time evolution of the survival probabilities is described by the following master equations (66):
| (12a) |
| (12b) |
With this assumption and the experimental estimators for survival probabilities and densities, it is possible to extract the transition rates kU(F)(f) from rupture force measurements using kU(F)(f) = −rρU(F)(f)/PU(F)(f), with r being the pulling speed (36,56,66).
Salt corrections
It is interesting to experimentally measure the effect of salt on the free energy of formation of nucleic acid hairpins. However, UV absorbance experiments cannot be carried out for this particular sequence because its melting temperature is too high to obtain reliable results (see Section S5 of the Supplementary Data). Therefore, as mentioned in the ‘Hairpin model’ section, the estimation of the free energy of formation of the RNA hairpin at 1M [Mon+] is obtained using the NN energy parameters proposed by refs. (15,19). To introduce the effect of monovalent salt concentration [Mon+] we assume a sequence-independent correction g1([Mon+]) for the free energy of formation of one base pair. As the free energy is measured relative to the F state we get for the free energy correction of a hairpin with n unzipped bps:
| (13) |
where  corresponds to the free energy of formation of the n-th configuration at 1000 mM [Mon+] at zero force. In the case of mixed monovalent/Mg2+ conditions we add a second sequence-independent correction term g2([Mon+]) that captures the effect of Mg2+ ions on the hairpin free energy of formation:
| (14) |
In what follows, unless stated otherwise, all monovalent and divalent salt concentrations [Mon+], [Mg2+] are expressed in mM units.
RESULTS
Effect of force on thermodynamics and kinetics of an RNA hairpin
We pulled the RNA hairpin at loading rates of 1.8 pN/s and 12.5 pN/s in buffers containing different ionic conditions (see ‘Measurement protocol’ section). From the unfolding and folding FDC we measured the first rupture forces along many cycles. The resulting probability distributions at each pulling speed and ionic condition can be found in the Section S6 of Supplementary Data. As previously observed (36), this hairpin displays a two-state behavior, with force jumps signaling the transition between F and U states (Figure 2A) and with no evidence of fraying or intermediate states (see Section S2 of the Supplementary Data).
The order of magnitude of the resulting rupture forces and hysteresis effects are compatible with previous force-melting experiments carried out for other simple nucleic acid structures, like P5ab and TAR RNA hairpins (31–33) or short DNA hairpins (55). Moreover, results at 1 M [Na+] were in significant agreement with solution predictions (15,73). As expected, hysteresis effects strongly depend on the loading rate, being lower at 1.8 pN/s and higher at 12.5 pN/s. This can be seen in the experimental distributions of unfolding and folding first rupture forces (Figure 2B), which are closer for pulling cycles performed at 1.8 pN/s.
Experiments at different monovalent cation concentrations
We performed pulling experiments at four different NaCl concentrations (see ‘Measurement protocol’ section). We find that the RNA duplex stability increases at higher [Mon+] concentrations. For instance, rupture force distributions are displaced to higher forces (Figure 3A) as we increase the concentration of NaCl. The greater duplex stability at higher salt concentrations can also be observed as an increase in the mean rupture force with the logarithm of the salt concentration (Figure 3B). The standard deviation of rupture unfolding (folding) forces, that are known to be proportional to  (56), remain almost constant along the salt range explored. That might denote that the position of the TS mediating the unfolding and the folding transitions does not depend on [Mon+], despite the fact that both transitions occur at higher forces. In Figure 3C, we see that the unfolding (folding) kinetic rates decrease (increase) with the salt concentration, which again shows the stabilizing effect of salt on the RNA hairpin.
Figure 3.

Kinetic analysis of experiments at varying [Mon+]. (A) Experimental distribution of the unfolding rupture forces in buffers containing 50 mM (red), 150 mM (green), 550 mM (blue) and 1050 mM (magenta) [Mon+]. These experiments were done at a loading rate of 1.8 pN/s. (B) Average rupture forces 〈fU(F)〉 and standard deviations σU(F) as a function of monovalent cation concentration at loading rates of 1.8 pN/s (red) and 12.5 pN/s (blue). Filled symbols refer to unfolding and empty symbols to folding. (C) Log-linear plot of the transition rates versus force. Experiments were done at 50 mM [Mon+] for loading rates of 1.8 pN/s (dark red) and 12.5 pN/s (red), at 150 mM [Mon+] for loading rates of 1.8 pN/s (dark green) and 12.5 pN/s (green), at 550 mM [Mon+] for loading rates of 1.8 pN/s (dark blue) and 12.5 pN/s (blue), and at 1050 mM [Mon+] for loading rates of 1.8 pN/s (dark violet) and 12.5 pN/s (magenta). (D) Dependence of the effective barrier Beff(f) on force at different [Mon+]. Color code as in (C).
Experiments at 1M NaCl
From the current set of NN energy parameters for RNA secondary structures obtained at 1000 mM NaCl concentration we can predict the free energy of formation ΔGN(0) for the RNA hairpin at this particular condition using the mfold server (18,21,67,68). We get  kBT (although our experiments were performed at 1050 mM of monovalent salt, we do not expect significant differences by comparing with the prediction at 1000 mM). By applying the kinetic method introduced in ‘the Kinetic analysis’ section we can evaluate the kinetic barrier associated to the unfolding reaction
  and
and  for a given elastic model for the ssRNA and find the one for which the theoretical prediction by Kramers rate theory (Equation 7) best matches the experimental results (Equation 10). The procedure is shown in Figure 4A and explained in the Section S4 of the Supplementary Data. We found the best fit to our data using the inextensible WLC model with persistence length P = 0.75±0.05 nm and interphosphate distance a = 0.665 nm/base. The free energy of formation obtained is equal to ΔGN(0) = 65.3±0.3 kBT, in reasonable agreement with the aforementioned value for
  .
.
Figure 4.

Determination of the salt correction parameter m. Experimental evaluation of the sequence-independent correction parameter m from g1([Mon+]) = m log([Mon+]/1000) using Equation 10. Estimators of  obtained experimentally (Equation 10) were compared with the expected
  (Equation 7) profiles for different values of m (0, 0.1, 0.2, 0.3, 0.4 and 0.5 from top to bottom). Red (green) points are the experimental estimators
  at a pulling rate of 12.5 (1.8) pN/s. Blue (magenta) points are the experimental estimators of
  at a pulling rate of 12.5 (1.8) pN/s. Light blue lines are the
  profiles for values of m not matched, and black lines are the experimental estimators of Beff(f) that match with experiments. Application of the method to experiments done at 1050 mM [Mon+] (A), 550 mM [Mon+] (B), 150 mM [Mon+] (C), and 50 mM [Mon+] (D).
Selection of elastic parameters: experiments with monovalent salts
In order to know ΔGN(0) at monovalent ionic conditions different from 1050 mM we need to know the effect of salt on the elastic contribution of ssRNA strands. The elastic behavior of single-stranded RNA (poly-U) has been studied in single-molecule stretching and fluorescence experiments carried out at various [Na+] concentrations (69–71). Despite the extremely different contour length of the molecules under consideration [we are dealing with 44 bases-long chain in contrast to a polynucleotide of 1500–4000 bases in ref. (70)], we take the values for the persistence length P proposed in previous stretching experiments and add our value obtained at 1050 mM. We assume that the elastic properties of ssRNA strands are independent of sequence, which can lead to a small error in the values obtained for the elastic properties of ssRNA strands in the case of sequence-dependent behavior. In fact, a sequence-dependent elastic behavior for ssDNA strands was previously considered as a possible explanation for the specific salt corrections found for the NN energy values obtained from unzipping experiments (37). In the inset of Figure 5 we plot the persistence lengths versus the monovalent salt concentration. To fit the data, we employ the following dependence of P on the Debye screening length  ,
,
| (15) |
Figure 5.
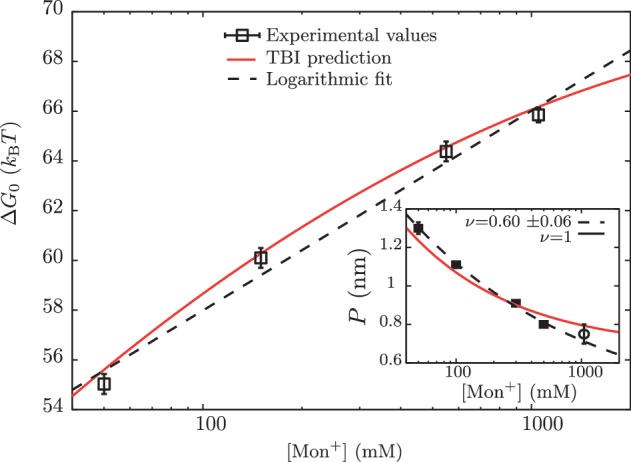
Free energy of formation of the RNA hairpin as a function of [Mon+]. Main panel: free energy obtained experimentally (squares), using the logarithmic dependence with salt concentration given by g1([Mon+]) (dashed line) and using the TBI model (continuous line) Inset: persistence lengths P obtained from the application of the Thick Chain model to published experimental data for poly-U RNA stretching in buffers containing 5, 10, 50, 100, 300 and 500 mM of [Na+] (squares) (69,70). We have included the value of the persistence length P that we obtained in this study at 1050 mM [Mon+] (empty circle). Two different fits to data were done from Equation 15: a fixed value ν = 1 (red) and ν as free parameter ν = 0.60±0.06 (blue).
No unique scaling law can be derived, as the value of ν can be 1, 2 or <1, depending on the polymer properties (72). We can fit all data using ν = 1 but also letting ν be a free parameter, which results in a value of ν = 0.6±0.06. We then interpolate both fits, in order to infer the values of P in our experimental conditions of [Mon+] concentration (50, 150, 550 and 1050 mM), as shown in Table 1.
Table 1.
Parameters obtained from experiments at different [Mon+]
| [Mon+] (mM) | P (nm) | log k0 (1/s) | ΔGN(0) (kBT) |
|---|---|---|---|
| 1050 | 0.75±0.05 | 10.9±0.4 | 65.1±0.3 |
| 550 | 0.82±0.02 | 10.5±0.4 | 64.0±0.4 |
| 150 | 1.01±0.01 | 11.3±0.5 | 59.4±0.4 |
| 50 | 1.27±0.03 | 12.4±0.4 | 54.0±0.4 |
ssRNA persistence length P, log k0, and free energy of formation (ΔGN(0)) for the RNA hairpin at different monovalent ion concentrations.
Monovalent salt correction to the free energies of formation of the RNA hairpin
Having obtained the elastic parameters that allow us to appropriately describe the elastic response of ssRNA strands at different [Mon+] concentrations, we still need to characterize the effect of salt on the energies of formation of the RNA hairpin at each intermediate configuration n. It is generally assumed a sequence-independent correction to the free energies of formation of nucleic acids duplexes (73–75). However, we have previously shown that a sequence-dependent salt correction to the NN energy parameters of DNA improves the free energy prediction of both unzipping and melting experiments (37). Related to this, it has been found that cation concentration affects RNA stability in a sequence-dependent manner (76). In the absence of RNA sequence-specific parameters available, we adopted a sequence-independent salt correction (Equation 13) given by g1([Mon+]) = m log([Mon+]/1000), where [Mon+] is expressed in mM units. As we will see, there are experimental and theoretical evidences that support the logarithmic effect of monovalent ions to the stability of nucleic acid hairpins.
Using this correction, the variation of ΔGn(0) with monovalent salt concentration depends strictly on the value of the constant m. In order to derive m from our data, we compared the estimators of Beff(f) obtained experimentally ( and
and  in Equation 10) with the theoretical prediction (
 in Equation 7) at different values of m. In Figure 4A–D, we see the correspondence between theory and experiments at each monovalent ion concentration. For all salt concentrations, we found the best agreement at m = 0.10±0.01 kcal/mol. This value agrees with the sequence-independent salt correction reported for DNA duplex oligomers in melting experiments, m = 0.110±0.033 kcal/mol (73,77), and in unzipping experiments of polymeric DNA, m = 0.104±0.010 kcal/mol (37). Figure 3D summarizes all the results. At a given force we see that the height of the kinetic barrier increases with salt concentration, which again indicates that salt increases kinetically the stability of the RNA structure.
In Figure 5 we show the dependence of the measured ΔGN(0) of the RNA hairpin on the monovalent ion concentration. As expected from earlier observations on DNA (39,78,79) and from the application of counterion condensation theory to interpret polyelectrolyte effects on equilibrium involving highly charged, locally rod-like polyelectrolytes (40,80–82), we observe an approximately linear dependence of RNA duplex stability on the logarithm of monovalent salt concentration. Interestingly, our data can also be well described by the empirical expressions derived in refs. (43–45), where the TBI model is used to predict the hairpin free energies at different ionic conditions (see Section S7 of Supplementary Data).
By deriving the effective barrier as a function of force we can measure the distance of the TS to the F and U states,  and
and  (Equation 8a and b), and the fragility μ(f) of the molecule as a function of the applied force (Equation 9). Figure 6 shows the two extreme cases with 50 and 1050 mM [Mon+] (continuous and dashed lines, respectively). In Figure 6A we observe that the location of the TS changes as a function of force. The same trend is observed for the fragility in panel B, where the experimentally measured points, the predicted force-dependent fragility (black curves) and the expected values of the fragility for all possible locations n of the TS along the stem of the hairpin are represented (horizontal grid, right scale). At low forces, the TS is located near the loop, n = 19±1 (Figure 6A, dark gray curves). At intermediate forces that depend on salt concentration the TS moves to the stem region n = 6±1 (Figure 6A, gray curves). At large forces the TS has disappeared. These results are in agreement with previous findings using the same hairpin sequence (36). Moreover, we see that at higher monovalent salt concentrations the locations of the different TS mediating unfolding and refolding are the same (n ≃ 18, 6 or 0 for low, intermediate and high forces, respectively) but shifted to larger forces. These results agree with the Hammond's postulate (83): at increasing [Mon+] the F state is increasingly stabilized while the TS is shifted towards the U state; simultaneously, as force increases the TS approaches the F state.
Figure 6.
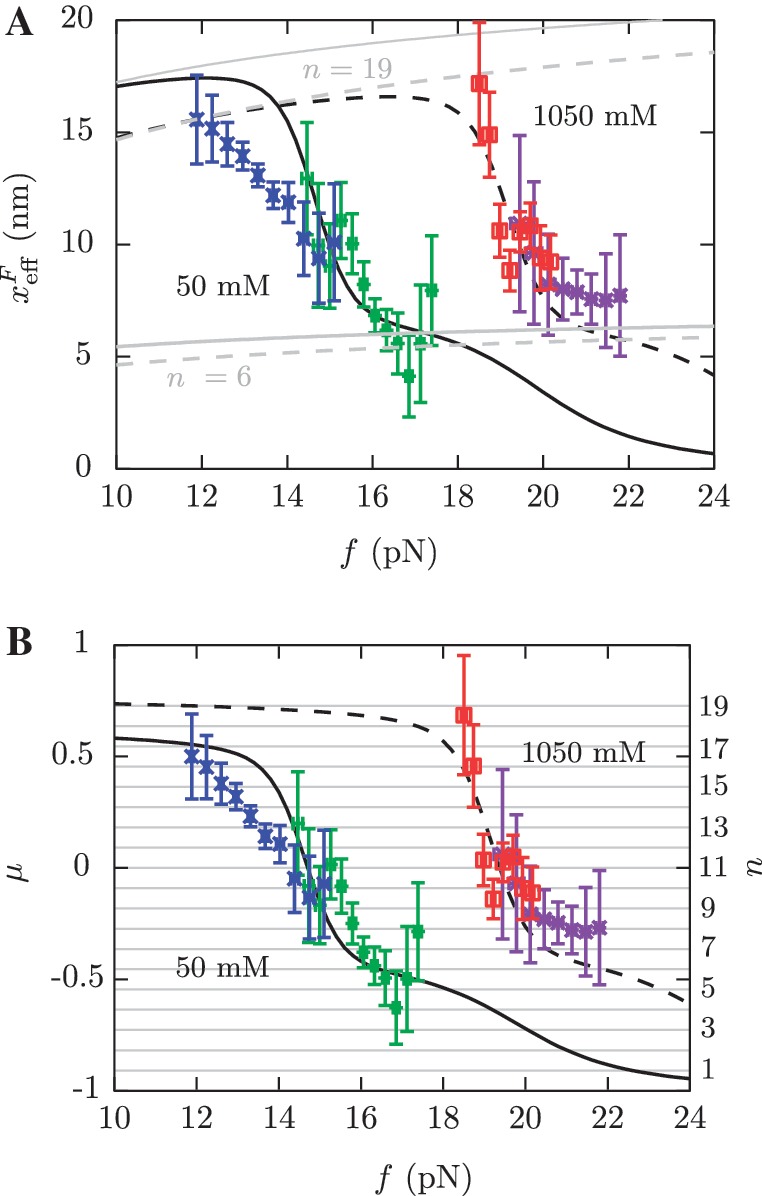
Barrier location and mechanical fragility at 50 mM and 1050 mM [Mon+]. (A) Force-dependence of the barrier position measured with respect to the F state,  . Continuous gray line is the WLC prediction of the molecular extension when n = 19 or n = 6 bps are unzipped at 50 mM [Mon+], and dashed gray line corresponds to the WLC prediction when n = 19 or n = 6 bps are unzipped at 1050 mM [Mon+]. As seen, at an intermediate value of forces n = 6 coincides with the TS for both ionic conditions. (B) Dependence of fragility μ(f) with force. Gray lines indicate the value of the fragility for different locations n of the TS along the stem. Continuous black lines are the theoretical prediction using Kramers rate theory for data at 50 mM [Mon+], and dashed black lines for data at 1050 mM [Mon+]. Blue and green points are the experimental evaluation of
  and μ(f) for folding and unfolding data collected at 50 mM [Mon+]. Red and purple points are the experimental evaluation for folding and unfolding at 1050 mM [Mon+].
Experiments in mixed monovalent/Mg2+conditions
We have also performed pulling experiments in mixed monovalent/Mg2+ buffers, containing a fixed concentration of Tris+ ions (50 mM) and varying concentrations of Mg2+(see ‘Measurement Protocol’ section). The rupture force distributions for all mixed monovalent/Mg2+ conditions can be found in Section S6 of the Supplementary Data. We found two regimes in the behavior of the average rupture forces for unfolding and folding processes along the range of [Mg2+] experimentally explored. Below 0.1 mM [Mg2+], there is no significant difference between control (no Mg2+ added) and magnesium-containing conditions (Figure 7A and B). However, at higher magnesium concentrations, we found a linear dependence of average rupture forces with the logarithm of [Mg2+] (Figure 7A and 7B). Interestingly, Owczarzy et al. (51) have made a similar observation in DNA melting experiments done in mixed monovalent/Mg2+ conditions. They found that the ratio  (both salts in molar units) is a convenient parameter to determine whether divalent or monovalent ions are dominant on duplex stability. If R is less than 0.22, then monovalent ions are dominant and the presence of Mg2+ can be ignored. In our experiments, R = 0.0632 and R = 0.2 for the 0.01 mM and 0.1 mM [Mg2+] conditions, respectively. As in the case of pure monovalent ion conditions, the standard deviation of rupture forces remains almost constant and we also observed a linear dependence of log kU(f) and log kF(f) on the applied force for the different [Mg2+] tested (Figure 7C).
Figure 7.

Kinetic analysis of experiments at varying [Mg2+]. (A) Experimental distribution of the unfolding rupture forces in buffers containing 0.00 mM (red), 0.01 mM (green), 0.1 mM (blue), 0.5 mM (magenta), 1 mM (cyan), 4 mM (orange) and 10 mM (black) of [Mg2+] and 50 mM of monovalent cations. These experiments were done at a loading rate of 1.8 pN/s. (B) Average rupture forces 〈fU(F)〉 and standard deviations σU(F) obtained in experiments done at different [Mg2+] and at loading rates of 1.8 pN/s (red) and 12.5 pN/s (blue). Filled symbols refer to unfolding and empty symbols to folding. (C) Log-linear plot of the transition rates versus force. Experiments were done at 0.00 mM [Mg2+] for loading rates of 1.8 pN/s (dark red) and 12.5 pN/s (red), at 0.01 mM [Mg2+] for loading rates of 1.8 pN/s (dark green) and 12.5 pN/s (green), at 0.1 mM [Mg2+] for loading rates of 1.8 pN/s (dark blue) and 12.5 pN/s (blue), at 0.5 mM [Mg2+] for loading rates of 1.8 pN/s (dark violet) and 12.5 pN/s (magenta), at 1 mM [Mg2+] for loading rates of 1.8 pN/s (dark cyan) and 12.5 pN/s (cyan), at 4 mM [Mg2+] for loading rates of 1.8 pN/s (dark orange) and 12.5 pN/s (orange), and at 10 mM [Mg2+] for loading rates of 1.8 pN/s (gray) and 12.5 pN/s (black). (D) Dependence of the effective barrier Beff(f) on force at different [Mg2+]. Color code as in (C).
In order to obtain the free energy of formation ΔGN(0) of the RNA hairpin at different magnesium concentrations, we employed the empirical expression derived in refs. (44,45) by applying the TBI model to predict the RNA helix stability in mixed monovalent/Mg2+ ionic conditions (see Figure 9, inset). Using this mixed salt correction, it is possible to obtain the sequence-independent correction of one base pair g2([Mg2+]) at any mixed salt condition using Equation 14:
 |
(16) |
Figure 9.
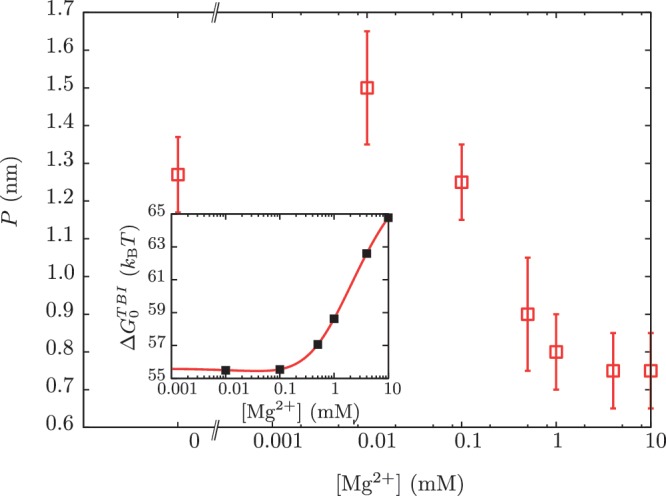
Dependence of the persistence length P on [Mg2+]. Main panel: experimental persistence length versus [Mg2+]. Inset: dependence of the free energy of formation of the RNA hairpin  on [Mg2+] with fixed 50 mM [Mon+] obtained using the TBI model (44,45). Black points are the values of the free energy of formation that we used for our analysis.
From this expression, we can extract the value of 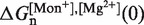 in Equation 14 for any intermediate state n. By varying the mixed salt-dependent values for the persistence length P of the ssRNA for each [Mg2+], we can now determine the value of P that results in better agreement between the predicted effective barrier
  and our experimental estimations (Figure 8 and Section S4 of Supplementary Data). All the results are summarized in Figure 7D, where we can see that the stability of the hairpin increases with magnesium concentration. The dependence of P on [Mg2+] is shown in Figure 9. Table 2 summarizes the results obtained for the persistence length P and the attempt frequency k0. The position of the TS varied with [Mg2+] in a way similar to what we found for [Mon+]. In a specified force the TS mediating the unfolding and folding transitions is shifted toward the U state as the [Mg2+] is raised (Figure 10A), in agreement with the Hammond's postulate (83). The force-dependence of the position of the TS with respect to the F state
  and the hairpin fragility μ(f) are similar in both monovalent and mixed ionic conditions (Figures 6 and 10). At low forces the TS is located near the loop, whereas at intermediate forces it is located in the stem region n = 6±1 (Figure 10A and B).
Figure 8.

Determination of the persistence length of ssRNA at varying [Mg2+]. Estimators of  obtained experimentally were compared with the expected
  profiles for different values of P (0.5, 0.6, 0.7, 0.8, 0.9, 1.0, 1.1, 1.2, 1.3, 1.4 and 1.5 nm from top to bottom) using Equation 7 and Equation 10. Red (green) points are the experimental estimators
  at a pulling rate of 12.5 (1.8) pN/s. Blue (magenta) points are the experimental estimators of
  at a pulling rate of 12.5 (1.8) pN/s. Light blue lines are the
  profiles for values of m not matched, and black lines are the experimental estimators of Beff(f) that match the experiments. Application of the method for experiments done at 0.01 mM [Mg2+] (A), 0.1 mM [Mg2+] (B), 0.5 mM [Mg2+] (C), 1 mM [Mg2+] (D), 4 mM [Mg2+] (E) and 10 mM [Mg2+] (F).
Table 2.
Parameters obtained for experiments at different [Mg2+]
| [Mg2+] (mM) | P (nm) | log k0 (1/s) |
 (kBT) (kBT) |
g2 (kcal/mol) |
|---|---|---|---|---|
| 0.00 | 1.27±0.03 | 12.40±0.40 | 55.58 | 0.000±0.005 |
| 0.01 | 1.50±0.15 | 12.05±0.30 | 55.50 | −0.007±0.005 |
| 0.10 | 1.25±0.10 | 11.45±0.30 | 55.55 | −0.005±0.005 |
| 0.50 | 0.90±0.15 | 11.50±0.30 | 57.06 | 0.0393±0.005 |
| 1.00 | 0.80±0.10 | 11.40±0.50 | 58.63 | 0.0858±0.005 |
| 4.00 | 0.75±0.10 | 11.15±0.50 | 62.60 | 0.2033±0.005 |
| 10.0 | 0.75±0.10 | 10.40±0.50 | 64.77 | 0.2678±0.005 |
Persistence length for ssRNA P, log k0, theoretical predictions for the free energies of formation based on the TBI model,  , and sequence-independent correction g2([Mg2+]) for the RNA hairpin at different magnesium concentrations. A fixed concentration of 50 mM [Mon+] was used in all ionic conditions.
Figure 10.
Barrier location and mechanical fragility at 0.01 mM and 10 mM [Mg2+]. (A) Force-dependence of the barrier position measured with respect to the F state,  . Continuous gray line is the WLC prediction of the molecular extension when n = 19 or n = 6 bps are unzipped at 0.01 mM [Mg2+], and dashed gray line corresponds to the WLC prediction when n = 19 or n = 6 bps are unzipped at 10 mM [Mg2+]. At an intermediate range of force the TS coincides with n = 6 for both ionic conditions. (B) Dependence of fragility μ(f) at 0.01 mM and 10 mM [Mg2+]. Gray lines indicate the value of the fragility for different locations n of the TS along the stem. Continuous black lines are the theoretical prediction using Kramers rate theory for data at 0.01 mM [Mg2+], and dashed black lines for data at 10 mM [Mg2+]. Blue and green points are the experimental evaluation of
  and μ(f) for folding and unfolding data collected at 0.01 mM [Mg2+]. Red and purple points are the experimental evaluation for folding and unfolding at 10 mM [Mg2+].
DISCUSSION
The effect of monovalent ion concentration on DNA stability has been extensively studied and there is a variety of empirical salt corrections available in the literature (84,85). There is no general agreement about the accuracy and limitations of use of salt corrections in terms of sequence length and range of salt concentrations (84). Recently, we have reported 10 NN salt correction parameters for prediction of DNA duplex stability derived from single-molecule experiments (37). However, there is no equivalent study on RNA duplexes and the experimental data available for the salt effects on RNA duplex stability are limited to short sequences that display a two-state behavior (76). Different polyelectrolyte theories try to characterize the interaction between counterions and nucleic acids to study ionic effects to the molecular stability. The most accepted are mean field theories such as the Poison–Boltzmann and the counterion condensation theories (80,81). Recently, the TBI model has been proposed (43). It incorporates correlation and fluctuation effects for bound ions, and has been extended to treat RNA helices under mixed monovalent/divalent salt conditions (44,45). It was shown that the TBI improves the prediction of the stabilities of RNA duplexes smaller than 15 bp (44,86).
Here, we performed a detailed characterization of the effect of monovalent and mixed monovalent/magnesium concentrations on the stability of a RNA hairpin containing a stem of 20 bp by mechanically unfolding and folding the molecule using optical tweezers. The results we have obtained can be very well described by the empirical formulas derived from the TBI model for predicting the stabilities of RNA hairpins in monovalent ion and mixed monovalent/Mg2+ buffer conditions. A comparison of the counterion condensation theory (87) is provided in the Section S8 of Supplementary Data, and although an acceptable accuracy is found at monovalent salt conditions, we observe that correlation effects become important in the presence of Mg2+ ions and therefore the TBI gives improved predictions.
When a hairpin is melted mechanically the U state is subjected to a tension. In standard optical melting and calorimetric experiments, the U state is under zero force. Therefore, to appropriately compare both phenomena, it is necessary to discount the energy required to stretch the single-stranded unfolded state in mechanical experiments. However, we have limited information about the elastic properties of single-stranded RNA as compared with DNA. Despite the chemical similarity between both polymers, the RNA-specific 2′-OH group favors a conformationally restricted C3′—endo structure (88). Moreover, in previous single-molecule studies (69,71), the elastic response of a single-stranded poly-U RNA was better described by a WLC model rather than by a FJC model. Based on these considerations, we decided to use the numbers derived from single-molecule stretching experiments for the elastic behavior of ssRNA molecules (as explained in the ‘Experiments at different monovalent cation concentrations’ section) to appropriately account for the energetic contribution of stretching the ssRNA strands during mechanical unfolding.
By applying the Kramers rate theory and correctly accounting for the elastic contribution of ssRNA stretching we were able to obtain the free energy of formation of the RNA hairpin from pulling experiments done in non-equilibrium conditions. This allowed us to obtain a large number of trajectories at different ionic conditions in a feasible timescale. In this way, we obtained the effective barrier of the unfolding reaction as a function of force for different ionic conditions.
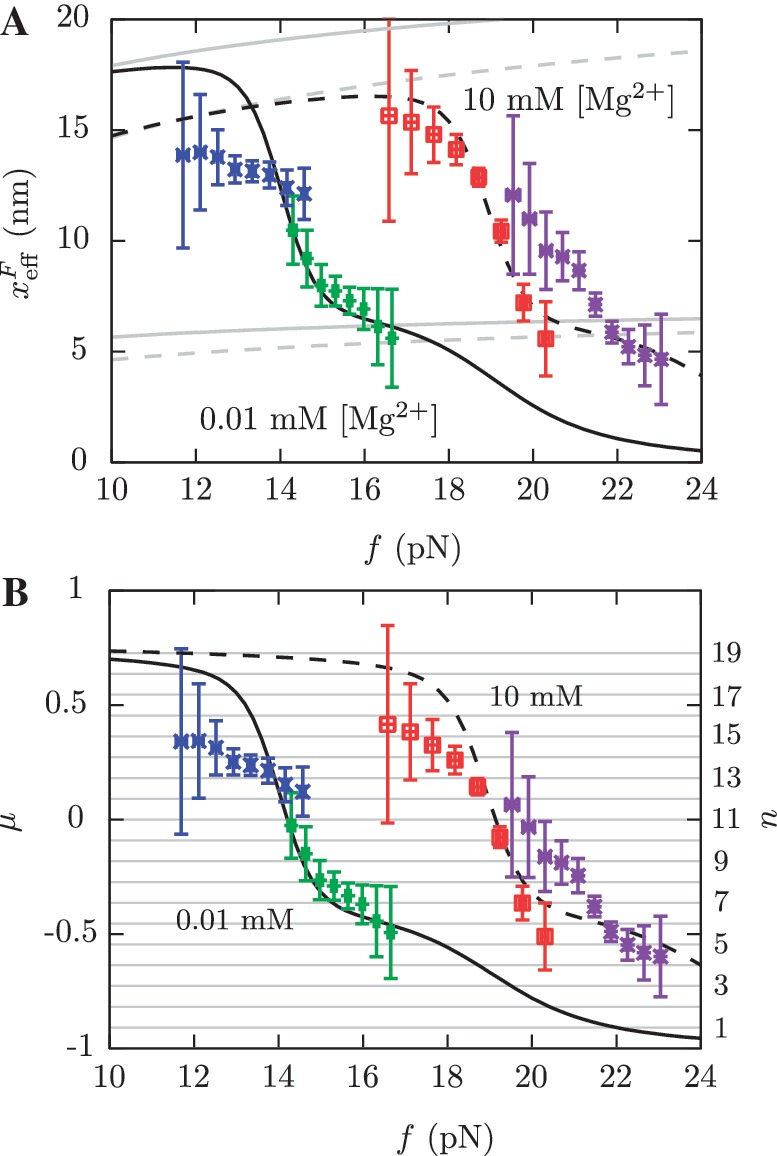
The ability of Mg2+ ions to stabilize RNA structures at much lower concentrations than monovalent ions was recognized almost 40 years ago (89). In fact, by plotting the values of the free energies of formation versus salt concentration (expressed in mM units) we can collapse data for both types of salt into a single master curve by multiplying [Mg2+] by a factor 100 (Figure 11A). This effect has been previously observed (24,46,47,90,91) and can be explained using the counterion condensation theory that accounts for strong correlations between counterions and polyelectrolytes (46,81,82,92). A similarity (but not a data collapse) is obtained for the persistence length values of ssRNA (Figure 11B). It can be interpreted as the screening effect of the counterions present in solution: the longer the screening length, the stiffer the molecule. This equivalence found between the non-specific binding of monovalent and divalent salts with nucleic acids might be useful to develop new biochemical assays in situations where divalent ion-specific interactions could be detrimental (93).
Figure 11.
Comparison between [Mon+] and [Mg2+] results. (A) Free energy of formation of the RNA hairpin at different salt conditions. Magnesium concentrations have been multiplied by 100 along the horizontal axis. (B) Persistence length values for the ssRNA hairpin at different salt conditions. Magnesium concentrations have been multiplied by 100 along the horizontal axis.
As a further step, it would be very interesting to extend this study by mechanically unfolding an RNA hairpin containing a Mg2+-specific binding site using our experimental setup. Eventually, the energetic contributions of different specific binding sites could be dissected and incorporated into current models of RNA structure prediction.
SUPPLEMENTARY DATA
Supplementary Data are available at NAR Online: Supplementary Tables 1 and 2, Supplementary Figures 1–8, Supplementary Methods and Supplementary References [1–15].
FUNDING
Human Frontier Science Program [RGP55-2008]; Institució Catalana de Recerca i Estudis Avançats; Centro de Investigación Biomédica en Red en Bioingeniería, Biomateriales y Nanomedicina; and Spanish Ministerio de Educación-Ministerio de Ciencia e Innovación [AP2007-00995 to A. A., FIS2011-19342 to F. R.]. Funding for open access charge: Research Projects of the PI.
Conflict of interest statement. None declared.
Supplementary Material
ACKNOWLEDGEMENTS
We acknowledge I. Tinoco Jr., M. Manosas and A. Bosco for a careful reading of the manuscript. We also acknowledge R. Eritja and A. Aviñó for their advice and help in carrying out the UV absorbance measurements.
REFERENCES
- 1.Berkhout B, Silverman RH, Jeang KT. Tat trans-activates the human immunodeficiency virus through a nascent RNA target. Cell. 1989;59:273–282. doi: 10.1016/0092-8674(89)90289-4. [DOI] [PubMed] [Google Scholar]
- 2.Olsthoorn RCL, Mertens S, Brederode FT, Bol JF. A conformational switch at the 3' end of a plant virus RNA regulates viral replication. EMBO J. 1999;18:4856–4864. doi: 10.1093/emboj/18.17.4856. [DOI] [PMC free article] [PubMed] [Google Scholar]
- 3.Gollnick P, Babitzke P, Antson A, Yanofsky C. Complexity in regulation of tryptophan biosynthesis in Bacillus subtilis. Annu. Rev. Genet. 2005;39:47–68. doi: 10.1146/annurev.genet.39.073003.093745. [DOI] [PubMed] [Google Scholar]
- 4.Garst AD, Batey RT. A switch in time: detailing the life of a riboswitch. Biochim. Biophys. Acta. 2009;1789:584–591. doi: 10.1016/j.bbagrm.2009.06.004. [DOI] [PMC free article] [PubMed] [Google Scholar]
- 5.Li L, Liu Y. Diverse small non-coding RNAs in RNA interference pathways. Methods. Mol. Biol. 2011;764:169–182. doi: 10.1007/978-1-61779-188-8_11. [DOI] [PubMed] [Google Scholar]
- 6.Kawaji H, Hayashizaki Y. Exploration of small RNAs. PLoS Genet. 2008;4:e22. doi: 10.1371/journal.pgen.0040022. [DOI] [PMC free article] [PubMed] [Google Scholar]
- 7.Zhang J, Lau M, Ferré-D'Amaré A. Ribozymes and riboswitches: modulation of RNA function by small molecules. Biochemistry. 2010;49:9123–9131. doi: 10.1021/bi1012645. [DOI] [PMC free article] [PubMed] [Google Scholar]
- 8.Bardaro MF, Jr, Shajani Z, Patora-Komisarska K, Robinson JA, Varani G. How binding of small molecule and peptide ligands to HIV-1 TAR alters the RNA motional landscape. Nucleic Acids Res. 2009;37:1529–1540. doi: 10.1093/nar/gkn1074. [DOI] [PMC free article] [PubMed] [Google Scholar]
- 9.Tinoco I, Jr, Bustamante C. How RNA folds. J. Mol. Biol. 1999;293:271–281. doi: 10.1006/jmbi.1999.3001. [DOI] [PubMed] [Google Scholar]
- 10.Zhao P, Zhang W-B, Chen S-J. Predicting secondary structural folding kinetics for nucleic acids. Biophys. J. 2010;98:1617–1625. doi: 10.1016/j.bpj.2009.12.4319. [DOI] [PMC free article] [PubMed] [Google Scholar]
- 11.Chen SJ, Dill KA. RNA folding energy landscapes. Proc. Natl Acad. Sci. USA. 2000;97:646–651. doi: 10.1073/pnas.97.2.646. [DOI] [PMC free article] [PubMed] [Google Scholar]
- 12.Hyeon C, Thirumalai D. Forced-unfolding and force-quench refolding of RNA hairpins. Biophys J. 2006;90:3410–3427. doi: 10.1529/biophysj.105.078030. [DOI] [PMC free article] [PubMed] [Google Scholar]
- 13.Petesheim M, Turner DH. Base-stacking and base-pairing contributions to helix stability: thermodynamics of double-helix formation with CCGG, CCGGp, CCGGAp, ACCGGp, CCGGUp, and ACCGGUp. Biochemistry. 1983;22:256–263. doi: 10.1021/bi00271a004. [DOI] [PubMed] [Google Scholar]
- 14.Freier SM, Kierzek R, Jaeger JA, Sugimoto N, Caruthers MH, Neilson T, Turner DH. Improved free-energy parameters for predictions of RNA duplex stability. Proc. Natl Acad. Sci. USA. 1986;83:9373–9377. doi: 10.1073/pnas.83.24.9373. [DOI] [PMC free article] [PubMed] [Google Scholar]
- 15.Walter AE, Turner DH, Kim J, Lyttle MH, Müller P, Mathews DH, Zuker M. Coaxial stacking of helixes enhances binding of oligoribonucleotides and improves predictions of RNA folding. Proc. Natl Acad. Sci. USA. 1994;91:9218–9222. doi: 10.1073/pnas.91.20.9218. [DOI] [PMC free article] [PubMed] [Google Scholar]
- 16.Serra MJ, Axenson TJ, Turner DH. A model for the stabilities of RNA hairpins based on a study of the sequence dependence of stability for hairpins of six nucleotides. Biochemistry. 1994;33:14289–14296. doi: 10.1021/bi00251a042. [DOI] [PubMed] [Google Scholar]
- 17.Serra MJ, Barnes TW, Betschart K, Gutierrez MJ, Sprouse KJ, Riley CK, Stewart L, Temel RE. Improved parameters for the prediction of RNA hairpin stability. Biochemistry. 1997;36:4844–4851. doi: 10.1021/bi962608j. [DOI] [PubMed] [Google Scholar]
- 18.Xia T, SantaLucia J, Jr, Burkard ME, Kierzek R, Schroeder SJ, Jiao X, Cox C, Turner DH. Thermodynamic parameters for an expanded nearest-neighbor model for formation of RNA duplexes with Watson-Crick base pairs. Biochemistry. 1998;37:14719–14735. doi: 10.1021/bi9809425. [DOI] [PubMed] [Google Scholar]
- 19.Mathews DH, Sabina J, Zuker M, Turner DH. Expanded sequence dependence of thermodynamic parameters improves prediction of RNA secondary structure. J. Mol. Biol. 1999;288:911–940. doi: 10.1006/jmbi.1999.2700. [DOI] [PubMed] [Google Scholar]
- 20.Znosko BM, Silvestri SB, Volkman H, Boswell B, Serra MJ. Thermodynamic parameters for an expanded nearest-neighbor model for the formation of RNA duplexes with single nucleotide bulges. Biochemistry. 2002;41:10406–10417. doi: 10.1021/bi025781q. [DOI] [PubMed] [Google Scholar]
- 21.Mathews DH, Disney MD, Childs JL, Schroeder SJ, Zuker M, Turner DH. Incorporating chemical modification constraints into a dynamic programming algorithm for prediction of RNA secondary structure. Proc. Natl Acad. Sci. USA. 2004;101:7287–7292. doi: 10.1073/pnas.0401799101. [DOI] [PMC free article] [PubMed] [Google Scholar]
- 22.Fürtig B, Wenter P, Reymond L, Richter C, Pitsch S, Schwalbe H. Conformational dynamics of bistable RNAs studied by time-resolved NMR spectroscopy. J. Am. Chem. Soc. 2007;129:16222–16229. doi: 10.1021/ja076739r. [DOI] [PubMed] [Google Scholar]
- 23.Fürtig B, Wenter P, Pitsch S, Schwalbe H. Probing mechanism and transition state of RNA refolding. ACS Chem. Biol. 2010;5:753–765. doi: 10.1021/cb100025a. [DOI] [PubMed] [Google Scholar]
- 24.Williams AP, Longfellow CE, Freier SM, Kierzek R, Turner DH. Laser temperature-jump, spectroscopic, and thermodynamic study of salt effects on duplex formation by dGCATGC. Biochemistry. 1989;28:4283–4291. doi: 10.1021/bi00436a025. [DOI] [PubMed] [Google Scholar]
- 25.Ma H, Proctor DJ, Kierzek E, Kierzek R, Bevilacqua PC, Gruebele M. Exploring the energy landscape of a small RNA hairpin. J. Am. Chem. Soc. 2006;128:1523–1530. doi: 10.1021/ja0553856. [DOI] [PubMed] [Google Scholar]
- 26.Sarkar K, Meister K, Sethi A, Gruebele M. Fast folding of an RNA tetraloop on a rugged energy landscape detected by a stacking-sensitive probe. Biophys. J. 2009;97:1418–1427. doi: 10.1016/j.bpj.2009.06.035. [DOI] [PMC free article] [PubMed] [Google Scholar]
- 27.Sarkar K, Nguyen DA, Gruebele M. Loop and stem dynamics during RNA hairpin folding and unfolding. RNA. 2010;12:2427–2434. doi: 10.1261/rna.2253310. [DOI] [PMC free article] [PubMed] [Google Scholar]
- 28.Stancik AL, Brauns EB. Rearrangement of partially ordered stacked conformations contributes to the rugged energy landscape of a small RNA hairpin. Biochemistry. 2008;47:10834–10840. doi: 10.1021/bi801170c. [DOI] [PubMed] [Google Scholar]
- 29.Zhang W, Chen SJ. Exploring the complex folding kinetics of RNA hairpins: I. General folding kinetics analysis. Biophys. J. 2006;90:765–777. doi: 10.1529/biophysj.105.062935. [DOI] [PMC free article] [PubMed] [Google Scholar]
- 30.Hyeon C, Thirumalai D. Mechanical unfolding of RNA hairpins. Proc. Natl Acad. Sci. USA. 2005;102:6789–6794. doi: 10.1073/pnas.0408314102. [DOI] [PMC free article] [PubMed] [Google Scholar]
- 31.Liphardt J, Onoa B, Smith SB, Tinoco I, Jr, Bustamante C. Reversible unfolding of single RNA molecules by mechanical force. Science. 2001;292:733–737. doi: 10.1126/science.1058498. [DOI] [PubMed] [Google Scholar]
- 32.Tinoco I, Jr, Collin D, Li PTX. The effect of force on thermodynamics and kinetics: unfolding single RNA molecules. Biochem. Soc. Trans. 2004;32(Pt 5):757–760. doi: 10.1042/BST0320757. [DOI] [PMC free article] [PubMed] [Google Scholar]
- 33.Li PT, Collin D, Smith SB, Bustamante C, Tinoco I., Jr Probing the mechanical folding kinetics of TAR RNA by hopping, force-jump, and force-ramp methods. Biophys. J. 2006;90:250–260. doi: 10.1529/biophysj.105.068049. [DOI] [PMC free article] [PubMed] [Google Scholar]
- 34.Bustamante C, Chemla YR, Forde NR, Izhaky D. Mechanical processes in biochemistry. Annu. Rev. Biochem. 2004;73:705–748. doi: 10.1146/annurev.biochem.72.121801.161542. [DOI] [PubMed] [Google Scholar]
- 35.Tinoco IJr, Chen G, Qu X. RNA reactions one molecule at a time. Cold Spring Harb. Perspect. Biol. 2010;2:a003624. doi: 10.1101/cshperspect.a003624. [DOI] [PMC free article] [PubMed] [Google Scholar]
- 36.Manosas M, Collin D, Ritort F. Force-dependent fragility in RNA hairpins. Phys. Rev. Lett. 2006;96:218301. doi: 10.1103/PhysRevLett.96.218301. [DOI] [PubMed] [Google Scholar]
- 37.Huguet JM, Bizarro CV, Forns N, Smith SB, Bustamante C, Ritort F. Single-molecule derivation of salt dependent base-pair free energies in DNA. Proc. Natl Acad. Sci. USA. 2010;107:15431–15436. doi: 10.1073/pnas.1001454107. [DOI] [PMC free article] [PubMed] [Google Scholar]
- 38. Bustamante, C. and Smith, S.B. (2006) Patent US 7133132 B2. [Google Scholar]
- 39.Record MTh., Jr Effects of Na+and Mg2+ions on the helix-coil transition of DNA. Biopolymers. 1975;14:2137–2158. [Google Scholar]
- 40.Record MT, Jr, Woodbury CP, Lohman TM. Na+ effects on transitions of DNA and polynucleotides of variable linear charge density. Biopolymers. 1976;15:893–915. doi: 10.1002/bip.1976.360150507. [DOI] [PubMed] [Google Scholar]
- 41.Williams DJ, Hall KB. Thermodynamic comparison of the salt dependence of natural RNA hairpins and RNA hairpins with non-nucleotide spacers. Biochemistry. 1996;35:14665–14670. doi: 10.1021/bi961654g. [DOI] [PubMed] [Google Scholar]
- 42.Takach J, Mikulecky P, Feig A. Salt-dependent heat capacity changes for RNA duplex formation. J. Am. Chem. Soc. 2004;126:6530–6531. doi: 10.1021/ja0316263. [DOI] [PMC free article] [PubMed] [Google Scholar]
- 43.Tan ZJ, Chen SJ. Electrostatic correlations and fluctuations for ion binding to a finite length polyelectrolyte. J. Chem. Phys. 2005;122:44903. doi: 10.1063/1.1842059. [DOI] [PMC free article] [PubMed] [Google Scholar]
- 44.Tan ZJ, Chen SJ. RNA helix stability in mixed Na+/Mg2+solution. Biophys. J. 2007;92:3615–3632. doi: 10.1529/biophysj.106.100388. [DOI] [PMC free article] [PubMed] [Google Scholar]
- 45.Tan ZJ, Chen SJ. Salt dependence of nucleic acid hairpin stability. Biophys. J. 2008;95:738–752. doi: 10.1529/biophysj.108.131524. [DOI] [PMC free article] [PubMed] [Google Scholar]
- 46.Heilman-Miller SL, Thirumalai D, Woodson SA. Role of counterion condensation in folding of tetrahymena ribozyme. I: equilibrium stabilization by cations. J. Mol. Biol. 2001;306:1157–1166. doi: 10.1006/jmbi.2001.4437. [DOI] [PubMed] [Google Scholar]
- 47.Tan ZJ, Chen SJ. Predicting electrostatic forces in RNA folding. Methods Enzymol. 2009;469 doi: 10.1016/S0076-6879(09)69022-4. Chapter 22. [DOI] [PMC free article] [PubMed] [Google Scholar]
- 48.Collin D, Ritort F, Jarzynski C, Smith SB, Tinoco I, Jr, Bustamante C. Verification of the Crooks fluctuation theorem and recovery of RNA folding free energies. Nature. 2005;437:231–234. doi: 10.1038/nature04061. [DOI] [PMC free article] [PubMed] [Google Scholar]
- 49.McManus MT, Petersen CP, Haines BB, Chen J, Sharp PA. Gene silencing using micro-RNA designed hairpins. RNA. 2002;8:842–850. doi: 10.1017/s1355838202024032. [DOI] [PMC free article] [PubMed] [Google Scholar]
- 50.Casey J, Davidson N. Rates of formation and thermal stabilities of RNA:DNA and DNA:DNA duplexes at high concentrations of formamide. Nucleic Acids Res. 1977;4:1539–1552. doi: 10.1093/nar/4.5.1539. [DOI] [PMC free article] [PubMed] [Google Scholar]
- 51.Owczarzy R, Moreira BG, You Y, Behlke MA, Walder JA. Predicting stability of DNA duplexes in solutions containing magnesium and monovalent cations. Biochemistry. 2008;47:5336–5353. doi: 10.1021/bi702363u. [DOI] [PubMed] [Google Scholar]
- 52.Liphardt J, Dumont S, Smith SB, Tinoco IJr, Bustamante C. Equilibrium information from nonequilibrium measurements in an experimental test of Jarzynski's equality. Science. 2002;296:1832–1835. doi: 10.1126/science.1071152. [DOI] [PubMed] [Google Scholar]
- 53.Cocco S, Marko JF, Monasson R. Slow nucleic acid unzipping kinetics from sequence-defined barriers. Eur. Phys. J. E: Soft Matter Biol. Phys. 2003;10:153–161. doi: 10.1140/epje/e2003-00019-8. [DOI] [PubMed] [Google Scholar]
- 54.Manosas M, Ritort F. Thermodynamic and kinetic aspects of RNA pulling experiments. Biophys. J. 2005;88:3224–3242. doi: 10.1529/biophysj.104.045344. [DOI] [PMC free article] [PubMed] [Google Scholar]
- 55.Woodside MT, Anthony PC, Behnke-Parks WM, Larizadeh K, Herschlag D, Block SM. Direct measurement of the full, sequence-dependent folding landscape of a nucleic acid. Science. 2006;314:1001–1004. doi: 10.1126/science.1133601. [DOI] [PMC free article] [PubMed] [Google Scholar]
- 56.Mossa A, Manosas M, Forns N, Huguet JM, Ritort F. Dynamic force spectroscopy of DNA hairpins: I. Force kinetics and free energy landscapes. J. Stat. Mech. 2009:P02060. [Google Scholar]
- 57.Forns N, de Lorenzo S, Manosas M, Hayashi K, Huguet JM, Ritort F. Improving signal/noise resolution in single-molecule experiments using molecular constructs with short handles. Biophys. J. 2011;100:1765–1774. doi: 10.1016/j.bpj.2011.01.071. [DOI] [PMC free article] [PubMed] [Google Scholar]
- 58.Bustamante C, Marko JF, Siggia ED, Smith S. Entropic elasticity of lambda-phage DNA. Science. 1994;265:1599–1600. doi: 10.1126/science.8079175. [DOI] [PubMed] [Google Scholar]
- 59.Marko JF, Siggia ED. Stretching DNA. Macromolecules. 1995;28:8759–8770. [Google Scholar]
- 60.Kramers HA. Brownian motion in a field of force and the diffusion model of chemical reactions. Physica. 1940;7:284–304. [Google Scholar]
- 61.Bell GI. Models for the specific adhesion of cells to cells. Science. 1978;200:618–627. doi: 10.1126/science.347575. [DOI] [PubMed] [Google Scholar]
- 62.Evans E, Ritchie K. Dynamic strength of molecular adhesion bonds. Biophys. J. 1997;72:1541–1555. doi: 10.1016/S0006-3495(97)78802-7. [DOI] [PMC free article] [PubMed] [Google Scholar]
- 63.Qian H, Shapiro BE. Graphical method for force analysis: macromolecular mechanics with atomic force microscopy. Proteins: Struct. Funct. Genet. 1999;37:576–581. doi: 10.1002/(sici)1097-0134(19991201)37:4<576::aid-prot8>3.0.co;2-o. [DOI] [PubMed] [Google Scholar]
- 64.Zwanzig R. Nonequilibrium Statistical Mechanics. 1st edn. Oxford University Press, New York; 2001. [Google Scholar]
- 65.Hyeon C, Thirumalai D. Measuring the energy landscape roughness and the transition state location of biomolecules using single molecule mechanical unfolding experiments. J. Phys.: Condens. Matter. 2007;19:113101. [Google Scholar]
- 66.Evans E, Halvorsen K, Kinoshita K, Wong WP. 2009. A new approach to analysis of single molecule force experiments. In Hinterdorfer,P. and van Oijen,A.M. (eds) Handbook of Single-Molecule Biophysics. Springer Science+Business Media LLC, New York, pp. 571–589. [Google Scholar]
- 67.Tinoco IJr, Uhlenbeck OC, Levine MD. Estimation of secondary structure in ribonucleic acids19. Nature. 1971;230:362–367. doi: 10.1038/230362a0. [DOI] [PubMed] [Google Scholar]
- 68.Zuker M. Mfold server for nucleic acid folding and hybridization prediction. Nucleic Acids Res. 2003;31:3406–3415. doi: 10.1093/nar/gkg595. [DOI] [PMC free article] [PubMed] [Google Scholar]
- 69.Seol Y, Skinner GM, Visscher K. Elastic properties of a singlestranded charged homopolymeric ribonucleotide. Phys. Rev. Lett. 2004;93:118102. doi: 10.1103/PhysRevLett.93.118102. [DOI] [PubMed] [Google Scholar]
- 70.Toan NM, Micheletti C. Inferring the effective thickness of polyelectrolytes from stretching measurements at various ionic strengths: applications to DNA and RNA. J. Phys. Condens. Matter. 2006;18:S269–S281. [Google Scholar]
- 71.Chen H, Meisburger SP, Pabit SA, Sutton JL, Webb WW, Pollack L. Ionic strength-dependent persistence lengths of single-stranded RNA and DNA. Proc. Natl Acad. Sci. USA. 2012;109:799–804. doi: 10.1073/pnas.1119057109. [DOI] [PMC free article] [PubMed] [Google Scholar]
- 72.Micka U, Kremer K. Persistence length of the Debye-Hückel model of weakly charged flexible polyelectrolyte chains. Phys. Rev. E: Stat., Nonlinear, Soft Matter Phys. 1996;54:2653–2662. doi: 10.1103/physreve.54.2653. [DOI] [PubMed] [Google Scholar]
- 73.SantaLucia JJ. A unified view of polymer, dumbbell, and oligonucleotide DNA nearest-neighbor thermodynamics. Proc. Natl Acad. Sci. USA. 1998;95:1460–1465. doi: 10.1073/pnas.95.4.1460. [DOI] [PMC free article] [PubMed] [Google Scholar]
- 74.SantaLucia JJ, Hicks D. The thermodynamics of DNA structural motifs. Annu. Rev. Biophys. Biomol. Struct. 2004;33:415–440. doi: 10.1146/annurev.biophys.32.110601.141800. [DOI] [PubMed] [Google Scholar]
- 75.Shkel IA, Record JMT. Effect of the number of nucleic acid oligomer charges on the salt dependence of stability (ΔG37°) and melting temperature (Tm): NLPB analysis of experimental data. Biochemistry. 2004;43:7090–7101. doi: 10.1021/bi036225e. [DOI] [PubMed] [Google Scholar]
- 76.Vieregg J, Cheng W, Bustamante C, Tinoco IJr. Measurement of the effect of monovalent cations on RNA hairpin stability. J. Am. Chem. Soc. 2007;129:14966–14973. doi: 10.1021/ja074809o. [DOI] [PMC free article] [PubMed] [Google Scholar]
- 77.Peyret N. Ph.D. Thesis. Detroit, MI: Wayne State University Department of Chemistry; 2000. Prediction of Nucleic Acid Hybridization: Parameters and Algorithms. [Google Scholar]
- 78.Dove WF, Davidson N. Cation effects on the denaturation of DNA. J. Mol. Biol. 1962;5:467–478. [Google Scholar]
- 79.Privalov PL, Ptitsyn OB, Birshtein TM. Determination of stability of the DNA double helix in an aqueous medium. Biopolymers. 1969;8:559–571. [Google Scholar]
- 80.Manning GS. On the application of polyelectrolyte “limiting laws” to the helix-coil transition of DNA. I. Excess univalent cations. Biopolymers. 1972;11:937–949. doi: 10.1002/bip.1972.360110502. [DOI] [PubMed] [Google Scholar]
- 81.Manning GS. The molecular theory of polyelectrolyte solutions with applications to the electrostatic properties of polynucleotides. Quart. Rev. Biophys. 1978;11:179–246. doi: 10.1017/s0033583500002031. [DOI] [PubMed] [Google Scholar]
- 82.Record MT, Jr, Anderson CF, Lohmna TM. Thermodynamic analysis of ion effects on the binding and conformational equilibra of proteins and nucleic acids: the roles of ions association of release, secreening, and ion effects on water activity. Quart. Rev. Biophys. 1978;11:103–178. doi: 10.1017/s003358350000202x. [DOI] [PubMed] [Google Scholar]
- 83.Hammond GS. A correlation of reaction rates. J. Am. Chem. Soc. 1955;77:334–338. [Google Scholar]
- 84.Owczarzy R, You Y, Moreira BG, Manthey JA, Huang L, Behlke MA, Walder JA. Effects of sodium ions on DNA duplex oligomers: improved predictions of melting temperatures. Biochemistry. 2004;43:3537–3554. doi: 10.1021/bi034621r. [DOI] [PubMed] [Google Scholar]
- 85.Jost D, Everaers R. A unified Poland-Scheraga model of oligoand polynucleotide DNA melting: salt effects and predictive power. Biophys. J. 2009;96:1056–1067. doi: 10.1529/biophysj.108.134031. [DOI] [PMC free article] [PubMed] [Google Scholar]
- 86.Tan ZJ, Chen SJ. Nucleic acid helix stability: effects of salt concentration, cation valence and size, and chain length. Biophys. J. 2006;90:1175–1190. doi: 10.1529/biophysj.105.070904. [DOI] [PMC free article] [PubMed] [Google Scholar]
- 87.Manning GS. Electrostatic free energy of the DNA double helix in counterion condensation theory. Biophys. Chem. 2002;101–102:461–473. doi: 10.1016/s0301-4622(02)00162-x. [DOI] [PubMed] [Google Scholar]
- 88.Rich A. The double helix: a tale of two puckers. Nat. Struct. Mol. Biol. 2003;10:247–249. doi: 10.1038/nsb0403-247. [DOI] [PubMed] [Google Scholar]
- 89.Cole PE, Yang SK, Crothers DM. Conformational changes of transfer ribonucleic acid. Equilibrium phase diagrams. Biochemistry. 1972;11:4358–4368. doi: 10.1021/bi00773a024. [DOI] [PubMed] [Google Scholar]
- 90.Schroeder SJ, Turner DH. Factors affecting the thermodynamic stability of small asymmetric internal loops in RNA. Biochemistry. 2000;39:9257–9274. doi: 10.1021/bi000229r. [DOI] [PubMed] [Google Scholar]
- 91.Shankar N, Kennedy SD, Chen G, Krugh TR, Turner DH. The NMR structure of an internal loop from 23S ribosomal RNA differs from its structure in crystals of 50S ribosomal subunits. Biochemistry. 2006;45:11776–11789. doi: 10.1021/bi0605787. [DOI] [PMC free article] [PubMed] [Google Scholar]
- 92.Shklovskii BI. Screening of a macroion by multivalent ions: correlation-induced inversion of charge. Phys. Rev. E. 1999;60:5082–5811. doi: 10.1103/physreve.60.5802. [DOI] [PubMed] [Google Scholar]
- 93.Douglas SM, Dietz H, Liedl T, Högberg B, Graf F, Shih WM. Self-assembly of DNA into nanoscale three-dimensional shapes. Nature. 2009;459:414–418. doi: 10.1038/nature08016. [DOI] [PMC free article] [PubMed] [Google Scholar]
Associated Data
This section collects any data citations, data availability statements, or supplementary materials included in this article.