


Abstract
Myelin is essential for the rapidity of saltatory nerve conduction, and also provides trophic support for axons to prevent axonal degeneration. Two critical determinants of myelination are SOX10 and EGR2/KROX20. SOX10 is required for specification of Schwann cells from neural crest, and is required at every stage of Schwann cell development. Egr2/Krox20 expression is activated by axonal signals in myelinating Schwann cells, and is required for cell cycle arrest and myelin formation. To elucidate the integrated function of these two transcription factors during peripheral nerve myelination, we performed in vivo ChIP-Seq analysis of myelinating peripheral nerve. Integration of these binding data with loss-of-function array data identified a range of genes regulated by these factors. In addition, although SOX10 itself regulates Egr2/Krox20 expression, leading to coordinate activation of several major myelin genes by the two factors, there is a large subset of genes that are activated independent of EGR2. Finally, the results identify a set of SOX10-dependent genes that are expressed in early Schwann cell development, but become subsequently repressed by EGR2/KROX20.
INTRODUCTION
Developmental regulation of myelination depends on transcriptional regulation of a diverse gene set that includes not only major myelin genes, but also lipid biosynthesis genes, and genes involved in controlling exit from the cell cycle (1). The EGR2/KROX20 and SOX10 transcription factors play determinative roles in controlling differentiation of Schwann cells. Mouse genetic experiments have shown that SOX10 is required at multiple stages of Schwann cell development, including specification of Schwann cells from neural crest, and entry into the promyelinating and myelinating stages (2,3). The induction of EGR2 at the onset of myelination is also critically required in that Schwann cells from EGR2-deficient mice fail to initiate myelin formation (4,5). Both SOX10 and EGR2 continue to be expressed in myelinating Schwann cells through adulthood, and inducible deletion of either factor in mature Schwann cells leads to demyelination (6,7). Moreover, EGR2 mutations have been identified in patients with peripheral neuropathy disorders, such as Charcot–Marie–Tooth disease, Dejerine–Sottas syndrome and congenital hypomyelinating neuropathy (8–10). Similarly, dominant negative SOX10 mutations were identified in a complex neuropathy-associated syndrome (11,12) called PCWH (peripheral demyelinating neuropathy, central dysmyelinating leukodystrophy, Waardenburg syndrome and Hirschsprung disease), reflecting the pervasive involvement of EGR2 and SOX10 in peripheral nerve myelination.
The genes controlled by EGR2 have been characterized by microarray profiling (5,13), and subsequent studies have identified a number of EGR2 regulatory elements in the Connexin 32, Myelin Basic Protein, Myelin Protein Zero and Peripheral Myelin Protein 22 genes (14–19). Interestingly, many of these elements are coregulated by SOX10, and clustering of EGR2/SOX10 binding sites in myelin gene regulatory elements appears to be a common theme in control of myelination (20,21). Consistent with its temporal expression pattern, it is clear that SOX10 is required for a number of regulatory events in early Schwann cell development. For example, a recent study of the Schwann cell enhancer in the Oct6/Pou3f1 gene (a major marker of promyelinating Schwann cells) identified SOX10 responsive elements (22), and it appears that SOX10 is also involved in its own autoregulation (23,24).
SOX10 expression is maintained in mature myelinating Schwann cells, but analysis of its role at this stage is complicated by the fact that expression of the Egr2 transcription factor is itself controlled by SOX10 (25,26). Although some SOX10 target genes have been identified— including not only Oct6/Pou3f1 and Egr2/Krox20, but also Mpz, Mbp, Pmp22, Cntf, Dhh, S100b and Erbb3 (2,3,18,19,27–31)—it is not clear in all cases whether SOX10 is directly involved in gene activation, or rather activates genes indirectly through activation of the EGR2 transcription factor.
To characterize the patterns of EGR2/SOX10 binding, we performed in vivo ChIP-Seq on myelinating rat sciatic nerve. These studies reveal substantial colocalization of these factors at multiple elements, and also provide evidence that SOX10 supports regulation of a number of genes independent of EGR2 activity.
MATERIALS AND METHODS
ChIP-Seq
ChIP assays were performed on pooled sciatic nerves from Sprague-Dawley rat pups at post-natal Day 15 as previously described (32), except that for the EGR2 ChIP, immunoprecipitation was carried out using Dynabeads® Protein A/G Mix (Invitrogen) in lysis buffer containing 1% TritonX-100 instead of 0.3% TritonX-100. Herring sperm DNA was omitted from the blocking procedure. The antibodies used in this study include SOX10 (Santa Cruz Biotechnology, sc-17342x) and EGR2 (Abcam 43020). The raw data files have been deposited in NCBI Geo under accession number GSE35132. For subsequent validation assays of selected peaks using qPCR (Supplementary Table S3), independent ChIP assays from P15 sciatic nerve were performed as described (32) with the same antibodies, as well as an independent Egr2 antibody (Covance).
Construction and sequencing of Illumina libraries
ChIP samples ranging in total quantity from 1.3 ng (EGR2) to 6.8 ng (SOX10), along with 10 ng of input controls, were submitted to the University of Wisconsin–Madison DNA Sequencing Facility for ChIP-seq library preparation. All libraries were generated using reagents from either the Illumina Paired End Sample Preparation Kit (Illumina Inc., San Diego, CA, USA) or the NEBNext® DNA Sample Prep Reagent Set 1 (New England Biolabs, Ipswitch, MA, USA) and the Illumina protocol ‘Preparing Samples for ChIP Sequencing of DNA’ (Illumina part # 11257047 RevA) as per the manufacturer’s instructions but with the following modification: products of the ligation reaction were purified by gel electrophoresis using 2% SizeSelect agarose gels (Invitrogen, Carlsbad, CA, USA) targeting either 275 bp fragments (Egr2) or 200–400 bp fragments (SOX10 ChIP and input). After library construction and amplification, quality and quantity were assessed using an Agilent DNA 1000 series chip assay (Agilent Technologies, Santa Clara, CA, USA) and QuantIT PicoGreen dsDNA Kit (Invitrogen), respectively, and libraries were standardized to 10 μM. Cluster generation was performed using a cBot Single Read Cluster Generation Kit (v4) and placed on the Illumina cBot. A single read, 36 bp run was performed, using standard 36 bp SBS kits (v4) and either SCS 2.6 or 2.8 software on an Illumina Genome Analyzer IIx. Basecalling was performed using the standard Illumina Pipeline. Reads were mapped to the Rattus norvegicus genome Rn4 using Bowtie (http://bowtie-bio.sourceforge.net/index.shtml) to produce SAM files for further analysis.
Peak calling
The analysis of 2 biological replicates provided 3 735 149 and 7 447 826 reads for EGR2; and 7 298 803 and 4 788 143 for SOX10. Inputs for EGR2 and SOX10 immunoprecipitations were sequenced in parallel, and yielded ∼2.8 and ∼4.6 million reads (Egr2) and ∼28 million reads (SOX10). Peak finding was performed using the R package MOSAiCS (MOdel-based one and two Sample Analysis and inference for ChIP-Seq Data) (31) controlling the false discovery rate (FDR) at 0.05. MOSAiCS implements a model-based approach where the background distribution for unbound regions take into account systematic biases such as mappability and GC content and the peak regions are described with a two component Negative Binomial mixture model. MOSAiCS is available at www.bioconductor.org/packages/2.8/bioc/vignettes/mosaics/inst/doc/mosaics-example.pdf
Motif and gene enrichment analysis
MEME (Multiple Em for Motif Elicitation) (33) and FIMO (Find Individual Motif Occurrences) were used together for the motif analysis. MEME was used to search motifs based on peaks and FIMO was used to obtain the occurrence rates of the motifs detected by MEME in both EGR2 and SOX10 peaks. DAVID (Database for Annotation, Visualization, and Integrated Discovery) (34) with P = 0.1 was used for the gene enrichment analysis for up- and downregulated genes.
Cell line culture and siRNA treatment
The S16 rat Schwann cell line (provided by Richard Quarles) was grown as described (35). S16 cells were transfected with 40 nmol of siRNA directed towards Sox10 (Ambion, s131239) or a negative siRNA control (Negative control #2, Ambion, AM4613) with the Amaxa system (Lonza) using the Rat Neuron Nucleofection Solution. At 48 h after transfection, RNA was purified using the RNeasy Lipid Tissue mini kit (Qiagen) and processed for hybridization to Rat Gene 1.0 ST Affymetrix chips by the UW Biotechnology Center. The experiment was performed on three independent sets of samples. After normalization to means, the data were analyzed by Genesifter to identify genes that were induced or decreased >1.5-fold using t-test (P-value cutoff 0.05).
Transfection assays
Transfection assays were performed in B16 (mouse melanoma) cells as described (16). Fragments encompassing EGR2/SOX10 binding sites (Rn4 coordinates provided in Table 3) were cloned in pGL4 (Promega) containing a minimal TATA element. Fragments from proximal promoters were cloned with native transcription start sites upstream of luciferase in pGL4. CMV expression vectors for EGR2 (36) and SOX10 (37) have been described previously. Luciferase activities were normalized to β-galactosidase activity from a co-transfected CMV (cytomegalovirus)-lacZ construct, and fold induction is reported relative to assays performed with the reporter and an empty CMV expression vector (pCB6).
Table 3.
Reporter assays of selected peaks
| Reporter | SOX10 | EGR2 | SOX10+EGR2 | Coordinates |
|---|---|---|---|---|
| EGR2-activated genes | ||||
| Cdkn1b | 17.9 ± 1.5* | 109 ± 26* | 433 ± 98* | chr4:171 842 680–171843120 |
| Prx | 4.9 ± 2.2* | 30.0 ± 6.9* | 32.7 ± 6.6* | chr1:82 581 793–82 582 143 |
| Mp11 | 137 ± 106* | 311 ± 91* | 541 ± 281* | chr5:154 156 638–154 157 250 |
| Cntf pr. | 2.5 ± 1.1 | 15.7 ± 4.6* | 6.2 ± 1.8* | chr1:215 844 613–215 844 913 |
| SOX10-activated genes | ||||
| Lgi4 | 2.4 ± 1.1* | 1.1 ± 0.2 | 1.6 ± 0.5 | chr4:171 842 680–171 843 120 |
| Cnp pr. | 21.5 ± 0.9* | 49.1 ± 12.5* | 53.1 ± 9.8* | chr10:89 519 778–89 520 480 |
| SOX10-activated, EGR2-repressed genes | ||||
| Brn2/Pou3f2 | 9.1 ± 5.5* | 0.7 ± 0.6 | 3.5 ± 2.2 | chr5:37 283 729–37284213 |
| Egfl8 pr. | 5.4 ± 2.4* | 3.5 ± 0.9* | 3.8 ± 1.9* | chr20:4 234 732–4235584 |
| Id2 | 8.0 ± 2.1* | 2.3 ± 1.1* | 4.1 ± 1.6* | chr6:42 788 060–42 788 470 |
Table displays transfection data of the indicated reporters using the B16 melanocyte cell line. Reporters were constructed from genes found to be Egr2-dependent in vivo (Egr2-activated), Sox10-activated in the S16 cell line (Supplementary Table S6), or inversely regulated by the two factors in these two data sets (Sox10-activated, Egr2 repressed). Fragments were cloned using the indicated genomic coordinates of the Rn4 genome. Fragments were either cloned upstream of a minimal TATA, or promoter proximal sites (marked pr.) were cloned with the native transcription start site. Numbers indicate fold activation of each reporter with co-transfection of EGR2 and/or SOX10 expression constructs (100 ng) relative to co-transfection with an empty CMV expression vector. Average values and standard deviations are shown for four independent assays.
*Values that differ from empty CMV vector transfections with P < 0.05.
RESULTS
Genome-wide identification of EGR2 and SOX10 binding sites in myelinating nerve in vivo
To examine genomic distribution of EGR2 binding in vivo, ChIP assays were performed using P15 rat sciatic nerve (Figure 1). This is a peak period of active myelination in peripheral nerve, and Egr2 is selectively expressed in myelinating Schwann cells (38). Crosslinked chromatin was prepared from two independent pools of freshly dissected sciatic nerves of P15 littermates and immunoprecipitations were performed with an EGR2 antibody used previously (21). The ChIP samples were used to prepare libraries for Illumina sequencing, which yielded a total of ∼11.2 million mapped reads. Parallel sequencing of input DNA yielded ∼7.4 million mapped reads.
Figure 1.
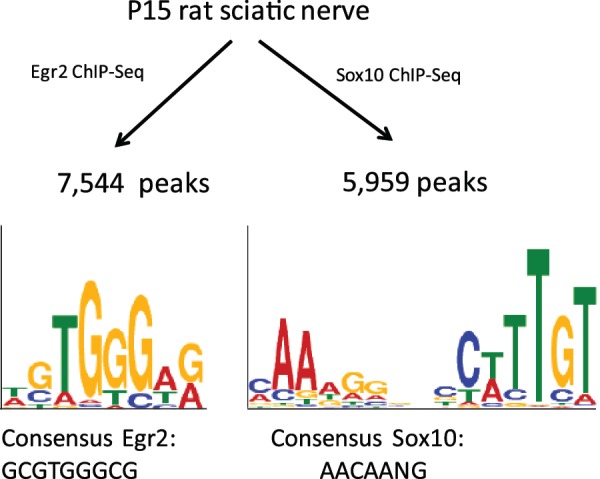
In vivo ChIP-Seq analysis of EGR2 and SOX10 binding in peripheral nerve. ChIP assays were performed from pooled rat sciatic nerves at P15, using two independent pools. Fragments associated with EGR2 and SOX10 were sequenced, and mapped to the Rn4 build of the rat genome. Logos display enriched motifs that correspond to previously published consensus sequences for EGR2 and SOX10 (43,44).
A similar analysis for SOX10 was performed in P15 rat sciatic nerve with a SOX10 antibody used previously (16,18,20). The specificity of ChIP signals has been independently tested by performing ChIP assays in a Schwann cell line in which SOX10 expression has been reduced by siRNA transfection (18). In peripheral nerve, SOX10 is expressed only in Schwann cells and not in other cell types (37). ChIP assays were performed on two biological replicates from independent pools of P15 littermates. The two replicates provided a total of ∼12.1 million uniquely mapped reads. In addition, sequencing of input DNA was used to assess the distribution of reads from sonicated peripheral nerve chromatin (28 million reads).
After mapping unique reads to the Rn4 build of the rat genome, the data were analyzed by the MOSAiCS method to identify peaks of binding in the two sets (39). A total of 7544 peaks were detected for EGR2 data and 5959 peaks for SOX10 data with a FDR of 0.05 (Supplementary Tables S1 and S2). SOX10 peaks were found within 100 kb of 7696 genes, and EGR2 peaks were found within the same distance of 8572 genes. Gene ontology analysis of the sets of peak-associated genes identified several enriched terms (FDR < 0.05, listed in Supplementary Tables S1 and S2), such as transmission of nerve impulse, phosphorylation, and axon (SOX10); and nucleotide binding, cell cycle and transmission of nerve impulse (EGR2).
Previously identified EGR2 binding sites in Mpz, Mbp, Prx, Dhh, Ndrg1, Nab2 and several lipid biosynthetic genes (16,17,20,21,32,40,41) were identified as peaks using EGR2 ChIP-Seq analysis (Figure 2). Similarly, the SOX10 peak analysis (Figures 3 and 4) revealed previously described binding sites in the Sox10, Mbp, Mpz, Cntf and Egr2 genes (14–16,23,26,29). Overall, the ChIP-Seq analysis identified 13 of 18 EGR2 binding sites that have been published previously using qPCR analysis of ChIP samples (references listed in Supplementary Table S3). A recent study of the Pmp22 locus used ChIP-seq data to identify three additional EGR2 sites that were subsequently confirmed by qPCR analysis of ChIP samples (19). Therefore, the EGR2 ChIP-seq identified 16/21 qPCR-confirmed sites (sensitivity = 76%). For SOX10, the ChIP-seq analysis found statistically significant peaks at 9 of 12 previously identified sites (Supplementary Table S3), and qPCR analysis confirmed 4 additional sites identified by the ChIP-Seq analysis in Pmp22 and Aatk genes (19,42). Overall, the sensitivity of the SOX10 peak analysis based on published qPCR confirmation of Sox10 binding is 13/16 (81%). We also validated a number of newly identified EGR2 and SOX10 binding sites from the ChIP-Seq peak analysis using qPCR analysis of independent ChIP samples (see Supplementary Table S3), which are described below.
Figure 2.

ChIP-Seq analysis of EGR2 binding. Binding profiles of EGR2 at selected loci are shown. Those peaks marked with an asterisk were identified as statistically significant relative to sequenced ChIP input data. Scale bars are marked within each panel, and all peak coordinates are listed in Supplementary Table S1. The y-axis indicates the −log10 posterior probability for 50 bp windows generated by MOSAiCS analysis. All genes shown are reduced in peripheral nerve of EGR2-deficient mice (5).
Figure 3.

SOX10 binding within Sox10 locus. Binding pattern of SOX10 within its own locus is shown. The SOX10 MCS track indicates previously identified multispecies-conserved sequences numbered (2–7), as in ref. (57). Peaks marked with an asterisk are statistically significant relative to sequenced ChIP input DNA.
Figure 4.

ChIP-Seq analysis of SOX10 binding. Binding profiles of SOX10 at selected loci are shown. Those peaks marked with an asterisk were identified as statistically significant relative to sequenced ChIP input data. Peak coordinates are listed in Supplementary Table S2. All genes shown are reduced in microarray analysis of S16 cells treated with Sox10 siRNA (Supplementary Table S5).
Analysis of EGR2 and SOX10 peaks
The collection of SOX10 and EGR2 peaks allows unbiased determination of optimal binding motifs. To determine potential motifs for EGR2 binding, we used MEME (33) to identify enriched motifs in the top 500 peaks of EGR2 binding. Two of the enriched motifs (Figure 1 and Table 1) resemble a previously defined consensus binding site for EGR2: GCGTGGGCG (43). MEME analysis of SOX10 peaks identified an enriched motif containing an inverted arrangement of two similar sites (Figure 1) that match the general consensus binding site for members of the SoxE family (AACAANG) (44). If the final G of this heptameric sequence is considered the last base, then there is a 4 bp spacer between sites, which closely corresponds to optimal spacing of SOX10 binding sites as defined previously (45). Since this previous study had shown that a variable spacing between sites can be tolerated, we examined the occurrence of this inverted arrangement in all SOX10 peaks, allowing for spacers of 3–6 bp (Table 1). Using a P-value cut-off of 0.005, 77% of the SOX10 peaks had similar sites corresponding to the dimeric motif, whereas 69% of the EGR2 peaks also had an inverted dimeric SOX10 site. Using 40 sets of randomized peak sequences, the occurrence of the motif never exceeded 74%. At a more stringent cutoff (P < 0.001), 49% of SOX10 peaks had the dimeric motif, compared to only 32% of EGR2 peaks, and 34–37% of randomized peak sets.
Table 1.
Motif analysis of ChIP-Seq peaks
| Motifs | Consensus | EGR2 peaks | SOX10 peaks |
|---|---|---|---|
| EGR2 1 | YYCWSHCHSWBMHM | 0.57 | 0.54 |
| EGR2_ 2 | WSTGGGWR | 0.62 | 0.58 |
| EGR2_ 3 | RMASWSMARSW | 0.66 | 0.68 |
| SOX10_ 1 | MAADRVVBBCWTTGT | 0.45 | 0.58 |
| SOX10_ 2 | YCWGCCTB | 0.57 | 0.59 |
| SOX10_ 3 | RRRRSWGRRRR | 0.62 | 0.65 |
| SOX10_ 1_3bp | MAADR(N)3CWTTGT | 0.48 | 0.60 |
| SOX10 _1_4bp | MAADR(N)4CWTTGT | 0.46 | 0.60 |
| SOX10_ 1_5bp | MAADR(N)5CWTTGT | 0.46 | 0.59 |
| SOX10_1_6bp | MAADR(N)6CWTTGT | 0.45 | 0.57 |
| SOX10 _1 (3-6 bp) | MAADR(N)3–6CWTTGT | 0.69 | 0.77 |
Previous analysis had identified several genes in which EGR2 and SOX10 sites are closely juxtaposed, including Connexin 32, Mbp, Mpz and Pmp22 (14–18). Overall, analysis of the EGR2 and SOX10 peak sets showed that 6.45% of the EGR2 peaks overlapped with a SOX10 peak when allowing separation distance as large as 1000 bp and 11.09% of the SOX10 peaks overlapped with an EGR2 peak with the same separation distance. Table 2 shows overlapping information with different separation distances (complete listing in Supplementary Table S4). Iterative analysis of randomized peak sets of similar sizes indicated an average overlap of <0.05%. Therefore, the degree of overlap is substantially greater than chance compared to randomized peak sets of similar size.
Table 2.
EGR2 and SOX10 peak overlaps
| Separation distance | 0 bp | 150 bp | 200 bp | 300 bp | 1000 bp |
|---|---|---|---|---|---|
| EGR2 versus SOX10 (%) | 3.14 | 4.81 | 5.02 | 5.31 | 6.45 |
| SOX10 versus EGR2 (%) | 5.82 | 8.81 | 9.1 | 9.58 | 11.09 |
Identification of EGR2 peaks in regulated genes
Previous microarray studies of mice with a hypomorphic allele of Egr2 identified a complement of genes that are deregulated by Egr2 deficiency (5,46). Using the set of EGR2-dependent genes, we found that 146 out of 351 EGR2-induced genes are associated with peaks of EGR2 binding within 100 kb of the gene (Supplementary Table S5). A similar number of EGR2-induced genes have SOX10 peaks (136). Of the EGR2-induced genes that lack a significant EGR2 peak, 52 have at least one SOX10 peak.
Figure 2 displays EGR2 binding sites in several genes that exhibit reduced expression levels in EGR2-deficient mice (5). The Cntf promoter is regulated by SOX10 (29), and our analysis also demonstrated a significant peak of EGR2 binding in the promoter as well, which was confirmed by qPCR analysis of ChIP samples (Supplementary Table S3). This site likely accounts for its Egr2-dependent expression in peripheral nerve. Both Periaxin and Mp11 are dependent on Egr2 expression (5,47), and we observe a peak corresponding to a previously described EGR2 binding site in the Periaxin intron (20) as well as a peak just downstream of the Mp11 gene. This peak is distinct from previously described Egr2 binding sites within and upstream of the Mp11 gene (47).
There are specialized lipid components that have a high prevalence in myelin compared to other biological membranes, including cholesterol, long chain fatty acids and sphingolipids such as galactocerebrosides (and sulfatide derivatives) and Schwann cells synthesize these components de novo during myelination. EGR2 plays a role in control of lipid metabolism (13,21,35), and ChIP-seq analysis identified a number of EGR2 peaks in genes required for synthesis of myelin-enriched lipids (Figure 2). Binding of EGR2 to peak sites in lipid biosynthetic genes (e.g. Scd2 and Hmgcr) was confirmed by qPCR analysis (Supplementary Table S3). Ugt8 (also known as Cgt-ceramide galactosyl transferase) is required for production of galactocerebrosides, and fatty acid 2-hydroxylase (Fa2h) produces the high level of 2-hydroxygalactolipids in both central and peripheral myelin. Previous work had shown that Fa2h and Ugt8 are coordinately induced during peripheral nerve myelination (48), and both are reduced in peripheral nerve of the Egr2 hypomorph (5).
EGR2 controls exit from the cell cycle in postnatal Schwann cells (49–51), which involves cyclin-dependent kinase inhibitors (52). Peaks of EGR2 binding were identified in the p21/Cdkn1a and p27/Cdkn1b genes (Figure 2), which are dependent on EGR2 expression (5,51). The binding of EGR2 to the Cdkn1b peak was confirmed by qPCR analysis (Supplementary Table S3). EGR2 is also linked to structural aspects of the myelinating Schwann cell through regulation of utrophin (Utrn), which is part of the dystroglycan complex and is required for Schwann cell compartmentation (53). Utrn is decreased in the Egr2 hypomorph (5), and two strong peaks were associated with this gene.
Finally, analysis of EGR2 deficient mice had identified a complement of genes that are apparently repressed by EGR2 activity, including Oct6/Scip/Pou3f1, c-jun, Id2 and Sox2 (5,40,49,51). Some of these genes are repressed by EGR2 in conjunction with NAB corepressors and the NuRD chromatin remodeling complex (40,46). When examining genes that are activated in the absence of EGR2 (i.e. EGR2-repressed genes), 136 out of 436 genes have EGR2 peaks within 100 kb. A similar number, 156, of EGR2-repressed genes are associated with a SOX10 peak. These data are consistent with direct repression of some target genes by EGR2 and associated factors, as suggested by previous in vivo analyses (5,6,21,46,54,55). Gene ontology analysis revealed that EGR2-activated genes with EGR2 peaks were generally enriched in regulation of cell proliferation and lipid biosynthesis, whereas EGR2-repressed genes with EGR2 peaks had terms including cell cycle regulation and chromosome segregation (see Supplementary Table S8 for complete listing).
Genomic analysis of gene regulation by SOX10
We first examined the binding of SOX10 in the Sox10 locus (Figure 3), as previous analysis had identified multiple conserved sequences that mediate expression in the various cell types in which SOX10 is expressed (23,56,57). Many of the enhancers have been identified to bind SOX10 protein in vitro, consistent with an autoregulatory mechanism by which Sox10 expression is maintained. The ChIP-Seq analysis showed that SOX10 bound to several of these same conserved sequences in vivo. Two of the sites at −28 and −38 kb correspond to mouse elements that have been shown to drive expression in peripheral nerve in transgenic experiments, and binding to these two sites was confirmed by qPCR analysis (Supplementary Table S3). The MCS4 sequence at −28 kb—designated U3 in (23)—has shown that its ability to drive neural crest expression is impaired if SOX10 binding sites are mutated (24). The farthest upstream site (MCS7) lies within a region that was found to be deleted in the Sox10hry mouse strain, in which expression of Sox10 is lost (58).
To further correlate SOX10 binding data with gene activation, we sought to identify regulated genes by siRNA transfection that efficiently depletes Sox10 mRNA in the S16 rat Schwann cell line (59). This cell line expresses near physiological levels of many myelin genes (60), and previous ChIP analysis has demonstrated very good concordance of EGR2 and SOX10 binding in selected genes compared to in vivo analysis (16,20,32). The microarray analysis was performed using three independent sets of siRNA transfections in the S16 cell line. In each set, we consistently observed >85% reduction in Sox10 mRNA levels by quantitative PCR (data not shown), and we have also observed a large reduction in SOX10 protein (18). The results revealed reduced Egr2 expression as predicted from in vivo studies (25,26), and also other SOX10-regulated genes such as Mpz, Mbp, Dhh, Erbb3 and Pmp22 (2,3,18,27,30,61). This analysis identified 571 genes (Supplementary Table S6) that are downregulated >1.5-fold compared to S16 cells transfected with a negative control siRNA (called SOX10-activated genes), and 263 that are induced (SOX10-repressed genes).
To characterize the set of SOX10-regulated genes, we first identified regulated genes that had a SOX10 peak within 100 kb of the gene. Comparison with the ChIP-Seq data revealed that only 65 of the 263 SOX10-repressed genes have SOX10 peaks within 100 kb. In contrast, 242 of the 571 SOX10-activated genes had SOX10 peaks (Supplementary Table S7). Overall, this suggests that SOX10 most commonly acts as a direct activator of gene expression. The SOX10-activated genes associated with SOX10 peaks were further characterized by gene ontology analysis using DAVID (34). The enriched categories (at P-value cut-off of 0.1) in Supplementary Table S8 include several terms related to peripheral nerve development, cell cycle regulation, signaling and metabolic regulation of lipid synthesis.
One of the interesting findings of this analysis is that loss of SOX10 resulted in decreased expression of several Schwann cell markers, including p75/Ngfr, L1cam and Cnp. As shown in Figure 4, there is a strong peak for SOX10 upstream of the second promoter of the Cnp gene, which is specifically utilized in Schwann cells and oligodendrocytes (62), and this peak was validated by qPCR analysis (Supplementary Table S3). In addition, SOX10 binds sites on either side of the Peripheral Myelin Protein 2 (Pmp2) gene. Interestingly, one of the SOX10-regulated genes, Lgi4, is mutated in the spontaneous mouse mutant known as clawpaw which affects myelination (63). Recent analysis of a complete knockout of LGI4 function revealed a role in regulating Schwann cell proliferation (64), and LGI4 interacts with axonal ADAM22 to mediate neuron-glia interactions (65). There is a strong peak of SOX10 binding within the second intron of the Lgi4 gene and another further downstream. Sh3tc2, a gene mutated in CMT4C (66), was also decreased by Sox10 siRNA. In addition, a novel target gene, Claudin 19 (Cldn19), is a tight junction component in Schwann cells. Targeted disruption of the Cldn19 gene results in a significant peripheral nerve defect with slowed nerve conduction velocities (67). Significant peaks of SOX10 binding are observed just upstream of the transcription start site of Cldn19 and Sh3tc2, and the Cldn19 site was confirmed by qPCR analysis (Supplementary Table S3).
EGR2-independent gene regulation by SOX10
Reduced expression of some SOX10-regulated genes may be mediated indirectly by loss of Egr2 expression. To describe the unique physiological role of SOX10, we compared the list of SOX10-regulated genes with those that are deregulated in EGR2-deficient mice (Figure 5A). One of the notable aspects of the Sox10 siRNA array is that only a minority of the genes that are positively regulated by SOX10 are deficient in peripheral nerve of EGR2-deficient mice (34). This includes many of the major myelin-associated genes noted in the previous section, and ontology analysis of this group shows enrichment of terms such as axonogenesis and myelination (Figure 5A, Supplementary Table S8). As an example, the list of genes affected by SOX10, but not by EGR2 deficiency, includes Proteolipid protein (Plp), which is more highly expressed in oligodendrocytes. As further evidence that these genes are directly regulated by SOX10, we took advantage of previously published microarray analysis of early Schwann cell development (68), and found that many of this class of genes (∼70% of those represented in the previous array analysis, Supplementary Table S9) are significantly expressed in early embryonic development prior to Egr2 induction (E12), consistent with a primary role of SOX10 in their induction.
Figure 5.
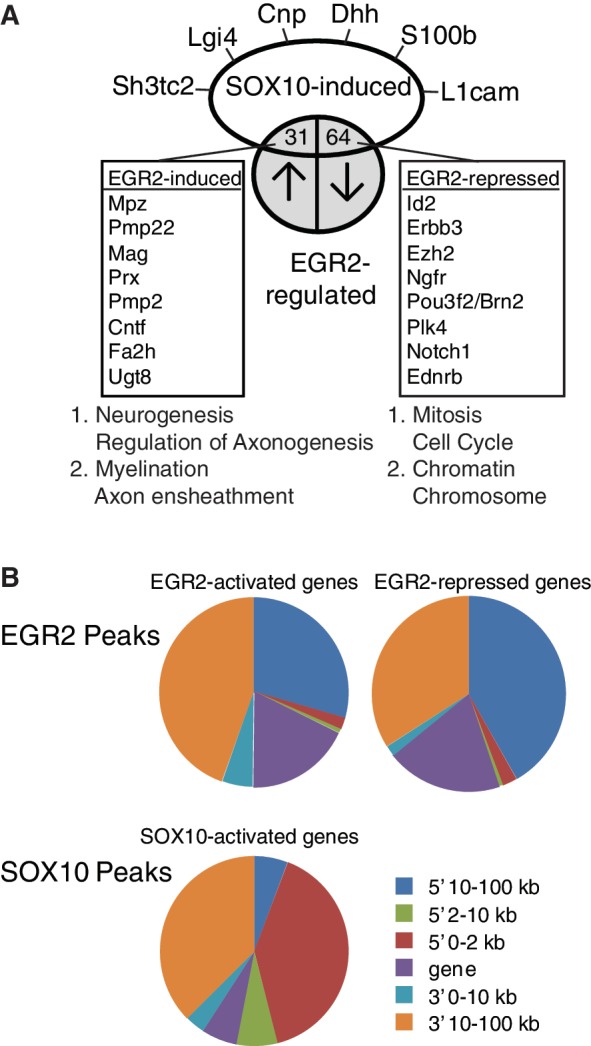
Analysis of SOX10-regulated genes. (A) Sox10 siRNA was introduced into the rat S16 cell line, and microarray analysis of three independent replicates was used to identify SOX10-regulated genes. Comparison with array data from the Egr2 hypomorph allele at P7 revealed a subset of genes that are positively regulated by both EGR2 and SOX10, and another set of genes that are apparently SOX10 induced, but repressed by EGR2 activity in post-natal Schwann cells. Functional annotation clustering performed by DAVID revealed clusters associated with the indicated terms (see Supplementary Table S8 for complete listing). (B) Peak location analysis was performed for those peaks located within 100 kb of genes that are repressed or activated by EGR2 or SOX10, as determined by microarray analysis of Egr2 hypomorphic mice (5,46) or siRNA analysis of SOX10-regulated genes in the S16 cell line (Supplementary Table S6). Pie charts represent relative proportions of peaks located within the gene body itself (gene), or 0–2, 2–10 and 10–100 kb away from the gene on either the 5′ or 3′ side. Peaks >100 kb are not included in the analysis. SOX10 peaks in SOX10 repressed genes are not included because of the low number of such peaks.
Location analysis of binding peaks for EGR2 and SOX10 relative to their regulated target genes shows distinct differences in the two factors (Figure 5B). EGR2 peaks generally resided more distally 5′ of regulated genes, or within the gene body itself, consistent with previous identification of regulatory elements in introns of the Mpz, Pmp22, Mag and Prx genes (18,20,32). In contrast, SOX10 peaks tend to be more proximally located 5′ of its activated genes. As noted above, relatively few genes apparently repressed by SOX10 are associated with peaks. The induction of some genes by SOX10 depletion may reflect regulation of several miRNAs by SOX10 in Schwann cells (42).
Divergent regulation of genes by SOX10 and EGR2
Interestingly, this analysis revealed a set of genes that are oppositely regulated by SOX10 and EGR2 (Figure 5A), in that they are expressed at lower levels in the presence of Sox10 siRNA, but become induced in the EGR2-deficient peripheral nerve (5,46). In most cases, the expression pattern in early Schwann cell development is consistent with this regulation in that these are highly expressed in embryonic Schwann cells (Supplementary Table S9), but become repressed as myelination proceeds. The sets of co-induced genes (SOX10- and EGR2-activated) and oppositely regulated genes (SOX10 activated, EGR2 repressed) were further analyzed by gene ontology analysis. Functional annotation clustering performed by DAVID (34) revealed clusters that were associated with myelination and axon ensheathment for co-induced genes, whereas the most highly enriched clusters for oppositely regulated genes include cell cycle and chromatin-related terms (see Supplementary Table S8 for complete listing).
One example of divergent regulation is Id2, which is expressed at high levels in embryonic and early postnatal Schwann cells, but this gene becomes repressed at later timepoints (69). It is possible that the high level of Id2 in early Schwann cell development is SOX10-dependent, but is subsequently repressed by the action of EGR2 and its NAB corepressors (5,40,46). Two additional examples include p75/Ngfr and Brn2/Pou3f2, both of which become repressed in myelinating Schwann cells (70,71). Binding of SOX10 and EGR2 in the Brn2 promoter were validated by qPCR (Supplementary Table S3). In addition, binding of SOX10 to a site in the Id2 gene (at −5 kb) was also validated (Supplementary Table S3), and binding of EGR2 to more proximal sites in the Id2 gene has been shown previously (40).
To test regulation of genes that were identified in these assays, we fused elements from the Mp11, Cntf, Cdkn1b (p27) and Prx genes (EGR2 activated), the Lgi4 and Cnp genes (SOX10 activated) and the Brn2, Id2 and Egfl8 genes (SOX10 activated and EGR2 repressed) upstream of a luciferase reporter gene. The fragments encompassed some of the EGR2 and/or SOX10 binding sites identified in the ChIPSeq peak analysis. Binding of EGR2 and/or SOX10 to the sites in the Prx, Mp11, Cdkn1b, Mp11, Cnp, Egfl8, Id2 and Brn2 genes was also validated by qPCR analysis of independent ChIP assays (Supplementary Table S3). The resulting constructs were tested for response to EGR2 and SOX10 expression in transfection assays performed in B16 cells (Table 3), which express endogenous SOX10, but not EGR2.
Interestingly, regulatory elements from Prx, Cntf, Cdkn1b, Cnp and Mp11 were substantially activated by EGR2, but the other reporters were relatively minimally affected by this factor. Although the B16 cell line expresses SOX10, increased expression of SOX10 alone activates the same promoters (albeit minimally with Cntf). Transfections of these reporters in cultured Schwann cells yielded little or no activation by SOX10 expression, presumably due to high levels of endogenous SOX10. The sequence surrounding an intronic SOX10 peak in the Lgi4 gene did not respond to either EGR2 or SOX10 transfection, suggesting a more prominent SOX10 peak downstream of Lgi4 may be more important (Figure 4). Interestingly, addition of EGR2 appeared to modestly reduce the SOX10-activated levels of the Brn2, Id2 and Egfl8 constructs, but the repression did not reach statistical significance. This may reflect insufficient levels of corepressors and/or incorrect chromatin structure on transfected templates, as several EGR2 repression mechanisms are chromatin mediated (40,72,73). In addition, the Id2 peak sequence used here lacked EGR2 binding sites that are more proximal to the gene (40). Therefore, it is possible that SOX10 activation and EGR2 repression are mediated by distinct elements.
DISCUSSION
Both EGR2 and SOX10 are involved in regulation of multiple tissue types besides Schwann cells, but the interaction of these two factors plays a major role in establishment and differentiation of Schwann cells (1). To elucidate the genomic mechanisms by which these two factors operate, we have performed the first genome-wide analysis of transcription factor binding in myelinating glia in vivo. The results show that there is substantial colocalization of these two factors in regulation of many major myelin genes. The degree of colocalization is less than previously described in our study of ChIP-chip binding (21), but this study had focused on a subset of genes that are co-regulated during the myelination process. In addition, the colocalization is probably a minimum estimate, since there are many sites in which binding of either EGR2 or SOX10 is significantly stronger than the other. However, some colocalization probably reflects the general propensity of DNA-binding proteins to bind areas of open chromatin throughout the genome (74).
Interestingly, the predominance of either factor at specific sites likely reflects functional differences in the roles of these proteins. For example, sites with high amounts of SOX10 may become occupied during embryonic development when myelin genes are expressed at low yet detectable levels. Therefore, induced expression of EGR2 in myelinating Schwann cells may help amplify enhancer activity of such sites. Moreover, these results illustrate the power of combinatorial ChIP-Seq, since it has allowed us to identify enhancer elements that would not have been identified through analysis of either factor alone. It should be noted that while EGR2 is exclusively expressed in ∼50–80% of Schwann cells in sciatic nerve that are myelinating (38,75), SOX10 is also expressed in non-myelinating Schwann cells, and therefore it is possible that some SOX10 peaks may be unique to either state. We have not yet developed a satisfactory means to separate myelinating Schwann cells from their non-myelinating counterparts in sufficient numbers required for ChIP assays. However, ChIP assays in the S16 cell line have confirmed binding of SOX10 to a number of sites in myelin genes (16,18,20,31,32).
As has been observed in other systems (76), the resolution of our ChIP-Seq analysis is significantly improved compared to ChIP-chip studies, and in many cases, the binding sites can be localized within 50–100 bp. In addition, the fact that signal-to-noise is not dependent on hybridization efficiency, but rather read number, yields a digital readout with a much greater dynamic range. In addition, ChIP-Seq analysis compares very favorably with qPCR analysis of individual sites, since qPCR validation is highly influenced by primer positioning.
The development of several mouse genetic tools to study SOX10 function have substantially advanced our understanding of how this transcription factor regulates transitions from Schwann cell precursors to immature, promyelinating and myelinating Schwann cells (2,3,61,77). Several target genes of SOX10 have been identified, including Mpz, Mbp, Cntf, Oct6/Scip and Erbb3 (14-16,23,26,29,78). In addition, we have identified a number of novel target genes of SOX10 activity, including Sh3tc2, Lgi4 and Cldn19, which are required for formation of peripheral myelin (63,64,67,79). Interestingly, the regulation of Itga6 and Lgi4 by SOX10 reveals connections with several molecular mediators of axon/Schwann cell interactions, such as the Erbb3/Erbb2, integrin a6 and Lgi4 partners of neuregulin-1, laminin and Adam22, respectively (65,80).
However, analysis of SOX10 in myelinating Schwann cells is somewhat complicated given that SOX10 is also directly involved in induction of the EGR2 transcription factor. This has been shown in vivo (25,26), as well as in siRNA analysis performed in the S16 cell line (18). Our data identify several lines of evidence that SOX10 activates a gene expression program that is independent in many ways from the activity of EGR2. First of all, our ChIP-Seq analysis identified many strong binding sites of SOX10 that are proximal to SOX10-regulated genes. Despite a significant level of colocalization with EGR2, there are a number of sites that do not colocalize with EGR2 activity, although presumably SOX10 is able to interact with other factors such as OCT6 and BRN2 (POU3F1/POU3F2). Second, analysis of SOX10-regulated genes using siRNA analysis of S16 cells identified a number of genes regulated by SOX10, but only a subset of these are also deregulated in peripheral nerve of EGR2-deficient mice, again suggesting that the SOX10 program is distinct from that of EGR2. Finally, one surprising finding was that there was a subset of SOX10-activated genes that are oppositely regulated (repressed) by the activity of EGR2. Several genes such as Id2, Brn2/Pou3f2 and Ngfr are induced by the expression of SOX10 and become repressed as myelination initiates, but become constitutively expressed at a high level in EGR2-deficient mice (5).
Our working model is that expression of SOX10 in embryonic stages is devoted to maintenance of a pre-differentiated state in proliferating Schwann cells (61). The subsequent induction of EGR2 in myelinating Schwann cells by the combined activation of SOX10 and OCT6/POU3f1 (25,26) would then initiate cell cycle arrest and final differentiation, in part by repression of immature Schwann cell genes that were activated by SOX10. While our study did not examine SOX10 target gene regulation in pre-myelinating Schwann cells, a primary example of this is the SOX10 activation of Oct6/Pou3f1 expression in promyelinating Schwann cells, which is then subsequently repressed by EGR2 (22,49,77). However, not all immature Schwann cell genes appear to be regulated by SOX10, as there was little change in the expression of other immature Schwann cell genes, such as c-jun and Sox2. Taken together, these data outline a unique genomic role of SOX10 in Schwann cell biology, which includes not only collaboration with EGR2 in regulation of major myelin genes, but also a role in gene activation that is opposed by EGR2 in a specific gene subset. Overall, these studies provide a framework for elucidating the genomic roles of EGR2 and SOX10 in myelinating Schwann cells. It is anticipated that further studies of other transcription factors will further deepen our understanding of transcriptional regulation in Schwann cell differentiation.
SUPPLEMENTARY DATA
Supplementary Data are available at NAR Online: Supplementary Tables 1–9.
FUNDING
National Institutes of Health [HD41590 and its ARRA supplement HD041590-09S1 to J.S., HG03747 to S.K., P30 core grant HD03352]; the Charcot-Marie-Tooth Association. Funding for open access charge: NIH [R01HD41590].
Conflict of interest statement. None declared.
Supplementary Material
ACKNOWLEDGEMENTS
We thank Richard Quarles for providing the S16 cell line, Marie Adams and Eric Cabot at the UW Biotechnology Center for performance and preliminary analysis of Illumina sequencing, and Nolan Gokey for assistance in data analysis.
REFERENCES
- 1.Svaren J, Meijer D. The molecular machinery of myelin gene transcription in Schwann cells. Glia. 2008;56:1541–1551. doi: 10.1002/glia.20767. [DOI] [PMC free article] [PubMed] [Google Scholar]
- 2.Finzsch M, Schreiner S, Kichko T, Reeh P, Tamm E, Bösl M, Meijer D, Wegner M. Sox10 is required for Schwann cell identity and progression beyond the immature Schwann cell stage. J. Cell Biol. 2010;189:701–712. doi: 10.1083/jcb.200912142. [DOI] [PMC free article] [PubMed] [Google Scholar]
- 3.Britsch S, Goerich DE, Riethmacher D, Peirano RI, Rossner M, Nave KA, Birchmeier C, Wegner M. The transcription factor Sox10 is a key regulator of peripheral glial development. Genes Dev. 2001;15:66–78. doi: 10.1101/gad.186601. [DOI] [PMC free article] [PubMed] [Google Scholar]
- 4.Topilko P, Schneider-Maunoury S, Levi G, Baron-Van Evercooren A, Chennoufi AB, Seitanidou T, Babinet C, Charnay P. Krox-20 controls myelination in the peripheral nervous system. Nature. 1994;371:796–799. doi: 10.1038/371796a0. [DOI] [PubMed] [Google Scholar]
- 5.Le N, Nagarajan R, Wang JY, Araki T, Schmidt RE, Milbrandt J. Analysis of congenital hypomyelinating Egr2Lo/Lo nerves identifies Sox2 as an inhibitor of Schwann cell differentiation and myelination. Proc. Natl Acad. Sci. USA. 2005;102:2596–2601. doi: 10.1073/pnas.0407836102. [DOI] [PMC free article] [PubMed] [Google Scholar]
- 6.Decker L, Desmarquet-Trin-Dinh C, Taillebourg E, Ghislain J, Vallat JM, Charnay P. Peripheral myelin maintenance is a dynamic process requiring constant Krox20 expression. J. Neurosci. 2006;26:9771–9779. doi: 10.1523/JNEUROSCI.0716-06.2006. [DOI] [PMC free article] [PubMed] [Google Scholar]
- 7.Bremer M, Fröb F, Kichko T, Reeh P, Tamm ER, Suter U, Wegner M. Sox10 is required for Schwann-cell homeostasis and myelin maintenance in the adult peripheral nerve. Glia. 2011;59:1022–1032. doi: 10.1002/glia.21173. [DOI] [PubMed] [Google Scholar]
- 8.Warner LE, Mancias P, Butler IJ, McDonald CM, Keppen L, Koob KG, Lupski JR. Mutations in the early growth response 2 (EGR2) gene are associated with hereditary myelinopathies. Nat. Genet. 1998;18:382–384. doi: 10.1038/ng0498-382. [DOI] [PubMed] [Google Scholar]
- 9.Timmerman V, De Jonghe P, Ceuterick C, De Vriendt E, Lofgren A, Nelis E, Warner LE, Lupski JR, Martin JJ, van Broeckhoven C. Novel missense mutation in the early growth response 2 gene associated with Dejerine-Sottas syndrome phenotype. Neurology. 1999;52:1827–1832. doi: 10.1212/wnl.52.9.1827. [DOI] [PubMed] [Google Scholar]
- 10.Reilly MM, Murphy SM, Laurá M. Charcot-Marie-Tooth disease. J. Peripher. Nerv. Syst. 2011;16:1–14. doi: 10.1111/j.1529-8027.2011.00324.x. [DOI] [PubMed] [Google Scholar]
- 11.Inoue K, Shilo K, Boerkoel CF, Crowe C, Sawady J, Lupski JR, Agamanolis DP. Congenital hypomyelinating neuropathy, central dysmyelination, and Waardenburg-Hirschsprung disease: phenotypes linked by SOX10 mutation. Ann. Neurol. 2002;52:836–842. doi: 10.1002/ana.10404. [DOI] [PubMed] [Google Scholar]
- 12.Inoue K, Khajavi M, Ohyama T, Hirabayashi S, Wilson J, Reggin JD, Mancias P, Butler IJ, Wilkinson MF, Wegner M, et al. Molecular mechanism for distinct neurological phenotypes conveyed by allelic truncating mutations. Nat. Genet. 2004;36:361–369. doi: 10.1038/ng1322. [DOI] [PubMed] [Google Scholar]
- 13.Nagarajan R, Svaren J, Le N, Araki T, Watson M, Milbrandt J. EGR2 mutations in inherited neuropathies dominant-negatively inhibit myelin gene expression. Neuron. 2001;30:355–368. doi: 10.1016/s0896-6273(01)00282-3. [DOI] [PubMed] [Google Scholar]
- 14.Bondurand N, Girard M, Pingault V, Lemort N, Dubourg O, Goossens M. Human Connexin 32, a gap junction protein altered in the X-linked form of Charcot-Marie-Tooth disease, is directly regulated by the transcription factor SOX10. Hum. Mol. Genet. 2001;10:2783–2795. doi: 10.1093/hmg/10.24.2783. [DOI] [PubMed] [Google Scholar]
- 15.Denarier E, Forghani R, Farhadi HF, Dib S, Dionne N, Friedman HC, Lepage P, Hudson TJ, Drouin R, Peterson A. Functional organization of a Schwann cell enhancer. J. Neurosci. 2005;25:11210–11217. doi: 10.1523/JNEUROSCI.2596-05.2005. [DOI] [PMC free article] [PubMed] [Google Scholar]
- 16.Jang SW, Svaren J. Induction of myelin protein zero by early growth response 2 through upstream and intragenic elements. J. Biol. Chem. 2009;284:20111–20120. doi: 10.1074/jbc.M109.022426. [DOI] [PMC free article] [PubMed] [Google Scholar]
- 17.LeBlanc SE, Jang SW, Ward RM, Wrabetz L, Svaren J. Direct regulation of myelin protein zero expression by the Egr2 transactivator. J. Biol. Chem. 2006;281:5453–5460. doi: 10.1074/jbc.M512159200. [DOI] [PubMed] [Google Scholar]
- 18.Jones EA, Lopez-Anido C, Srinivasan R, Krueger C, Chang LW, Nagarajan R, Svaren J. Regulation of the PMP22 Gene through an Intronic Enhancer. J. Neurosci. 2011;31:4242–4250. doi: 10.1523/JNEUROSCI.5893-10.2011. [DOI] [PMC free article] [PubMed] [Google Scholar]
- 19.Jones EA, Brewer MH, Srinivasan R, Krueger C, Sun G, Charney KN, Keles S, Antonellis A, Svaren J. Distal enhancers upstream of the Charcot-Marie-Tooth type 1A disease gene PMP22. Hum. Mol. Genet. 2012;21:1581–1591. doi: 10.1093/hmg/ddr595. [DOI] [PMC free article] [PubMed] [Google Scholar]
- 20.Jones EA, Jang SW, Mager GM, Chang L-W, Srinivasan R, Gokey NG, Ward RM, Nagarajan R, Svaren J. Interactions of Sox10 and Egr2 in myelin gene regulation. Neuron Glia Biol. 2007;3:377–387. doi: 10.1017/S1740925X08000173. [DOI] [PMC free article] [PubMed] [Google Scholar]
- 21.Jang SW, Srinivasan R, Jones EA, Sun G, Keles S, Krueger C, Chang LW, Nagarajan R, Svaren J. Locus-wide identification of Egr2/Krox20 regulatory targets in myelin genes. J. Neurochem. 2010;115:1409–1420. doi: 10.1111/j.1471-4159.2010.07045.x. [DOI] [PMC free article] [PubMed] [Google Scholar]
- 22.Jagalur NB, Ghazvini M, Mandemakers W, Driegen S, Maas A, Jones EA, Jaegle M, Grosveld F, Svaren J, Meijer D. Functional dissection of the oct6 schwann cell enhancer reveals an essential role for dimeric sox10 binding. J. Neurosci. 2011;31:8585–8594. doi: 10.1523/JNEUROSCI.0659-11.2011. [DOI] [PMC free article] [PubMed] [Google Scholar]
- 23.Werner T, Hammer A, Wahlbuhl M, Bosl MR, Wegner M. Multiple conserved regulatory elements with overlapping functions determine Sox10 expression in mouse embryogenesis. Nucleic Acids Res. 2007;35:6526–6538. doi: 10.1093/nar/gkm727. [DOI] [PMC free article] [PubMed] [Google Scholar]
- 24.Wahlbuhl M, Reiprich S, Vogl MR, Bösl MR, Wegner M. Transcription factor Sox10 orchestrates activity of a neural crest-specific enhancer in the vicinity of its gene. Nucleic Acids Res. 2012;40:88–101. doi: 10.1093/nar/gkr734. [DOI] [PMC free article] [PubMed] [Google Scholar]
- 25.Ghislain J, Charnay P. Control of myelination in Schwann cells: a Krox20 cis-regulatory element integrates Oct6, Brn2 and Sox10 activities. EMBO Rep. 2006;7:52–58. doi: 10.1038/sj.embor.7400573. [DOI] [PMC free article] [PubMed] [Google Scholar]
- 26.Reiprich S, Kriesch J, Schreiner S, Wegner M. Activation of Krox20 gene expression by Sox10 in myelinating Schwann cells. J. Neurochem. 2010;112:744–754. doi: 10.1111/j.1471-4159.2009.06498.x. [DOI] [PubMed] [Google Scholar]
- 27.Peirano RI, Goerich DE, Riethmacher D, Wegner M. Protein zero gene expression is regulated by the glial transcription factor Sox10. Mol. Cell Biol. 2000;20:3198–3209. doi: 10.1128/mcb.20.9.3198-3209.2000. [DOI] [PMC free article] [PubMed] [Google Scholar]
- 28.Prasad MK, Reed X, Gorkin DU, Cronin JC, McAdow AR, Chain K, Hodonsky CJ, Jones EA, Svaren J, Antonellis A, et al. SOX10 directly modulates ERBB3 transcription via an intronic neural crest enhancer. BMC Dev. Biol. 2011;11:40. doi: 10.1186/1471-213X-11-40. [DOI] [PMC free article] [PubMed] [Google Scholar]
- 29.Ito Y, Wiese S, Funk N, Chittka A, Rossoll W, Bömmel H, Watabe K, Wegner M, Sendtner M. Sox10 regulates ciliary neurotrophic factor gene expression in Schwann cells. Proc. Natl Acad. Sci. USA. 2006;103:7871–7876. doi: 10.1073/pnas.0602332103. [DOI] [PMC free article] [PubMed] [Google Scholar]
- 30.Lee KE, Nam S, Cho EA, Seong I, Limb JK, Lee S, Kim J. Identification of direct regulatory targets of the transcription factor Sox10 based on function and conservation. BMC Genomics. 2008;9:408. doi: 10.1186/1471-2164-9-408. [DOI] [PMC free article] [PubMed] [Google Scholar]
- 31.LeBlanc SE, Ward RM, Svaren J. Neuropathy-associated Egr2 mutants disrupt cooperative activation of myelin protein zero by Egr2 and Sox10. Mol. Cell Biol. 2007;27:3521–3529. doi: 10.1128/MCB.01689-06. [DOI] [PMC free article] [PubMed] [Google Scholar]
- 32.Jang SW, LeBlanc SE, Roopra A, Wrabetz L, Svaren J. In vivo detection of Egr2 binding to target genes during peripheral nerve myelination. J. Neurochem. 2006;98:1678–1687. doi: 10.1111/j.1471-4159.2006.04069.x. [DOI] [PubMed] [Google Scholar]
- 33.Bailey TL, Elkan C. Conference on Intelligent Systems for Molecular Biology. Menlo Park, CA: AAAI Press; 1994. pp. 28–36. [PubMed] [Google Scholar]
- 34.Huang dW, Sherman BT, Lempicki RA. Systematic and integrative analysis of large gene lists using DAVID bioinformatics resources. Nat. Protocols. 2009;4:44–57. doi: 10.1038/nprot.2008.211. [DOI] [PubMed] [Google Scholar]
- 35.LeBlanc SE, Srinivasan R, Ferri C, Mager GM, Gillian-Daniel AL, Wrabetz L, Svaren J. Regulation of cholesterol/lipid biosynthetic genes by Egr2/Krox20 during peripheral nerve myelination. J. Neurochem. 2005;93:737–748. doi: 10.1111/j.1471-4159.2005.03056.x. [DOI] [PubMed] [Google Scholar]
- 36.Sevetson B, Svaren J, Milbrandt J. A novel activation function for NAB proteins in EGR-dependent transcription of the luteinizing hormone beta gene. J. Biol. Chem. 2000;275:9749–9757. doi: 10.1074/jbc.275.13.9749. [DOI] [PubMed] [Google Scholar]
- 37.Kuhlbrodt K, Herbarth B, Sock E, Hermans-Borgmeyer I, Wegner M. Sox10, a novel transcriptional modulator in glial cells. J. Neurosci. 1998;18:237–250. doi: 10.1523/JNEUROSCI.18-01-00237.1998. [DOI] [PMC free article] [PubMed] [Google Scholar]
- 38.Zorick TS, Syroid DE, Arroyo E, Scherer SS, Lemke G. The transcription factors SCIP and Krox-20 mark distinct stages and cell fates in Schwann cell differentiation. Mol. Cell Neurosci. 1996;8:129–145. doi: 10.1006/mcne.1996.0052. [DOI] [PubMed] [Google Scholar]
- 39.Kuan PF, Chung D, Pan G, Thomson JA, Stewart R, Keles S. A statistical framework for the analysis of ChIP-Seq data. J. Am. Stat. Assoc. 2011;106:891–903. doi: 10.1198/jasa.2011.ap09706. [DOI] [PMC free article] [PubMed] [Google Scholar]
- 40.Mager GM, Ward RM, Srinivasan R, Jang SW, Wrabetz L, Svaren J. Active gene repression by the EGR2/NAB complex during peripheral nerve myelination. J. Biol. Chem. 2008;283:18187–18197. doi: 10.1074/jbc.M803330200. [DOI] [PMC free article] [PubMed] [Google Scholar]
- 41.Srinivasan R, Jang SW, Ward RM, Sachdev S, Ezashi T, Svaren J. Differential regulation of NAB corepressor genes in Schwann cells. BMC Mol. Biol. 2007;8:117. doi: 10.1186/1471-2199-8-117. [DOI] [PMC free article] [PubMed] [Google Scholar]
- 42.Gokey NG, Srinivasan R, Lopez-Anido C, Krueger C, Svaren J. Developmental regulation of miRNA expression in Schwann cells. Mol. Cell. Biol. 2012;32:558–568. doi: 10.1128/MCB.06270-11. [DOI] [PMC free article] [PubMed] [Google Scholar]
- 43.Swirnoff AH, Milbrandt J. DNA-binding specificity of NGFI-A and related zinc finger transcription factors. Mol. Cell. Biol. 1995;15:2275–2287. doi: 10.1128/mcb.15.4.2275. [DOI] [PMC free article] [PubMed] [Google Scholar]
- 44.Mertin S, McDowall SG, Harley VR. The DNA-binding specificity of SOX9 and other SOX proteins. Nucleic Acids Res. 1999;27:1359–1364. doi: 10.1093/nar/27.5.1359. [DOI] [PMC free article] [PubMed] [Google Scholar]
- 45.Peirano RI, Wegner M. The glial transcription factor Sox10 binds to DNA both as monomer and dimer with different functional consequences. Nucleic Acids Res. 2000;28:3047–3055. doi: 10.1093/nar/28.16.3047. [DOI] [PMC free article] [PubMed] [Google Scholar]
- 46.Le N, Nagarajan R, Wang JY, Svaren J, LaPash C, Araki T, Schmidt RE, Milbrandt J. Nab proteins are essential for peripheral nervous system myelination. Nat. Neurosci. 2005;8:932–940. doi: 10.1038/nn1490. [DOI] [PubMed] [Google Scholar]
- 47.Ryu EJ, Yang M, Gustin JA, Chang LW, Freimuth RR, Nagarajan R, Milbrandt J. Analysis of peripheral nerve expression profiles identifies a novel myelin glycoprotein, MP11. J. Neurosci. 2008;28:7563–7573. doi: 10.1523/JNEUROSCI.1659-08.2008. [DOI] [PMC free article] [PubMed] [Google Scholar]
- 48.Maldonado EN, Alderson NL, Monje PV, Wood PM, Hama H. FA2H is responsible for the formation of 2-hydroxy galactolipids in peripheral nervous system myelin. J. Lipid Res. 2008;49:153–161. doi: 10.1194/jlr.M700400-JLR200. [DOI] [PMC free article] [PubMed] [Google Scholar]
- 49.Zorick TS, Syroid DE, Brown A, Gridley T, Lemke G. Krox-20 controls SCIP expression, cell cycle exit and susceptibility to apoptosis in developing myelinating Schwann cells. Development. 1999;126:1397–1406. doi: 10.1242/dev.126.7.1397. [DOI] [PubMed] [Google Scholar]
- 50.Arthur-Farraj P, Mirsky R, Parkinson DB, Jessen KR. A double point mutation in the DNA-binding region of Egr2 switches its function from inhibition to induction of proliferation: a potential contribution to the development of congenital hypomyelinating neuropathy. Neurobiol. Dis. 2006;24:159–169. doi: 10.1016/j.nbd.2006.06.006. [DOI] [PubMed] [Google Scholar]
- 51.Parkinson DB, Bhaskaran A, Droggiti A, Dickinson S, D'Antonio M, Mirsky R, Jessen KR. Krox-20 inhibits Jun-NH2-terminal kinase/c-Jun to control Schwann cell proliferation and death. J. Cell Biol. 2004;164:385–394. doi: 10.1083/jcb.200307132. [DOI] [PMC free article] [PubMed] [Google Scholar]
- 52.Atanasoski S, Boller D, De Ventura L, Koegel H, Boentert M, Young P, Werner S, Suter U. Cell cycle inhibitors p21 and p16 are required for the regulation of Schwann cell proliferation. Glia. 2006;53:147–157. doi: 10.1002/glia.20263. [DOI] [PubMed] [Google Scholar]
- 53.Court FA, Hewitt JE, Davies K, Patton BL, Uncini A, Wrabetz L, Feltri ML. A laminin-2, dystroglycan, utrophin axis is required for compartmentalization and elongation of myelin segments. J. Neurosci. 2009;29:3908–3919. doi: 10.1523/JNEUROSCI.5672-08.2009. [DOI] [PMC free article] [PubMed] [Google Scholar]
- 54.Baloh RH, Strickland A, Ryu E, Le N, Fahrner T, Yang M, Nagarajan R, Milbrandt J. Congenital hypomyelinating neuropathy with lethal conduction failure in mice carrying the Egr2 I268N mutation. J. Neurosci. 2009;29:2312–2321. doi: 10.1523/JNEUROSCI.2168-08.2009. [DOI] [PMC free article] [PubMed] [Google Scholar]
- 55.Desmazieres A, Decker L, Vallat JM, Charnay P, Gilardi-Hebenstreit P. Disruption of Krox20-Nab interaction in the mouse leads to peripheral neuropathy with biphasic evolution. J. Neurosci. 2008;28:5891–5900. doi: 10.1523/JNEUROSCI.5187-07.2008. [DOI] [PMC free article] [PubMed] [Google Scholar]
- 56.Deal KK, Cantrell VA, Chandler RL, Saunders TL, Mortlock DP, Southard-Smith EM. Distant regulatory elements in a Sox10-beta GEO BAC transgene are required for expression of Sox10 in the enteric nervous system and other neural crest-derived tissues. Dev. Dyn. 2006;235:1413–1432. doi: 10.1002/dvdy.20769. [DOI] [PubMed] [Google Scholar]
- 57.Antonellis A, Huynh JL, Lee-Lin SQ, Vinton RM, Renaud G, Loftus SK, Elliot G, Wolfsberg TG, Green ED, McCallion AS, et al. Identification of neural crest and glial enhancers at the mouse Sox10 locus through transgenesis in zebrafish. PLoS Genet. 2008;4:e1000174. doi: 10.1371/journal.pgen.1000174. [DOI] [PMC free article] [PubMed] [Google Scholar]
- 58.Antonellis A, Bennett WR, Menheniott TR, Prasad AB, Lee-Lin SQ, Green ED, Paisley D, Kelsh RN, Pavan WJ, Ward A, et al. Deletion of long-range sequences at Sox10 compromises developmental expression in a mouse model of Waardenburg-Shah (WS4) syndrome. Hum. Mol. Genet. 2006;15:259–271. doi: 10.1093/hmg/ddi442. [DOI] [PubMed] [Google Scholar]
- 59.Toda K, Small JA, Goda S, Quarles RH. Biochemical and cellular properties of three immortalized Schwann cell lines expressing different levels of the myelin-associated glycoprotein. J. Neurochem. 1994;63:1646–1657. doi: 10.1046/j.1471-4159.1994.63051646.x. [DOI] [PubMed] [Google Scholar]
- 60.Hai M, Muja N, DeVries GH, Quarles RH, Patel PI. Comparative analysis of Schwann cell lines as model systems for myelin gene transcription studies. J. Neurosci. Res. 2002;69:497–508. doi: 10.1002/jnr.10327. [DOI] [PubMed] [Google Scholar]
- 61.Sonnenberg-Riethmacher E, Miehe M, Stolt CC, Goerich DE, Wegner M, Riethmacher D. Development and degeneration of dorsal root ganglia in the absence of the HMG-domain transcription factor Sox10. Mech. Dev. 2001;109:253–265. doi: 10.1016/s0925-4773(01)00547-0. [DOI] [PubMed] [Google Scholar]
- 62.Scherer SS, Braun PE, Grinspan J, Collarini E, Wang DY, Kamholz J. Differential regulation of the 2′,3′-cyclic nucleotide 3′-phosphodiesterase gene during oligodendrocyte development. Neuron. 1994;12:1363–1375. doi: 10.1016/0896-6273(94)90451-0. [DOI] [PubMed] [Google Scholar]
- 63.Bermingham JR, Jr, Shearin H, Pennington J, O'Moore J, Jaegle M, Driegen S, van Zon A, Darbas A, Ozkaynak E, Ryu EJ, et al. The claw paw mutation reveals a role for Lgi4 in peripheral nerve development. Nat. Neurosci. 2006;9:76–84. doi: 10.1038/nn1598. [DOI] [PubMed] [Google Scholar]
- 64.Nishino J, Saunders TL, Sagane K, Morrison SJ. Lgi4 promotes the proliferation and differentiation of glial lineage cells throughout the developing peripheral nervous system. J. Neurosci. 2010;30:15228–15240. doi: 10.1523/JNEUROSCI.2286-10.2010. [DOI] [PMC free article] [PubMed] [Google Scholar]
- 65.Ozkaynak E, Abello G, Jaegle M, van Berge L, Hamer D, Kegel L, Driegen S, Sagane K, Bermingham JR, Meijer D. Adam22 is a major neuronal receptor for Lgi4-mediated Schwann cell signaling. J. Neurosci. 2010;30:3857–3864. doi: 10.1523/JNEUROSCI.6287-09.2010. [DOI] [PMC free article] [PubMed] [Google Scholar]
- 66.Senderek J, Bergmann C, Stendel C, Kirfel J, Verpoorten N, De Jonghe P, Timmerman V, Chrast R, Verheijen MH, Lemke G, et al. Mutations in a gene encoding a novel SH3/TPR domain protein cause autosomal recessive Charcot-Marie-Tooth type 4C neuropathy. Am. J. Hum. Genet. 2003;73:1106–1119. doi: 10.1086/379525. [DOI] [PMC free article] [PubMed] [Google Scholar]
- 67.Miyamoto T, Morita K, Takemoto D, Takeuchi K, Kitano Y, Miyakawa T, Nakayama K, Okamura Y, Sasaki H, Miyachi Y, et al. Tight junctions in Schwann cells of peripheral myelinated axons: a lesson from claudin-19-deficient mice. J. Cell Biol. 2005;169:527–538. doi: 10.1083/jcb.200501154. [DOI] [PMC free article] [PubMed] [Google Scholar]
- 68.Buchstaller J, Sommer L, Bodmer M, Hoffmann R, Suter U, Mantei N. Efficient isolation and gene expression profiling of small numbers of neural crest stem cells and developing Schwann cells. J. Neurosci. 2004;24:2357–2365. doi: 10.1523/JNEUROSCI.4083-03.2004. [DOI] [PMC free article] [PubMed] [Google Scholar]
- 69.Stewart HJ, Zoidl G, Rossner M, Brennan A, Zoidl C, Nave KA, Mirsky R, Jessen KR. Helix-loop-helix proteins in Schwann cells: a study of regulation and subcellular localization of Ids, REB, and E12/47 during embryonic and postnatal development. J. Neurosci. Res. 1997;50:684–701. doi: 10.1002/(SICI)1097-4547(19971201)50:5<684::AID-JNR6>3.0.CO;2-D. [DOI] [PubMed] [Google Scholar]
- 70.Jaegle M, Ghazvini M, Mandemakers W, Piirsoo M, Driegen S, Levavasseur F, Raghoenath S, Grosveld F, Meijer D. The POU proteins Brn-2 and Oct-6 share important functions in Schwann cell development. Genes Dev. 2003;17:1380–1391. doi: 10.1101/gad.258203. [DOI] [PMC free article] [PubMed] [Google Scholar]
- 71.Heumann R, Lindholm D, Bandtlow C, Meyer M, Radeke MJ, Misko TP, Shooter E, Thoenen H. Differential regulation of mRNA encoding nerve growth factor and its receptor in rat sciatic nerve during development, degeneration, and regeneration: role of macrophages. Proc. Natl Acad. Sci. USA. 1987;84:8735–8739. doi: 10.1073/pnas.84.23.8735. [DOI] [PMC free article] [PubMed] [Google Scholar]
- 72.Pospisil V, Vargova K, Kokavec J, Rybarova J, Savvulidi F, Jonasova A, Necas E, Zavadil J, Laslo P, Stopka T. Epigenetic silencing of the oncogenic miR-17-92 cluster during PU.1-directed macrophage differentiation. EMBO J. 2011;30:4450–4464. doi: 10.1038/emboj.2011.317. [DOI] [PMC free article] [PubMed] [Google Scholar]
- 73.Hung H, Kohnken R, Svaren J. The nucleosome remodeling and deacetylase chromatin remodeling (NuRD) complex is required for peripheral nerve myelination. J. Neurosci. 2012;32:1517–1527. doi: 10.1523/JNEUROSCI.2895-11.2012. [DOI] [PMC free article] [PubMed] [Google Scholar]
- 74.Biggin MD. Animal transcription networks as highly connected, quantitative continua. Dev. Cell. 2011;21:611–626. doi: 10.1016/j.devcel.2011.09.008. [DOI] [PubMed] [Google Scholar]
- 75.Topilko P, Levi G, Merlo G, Mantero S, Desmarquet C, Mancardi G, Charnay P. Differential regulation of the zinc finger genes Krox-20 and Krox-24 (Egr-1) suggests antagonistic roles in Schwann cells. J. Neurosci. Res. 1997;50:702–712. doi: 10.1002/(SICI)1097-4547(19971201)50:5<702::AID-JNR7>3.0.CO;2-L. [DOI] [PubMed] [Google Scholar]
- 76.Rozowsky J, Euskirchen G, Auerbach RK, Zhang ZD, Gibson T, Bjornson R, Carriero N, Snyder M, Gerstein MB. PeakSeq enables systematic scoring of ChIP-seq experiments relative to controls. Nat. Biotechnol. 2009;27:66–75. doi: 10.1038/nbt.1518. [DOI] [PMC free article] [PubMed] [Google Scholar]
- 77.Schreiner S, Cossais F, Fischer K, Scholz S, Bosl MR, Holtmann B, Sendtner M, Wegner M. Hypomorphic Sox10 alleles reveal novel protein functions and unravel developmental differences in glial lineages. Development. 2007;134:3271–3281. doi: 10.1242/dev.003350. [DOI] [PubMed] [Google Scholar]
- 78.Hodonsky CJ, Kleinbrink EL, Charney KN, Prasad M, Bessling SL, Jones EA, Srinivasan R, Svaren J, McCallion AS, Antonellis A. SOX10 regulates expression of the SH3-domain kinase binding protein 1 (Sh3kbp1) locus in Schwann cells via an alternative promoter. Mol. Cell Neurosci. 2011;49:85–96. doi: 10.1016/j.mcn.2011.10.004. [DOI] [PMC free article] [PubMed] [Google Scholar]
- 79.Arnaud E, Zenker J, de Preux Charles AS, Stendel C, Roos A, Médard JJ, Tricaud N, Kleine H, Luscher B, Weis J, et al. SH3TC2/KIAA1985 protein is required for proper myelination and the integrity of the node of Ranvier in the peripheral nervous system. Proc. Natl Acad. Sci. USA. 2009;106:17528–17533. doi: 10.1073/pnas.0905523106. [DOI] [PMC free article] [PubMed] [Google Scholar]
- 80.Taveggia C, Feltri ML, Wrabetz L. Signals to promote myelin formation and repair. Nat. Rev. Neurol. 2010;6:276–287. doi: 10.1038/nrneurol.2010.37. [DOI] [PMC free article] [PubMed] [Google Scholar]
Associated Data
This section collects any data citations, data availability statements, or supplementary materials included in this article.