


Abstract
Single-molecule experiments on immobilized molecules allow unique insights into the dynamics of molecular machines and enzymes as well as their interactions. The immobilization, however, can invoke perturbation to the activity of biomolecules causing incongruities between single molecule and ensemble measurements. Here we introduce the recently developed DNA origami as a platform to transfer ensemble assays to the immobilized single molecule level without changing the nano-environment of the biomolecules. The idea is a stepwise transfer of common functional assays first to the surface of a DNA origami, which can be checked at the ensemble level, and then to the microscope glass slide for single-molecule inquiry using the DNA origami as a transfer platform. We studied the structural flexibility of a DNA Holliday junction and the TATA-binding protein (TBP)-induced bending of DNA both on freely diffusing molecules and attached to the origami structure by fluorescence resonance energy transfer. This resulted in highly congruent data sets demonstrating that the DNA origami does not influence the functionality of the biomolecule. Single-molecule data collected from surface-immobilized biomolecule-loaded DNA origami are in very good agreement with data from solution measurements supporting the fact that the DNA origami can be used as biocompatible surface in many fluorescence-based measurements.
INTRODUCTION
In recent years single-molecule experiments became a valuable tool to study dynamics of biomolecules on a molecular level (1,2). In particular Fluorescence (Förster)-Resonance-Energy-Transfer (FRET)-based approaches can resolve conformational changes in the range of few nanometres and with a time-resolution of microseconds to minutes (3–6). To resolve such conformational changes, biomolecules are commonly immobilized to the surface of a cover slip. The surface, however, represents a potential perturbation that has to be carefully taken into account in each single-molecule experiment (7,8). Laborious control experiments have to be carried out to show that single-molecule experiments adequately reflect the ensemble solution experiment and often doubts remain whether obtained distributions of properties describe the heterogeneity of the system or that of the surface immobilization. Immobilization strategies have been an issue since single-molecule FRET has been established to study biomolecular dynamics more than a decade ago. Typical immobilization schemes include BSA passivated cover slips which have successfully been used for nucleic acid dynamics, polyethyleneglycol passivated glass slides and vesicle encapsulation (8). The encapsulation in immobilized unilamellar vesicles provides an environment for systems that do not interact with the membrane but the exchange of reagents remains challenging (9). A trustworthy immobilization strategy is so important because biomolecular reactions are usually characterized first in ensemble measurements on freely diffusing molecules and a reproduction of similar reaction conditions on the single molecule level is required for direct comparison. Groll et al. (6) could clearly demonstrate that RNAseH refolding after denaturation is prevented when immobilized on a PEO (polyethylene oxide) brush. Another example of surface-induced artefacts has been published by Talaga et al. Here, the direct immobilization of a peptide led to reduced conformational fluctuations (10). The continuous effort to find an universal and reliable method of immobilization is furthermore reflected in the incessant appearance of publications that primarily deal with the immobilization strategy of single molecules (5–9,11–17).
Here, we present an immobilization scheme that allows matching of single-molecule and ensemble experiments (Figure 1). In contrast to previous approaches aiming at improving the biocompatibility of surfaces, we focus on the convergence of conditions in ensemble and single-molecule experiments. By immobilizing the biomolecules of interests on a DNA origami, ensemble and single-molecule experiments can be carried out without changing the nano-environment. The DNA origami fulfils two functions: it serves as bio-compatible surface and represents a transportable entity for the biomolecular assay to passage it between fluorescence methods. For the single-molecule measurements, the DNA origami serves as an adapter between a glass slide and the biomolecular assay (Figure 1B). Since DNA origami is a promising scaffold for manifold applications including molecular computing, molecular assembly lines or nanorobots the biocompatibility of the DNA nanostructure is of particular importance (18–23).
Figure 1.

Schematic drawing of the experimental strategy that allows a direct comparison of ensemble and single-molecule experiments as the DNA origami provides an identical nano-environment in all experiments. (A) DNA origami structures are based on a ‘scaffold’ DNA strand (the single-stranded DNA genome of bacteriophage M13), which can be folded into 2D and 3D assemblies at the nanometre scale with the help of hundreds of short oligonucleotides called ‘staple strands’ (24). DNA origami represent a self-assembled system; the formation of the DNA nanostructure is achieved by a simple heat denaturation step followed by slowly cooling down the scaffold DNA/staple strands mixture. Modifications (e.g. biotin, fluorophores) can be introduced into the DNA origami by replacing individual staple strands with a modified version of the oligonucleotide. (B) The decorated DNA origami represents a transportable pseudo-surface for a biomolecular reaction that can be used in a range of fluorescence-based methods. Importantly, the DNA origami ensures an identical nano-environment for the biomolecular assay (shown here is the fluorescently labelled double-stranded TATA–box containing oligonucleotide) leading to comparable reaction conditions. If biotins are positioned at one ‘face’ of a rectangular DNA origami (blue spheres) an oriented immobilization of the rectangle on a streptavidin-covered glass surface becomes possible. Consequently, the opposite side of the DNA rectangle that faces away from the surface is available for the DNA sequences that mediate the specific interaction for biomolecule immobilization, e.g. via protein–DNA interactions.
DNA origami structures are based on a ‘scaffold’ DNA strand (the single-stranded DNA genome of bacteriophage M13), which can be folded into 2D and 3D assemblies at the nanometre scale with the help of hundreds of short oligonucleotides called ‘staple strands’ (24). DNA origami represent a self-assembled system; the formation of the DNA nanostructure is achieved by a simple heat denaturation step followed by a slow cooling down of the scaffold DNA/staple strands mixture. Modifications (e.g. biotin) can be introduced into the DNA origami by replacing individual staple strands with a biotinylated version of the oligonucleotide. If biotins are positioned at one ‘face’ of a rectangular DNA origami an oriented immobilization of the rectangle on a streptavidin-covered glass surface becomes possible. Consequently, the opposite side of the DNA rectangle that faces away from the surface is available for the attachment of DNA sequences that mediate the specific interaction for biomolecule immobilization, e.g. via protein–DNA interactions. For this purpose, a single staple (‘anchor strand’) strand is extended by a sequence of interest that allows hybridization with complementary sequences to form a specific and functional DNA structure. The assembly of a DNA origami including modified staple strands, oligonucleotides complementary to the anchor staple strand and additional oligonucleotides required for the functional DNA entity follows the same convenient protocol of temperature-controlled self-assembly described.
We studied the interconversion of the two conformational states of the well-described Holliday junction (HJ) and the interaction of the transcription factor TBP (TATA-binding protein) with a TATA–box containing DNA either as isolated biomolecules or attached to a rectangular DNA origami platform. In both cases, a FRET signal served as readout to distinguish between the alternative HJ conformations and to follow the TBP-induced bending of the TATA–DNA (25). Both molecular processes are not affected by the presence of the DNA origami and are in very good agreement to datasets collected on freely diffusing molecules either in ensemble or in a single-molecule setup. Therefore, we demonstrate that the DNA origami provides an ideal biocompatible surface which (i) closes the gap between ensemble measurements and single-molecule studies on surfaces as the ensemble solution can be directly used to immobilize biomolecule-decorated origami on a cover slide and (ii) does not influence the biomolecule under investigation but creates a biocompatible environment ideally suited to monitor conformational changes without the risk of significant loss of activity or flexibility due to surface interactions.
MATERIALS AND METHODS
Buffers
All experiments were carried out at room temperature, unless indicated otherwise. DNA annealing buffer was 1× TAE (40 mM Tris/Acetate pH 8.3, 2.5 mM EDTA) with 12.5 mM MgCl2. HJ experiments were carried out in 1× PBS (8.06 mM Na2HPO4, 1.94 mM KH2PO4, 2.7 mM KCl and 137 mM NaCl, pH 7.4) with varying MgCl2 concentrations. TBP titrations as well as the TBP single-molecule experiments on surfaces were carried out in 50 mM Tris–HCl pH 7.5, 1 M NaCl and 12.5 mM MgCl2. Immobilization of the TATA–DNA oligonucleotides (10 pM) and TATA-origami (100 pM) was realized in 1× PBS, 12.5 mM MgCl2. In order to reduce blinking ON and OFF states of the fluorescent dyes 2 mM Trolox (dissolved in DMSO, 100 mM) was added in all experiments; oxygen was removed by the GOC (glucose oxidase catalase) oxygen scavenger system and 0.5% w/w glucose (26,27).
Preparation of TATA–double-stranded DNA, HJ and DNA origami
All DNA constructs were hybridized and folded in 1× TAE in the presence of 12.5 mM MgCl2 in an Eppendorf Thermocycler. All modified DNA sequences were purchased from IBA (Göttingen). The single-stranded DNA origami scaffold (genomic DNA of bacteriophage M13mp18) was prepared as described in Douglas et al. (28) but can also be purchased from New England Biolabs. The complete set of staple strands need for the rectangular DNA origami was ordered from MWG [a complete list of staple strand sequences required for the rectangular origami can be found in Rothemund et al. (24)].
The following DNA sequences were used for ‘origami-free’ measurements: TATA–double-stranded DNA (dsDNA) 5′-Biotin-CGG ACC GAA AGC GCG ACC ATC GCC GGA GA (Cy3B) TGG AGT AAA GTT TAA ATA CTG-3′ and 5′-ATTO647N-CAG TAT TTA AAC TTT ACT CCA ATC TCC GGC GAT GGT CGC GCT TTC GGT CCG-3′. Strands were hybridized at a final concentration of 25 µM for each strand. The HJ is composed of four strands called R, H, X and B (Figure 2A) with the following sequence: R: 5′-Biotin-CCC ACC GCT CGGC TCA ACT GGG-3′, H: 5′-Cy3-CCG TAG CAG CGCG AGC GGT GGG-3′, X: 5′-CCC AGT TGA GCG CTT GCT AGG G-3′, B: 5′-Cy5-CCC TAG CAA GCC GCT GCT AGG G-3′. The strands were annealed using a concentration ratio of 8.3 µM: 11.1 µM: 13.8 µM: 16.6 µM for R:H:X:B. Hybridization was carried out by a heating step (95°C for 30 s) and the sample was immediately cooled down to 20°C in 0.1°C steps every 6 s. A biotin modification at one of the HJ or TATA–oligonucleotide strands allowed a direct immobilization of the TATA–oligonucleotide or the HJ to a PEG–Biotin–Neutravidin glass surface as required for TIRF measurements.
Figure 2.

(A) The HJ is composed of four single-stranded DNAs (B, H, X, R) that can adopt two different conformations, iso I or iso II (B). The donor fluorophore Cy3 is attached to the 5′-end of strand H and the acceptor Cy5 is attached to the 5′ end of strand B. Here we determined the kinetic properties of the interconversion between the two conformational states using a FRET signal between Cy3 and Cy5 as readout. The iso I conformation leads to a low FRET whereas the iso II state causes a high FRET signal. The kinetics have been determined for freely diffusing molecules or for HJs anchored to a rectangular origami that additionally can be immobilized to a quartz slide (Neutravidin–Biotin linkage) via strand R (B). (C) Single-molecule ALEX measurements on freely diffusing HJ molecules that are labelled with a Cy3–Cy5 FRET pair. FRET efficiency distributions together with Gaussian fits to the data are shown for the HJ (top) or a HJ attached to the origami (bottom). Measurements were carried out in the presence (right) or absence (left) of 100 mM MgCl2. At low magnesium concentrations the fast interconversion between the conformational states iso I and iso II cannot be resolved resulting in an averaged FRET efficiency of E = 0.53. The interconversion rate is reduced in the presence of 100 mM MgCl2 and the low and high FRET states iso I and iso II can be detected (Eiso I = 0.36 and Eiso II = 0.74). An attachment of the HJ to the origami does not exert an influence on the conformational states of the HJ as judged by the distribution between iso I and iso II and the corresponding FRET efficiencies (Eiso I = 0.35 and Eiso II = 0.72).
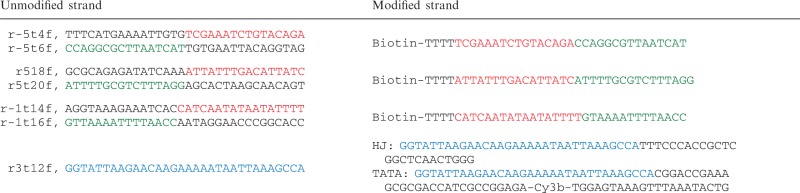
The rectangular DNA origami design from Rothemund’s original publication (24) was used for all experiments. Alternative DNA origami structures can be designed with the help of the freely available software ‘cadnano’ (http://cadnano.org) that also allows a visualization of the nanostructure. For folding of the DNA origami 3 nM single-stranded DNA (M13mp18), 30 nM unmodified staples and 300 nM labelled staples were used. In order to attach the TATA sequence or the HJ to the DNA origami the standard staple strand r3t12f [compare notation in (24)] has been replaced by an alternative version of the strand that has been extended either by one of the TATA–oligonucleotides (the 5′- to 3′-strand) or strand X of the HJ (Table 1). In this case, none of the TATA–oligonucleotides or the HJ strands were modified with biotin. In addition, two of the standard staple strands (e.g. r-5t4f and r-5t6f) were replaced by a single staple strand that carries a biotin-modification at the 5′-end. This has been done for three sets of standard staple strand pairs to introduce three biotins at one ‘face’ of the rectangular DNA origami in order to allow an oriented immobilization of the decorated DNA origami to a streptavidin-coated glass surface. The assembly of the modified DNA origami including biotinylated staple strands, the modified strand r3t12f and additional oligonucleotides for the formation of the TATA–oligonucleotide (5′-ATTO647N-CAG TAT TTA AAC TTT ACT CCA ATC TCC GGC GAT GGT CGC GCT TTC GGT CCG-3′) or the HJ (R: 5′–CCC ACC GCT CGGC TCA ACT GGG-3′, H: 5′-Cy3-CCG TAG CAG CGCG AGC GGT GGG-3′, B: 5′-Cy5-CCC TAG CAA GCC GCT GCT AGG G-3′) follows the same protocol of temperature-controlled self-assembly (95°C for 30 s and slow cooling down to 20°C in 0.1°C steps every 6 s). Additional oligonucleotides that form the double-stranded TATA–oligonucleotide or the HJ have been added directly to the DNA origami mix (at a concentration of 300 nM each) and were therefore part of the self-assembly process.
Table 1.
Modifications to the design are shown in the table below (Supplementary Figure S6)
 |
After folding the excess of staple strands was removed by filtration using Amicon Ultra-0.5 ml Centrifugal Filters (100 000 MWCO) according to manufacturer’s instructions. Choosing a filter with a cut-off of 100 000 MWCO ensures that the DNA origami (4.6 MDa) is retained whereas the staple strands (∼10 kDa) and non-attached but properly folded individual HJs (28 kDa) and double-stranded TATA–oligonucleotides (32 kDa) are passing through the filters pores and can be washed away. The DNA origami solution has been washed three times with 1× TAE buffer and concentrated to a final volume of 20 µl. Filtering has turned out to be an efficient way to remove the excess of biotinylated strands (29), HJs and TATA–oligonucleotides that are not attached to the surface of the DNA origami. The wash fractions have been analysed by single molecule TIRF microscopy checking the amount of fluorescently labelled molecules left in the flow-through that can be immobilized on a PEG-surface via the Biotin-anchor. After four rounds of washing no fluorescence signal could be detected ensuring that biotinylated strands were completely removed and there were no competing biotinylated staple strands in addition to the DNA origami left. The DNA origami can be stored at 20 nM in 1× TAE and 12.5 mM MgCl2 at 4°C for several days.
Preparation of TBP
TBP was expressed and purified as described earlier (30).
Ensemble fluorescence measurements
All fluorometer measurements were carried out on a temperature-controlled Cary Eclipse spectrometer in a fluorescence cuvette (50 µl volume, Hellma Germany). HJs oligo (10 nM) and HJ–origami (3 nM) experiments were executed at 25°C in 1× PBS with varying MgCl2 concentrations (Supplementary Figure S3). The TBP–TATA–DNA titration was performed at 55°C with a TATA–dsDNA oligo concentration of 10 nM as well as for the TATA–dsDNA on origami. Excitation was set to 515 nm and the emission was recorded at 660 nm (slit width: 20 nm, detector voltage: medium, integration time: 0.5 s). Data were evaluated using the program OriginPro. The relative fluorescence was plotted against the corresponding TBP concentration and the dissociation constant was calculated using a quadratic equation with the error given as standard error.
Surface preparation
Studies on immobilized molecules using a widefield setup were carried out on a PEG surface attached to a flow chamber for custom built PRISM-based TIRF microscope. Quartz slides were thoroughly cleaned and dried with nitrogen. The quartz slides were first silanized and afterwards PEGylized according to Roy et al. (31) followed by washing with 1× PBS and Neutravidin (1 mg/ml) incubation for 10 min.
Cover slides for solution measurements were rinsed with Acetone p.A., EtOH p.A. and deionized water. After a small chamber (Press-to-Seal 2.5 mm, Sigma Aldrich) had been glued to the cover slide, a solution of 5 mg/ml BSA in 1× PBS was incubated for 10 min. Excessive BSA was removed by washing with 1× PBS.
Widefield single-molecule detection and analysis
We used a homebuilt PRISM-TIRF setup based on an Olympus IX71 to perform widefield measurements. Fluorophores were excited with 532 nm (Coherent Sapphire, Clean-up filter 532/2 MaxLine Semrock, AHF Göttingen, circa 3 kW/cm2) diode laser. The fluorescence was collected by an 60× Olympus 1.20 N.A. water-immersion objective and split by wavelength with a dichroic mirror (640 DCXR, AHF) into two channels that were further narrowed by a bandpass filter Semrock BrightLine 582/75 in the green and a 633 nm RazorEdge longpass filter (Semrock, AHF) in the red detection range. Both detection channels were recorded by one EMCCD camera (Andor IXon 789DU, preGain 5.1, gain 1000, integration time 20 ms) in a dualview configuration and the videos were analysed by custom made software based on LabVIEW 2011 64 bit (National Instruments). The molecule spots were selected by an automated spotfinder and the resulting transients were filtered with the built in cubic filter of LabVIEW 2011. The fluorescent intensities were background corrected by subtracting the neighbour-pixels’ intensity. The transients were also corrected in leakage from the donor into the red detection channel and direct excitation of the acceptor by the 532-nm laser excitation. The HJ transition states were analysed with the HaMMy software freely available at the TJ Ha group’s homepage. Statistical errors are given as standard deviation.
Confocal measurements
The concentrations of fluorescently labelled molecules were adjusted to an average of less than one molecule per confocal volume in order to identify bursts from single molecules, i.e. in the picomolar range.
To study fluorescence and FRET on the level of single molecules, a custom built confocal microscope was used. The setup allowed alternating laser excitation of donor and acceptor fluorophores on diffusing molecules with separate donor and acceptor detection. Fluorophores were excited with continuous wave at 532 nm (TECGL-30, World Star Tech; 80 µW for Cy3, 60 µW for Cy3B) and with 80 MHz pulsed at 640 nm (LDH-D-C-640, Picoquant, 60 µW for Cy5, 30 µW for ATTO647N). Alternation of both wavelengths with 100 -µs period was achieved by use of an acousto-optical tunable filter (AOTFnc-VIS, AA optoelectronic). The laser beam entered an inverse microscope and was coupled into an oil-immersion objective (TBP: 60X, NA 1.35, UPLSAPO 60XO; HJ: 60X, NA 1.49, APON 60XO TIRFM, both Olympus) by a dual-band dichroic beam splitter (Dualband z532/633, AHF). The resulting fluorescence was collected by the same objective, focused onto a 50 µm pinhole, and split spectrally at 640 nm by a dichroic beam splitter (640DCXR, AHF). Two avalanche photodiodes (τ-SPAD-100, Picoquant) detected the donor and acceptor fluorescence with appropriate spectral filtering (Brightline HC582/75, Bandpass ET 700/75 m, AHF). The detector signal was registered using a PC card for single-photon counting (SPC-830, Becker&Hickl) and evaluated using custom made LabVIEW (National Instruments) software.
Data evaluation for ALEX measurements
In solution measurements, fluorescence bursts from single molecules diffusing through the laser focus are identified by a burst search algorithm applied to the sum of donor and acceptor photons (parameters used for free HJ: T = 500 µs, M = 30, L = 60, for TBP oligo: T = 500 µs, M = 30, L = 50, for origami: T = 500 µs, M = 30, L = 100) (32). Molecules are alternately excited and the fluorescence of donor and acceptor is separately detected. This defines three different photon counts: donor emission due to donor excitation , acceptor emission due to acceptor excitation
  and acceptor emission due to donor excitation
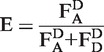
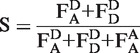
  . Upon correction of these values from background signals, the stoichiometry parameter S and the proximity ratio E are defined, where S describes the ratio between donor and acceptor dyes of the sample and E stands for the proximity ratio between the dyes in terms of energy-transfer efficiency (33). Statistical errors are given as standard deviation.
 |
 |
RESULTS AND DISCUSSION
DNA origami has emerged as a new way to build nanoarchitectures that combine the advantage of self-assembly with free addressability of the structure to add functionality (19,34). DNA origami are 3D folded DNA structures, highly ordered on the nanoscale that allow the site-directed tethering of DNA strands on its surface (24). DNA-nanostructures have been suggested to be a valuable tool for a multitude of future applications and initial work included (i) origami as scaffold for dye-based photonic wires (35), (ii) DNA nanostructures as host for macromolecular molecules e.g. proteins (36) and G-quadruplexes (37) and (iii) DNA origami as a molecular breadboard that allows the precise positioning of e.g. fluorescently labelled oligonucleotides (38) or nanotubes (39). Here, we add an alternative application to the DNA origami toolbox presenting origami as a bio-compatible surface that can match ensemble and single-molecule measurements.
In order to evaluate whether DNA origami can serve as a transfer platform we chose two biological relevant reporter systems, the DNA HJ and the TBP-induced bending of DNA. For both model systems the conformational flexibility of the DNA component(s) engineered to the origami surface is mandatory for functionality and can be monitored via the change of a FRET signal. Thereby, employing ensemble and single-molecule fluorescence spectroscopy, we were able to assess in detail whether a biological assay can be established on an origami surface that can be directly used in both types of fluorescence measurements (Figure 1).
Holliday junction
The HJ is a mobile DNA junction composed of four individual DNA strands (Figure 2A). In presence of bivalent metal ions (here Mg2+) the HJ switches between two conformational states iso I and iso II (Figure 2B). These states can be detected and distinguished when the FRET-efficiency of a Cy3–Cy5 donor-acceptor pair attached to strands H and B (Figure 2A) is monitored. The iso I state causes a low FRET signal whereas in the iso II state the fluorophores are in close proximity resulting in a high FRET signal. Bulk fluorescence measurements average the dynamic behaviour and the resulting FRET efficiency is independent of the MgCl2 concentration (Supplementary Figures S2 and S3). In contrast, at the single-molecule level the fast switching between conformational states can be resolved. The fluorescence of freely diffusing HJ molecules can be monitored in a confocal fluorescence microscope equipped with alternating laser excitation (ALEX). Because of the fast transition rates at low magnesium concentrations the FRET efficiency of the two states cannot be resolved and leads to an averaged E-value of ∼0.5 (Figure 2C). In contrast, at higher magnesium concentrations of 100 mM the transition rate slows down so that the single molecule under investigation stays in either of the states while it is diffusing through the focus, resulting in two FRET populations with defined mean FRET efficiency values of Eiso I = 0.36 (±0.10) and Eiso II = 0.74 (±0.08) (Figure 2C). The kinetics can be monitored in real-time in a widefield setup with total internal reflection (TIR, Figure 3). Transition rates are calculated with the help of two-state hidden Markov modelling (40). Increasing the magnesium concentration from 40 to 400 mM leads to a 2.5-fold reduced transition rate from 4 transitions/s to 1.5 transitions/s (Figure 3C). These data are in very good agreement with previously reported results (41,42). As judged from the FRET efficiency distributions and calculated transition rates, the kinetics of the transition and the spatial arrangement of HJ arms are not affected if the mobile HJ is attached to the origami. These results suggest that the HJ is able to freely undergo conformational switching without any effect of the DNA-nanostructure. An additional benefit of the origami pseudo-surface is the slower diffusion of the high-molecular weight origami (∼4.6 MDa) accompanied by an unusual form factor in solution that leads to a higher photon count per burst. It also increases the potential to study biomolecular dynamics in the lower millisecond timescale on diffusing molecules. Based on the Stokes–Einstein equation the difference in the diffusion constant can be calculated in relation to the molecular weight of molecules. The molecular weight of the DNA origami is 4600 times higher as compared to a fluorescence dye (∼1 kDa). Since the cube of the diffusion constant scales approximately with the inverse of the molar mass the diffusion co-efficient should be of the order of 17-fold smaller than that of the single dye. For the TATA oligo (51 bp) we expect decrease of the diffusion constant by ∼5-fold. Experimentally, we found a decrease of the diffusion constant by a factor of 4 by burst length analysis.
Figure 3.

(A) Pseudo coloured wide-field image of HJ–origami immobilized on a PEG surface with 200 mM MgCl2 added to the buffer, excited with 532-nm laser light (scale bar = 10 µm). Green spots indicate donor (Cy3) only HJs, orange spots reveal FRET to the acceptor Cy5. (B) Fluorescence time transient of the circled HJ in (A) (upper trace). The Cy3 and Cy5 intensities show anti-correlated behaviour until the acceptor bleaches (at 9 s). The FRET efficiency changes rapidly between 0.2 (iso I) and 0.7 (iso II) (lower trace). Based on a two-state Hidden Markov Model (HMM) these changes are recognized and counted. Only FRET efficiencies between 0.15 and 0.8 are taken into account to rule out dye bleaching or dark states. (C) Transition rates in dependence of the magnesium concentration. All curves show decreasing rate values at higher Magnesium concentrations.
TBP induced bending of TATA–box DNA
The TBP is one of the general transcription initiation factors found in Archaea and Eukaryotes (43). Recognition of the TATA–box motif upstream of the transcription start site by TBP allows the assembly of the transcription initiation complex at the promoter. Binding of TBP to the minor groove of the DNA is driven by hydrophobic interactions and leads to a significant bending of the DNA helix (Figure 4B) (44). We monitored the TBP-induced bending of DNA via a FRET signal between a donor (Cy3B) and acceptor (Atto647N) fluorophore attached to either end of a TATA–box containing dsDNA in free solution or attached to the origami surface (Figure 4A). The addition of TBP led to an increase in FRET, and fitting of the data yielded a dissociation constant of 21.5 (±1.1) nM (Figure 4C). The affinity between TBP and the TATA–box oligonucleotide attached to the origami is identical within experimental errors (Kd = 21.7 ± 2.0 nM). The congruent affinities indicate that the four identical (and after assembly of the DNA origami double stranded) TATA–box sequence motifs (5′-TTTAAA-3′) found in the M13mp18 scaffold are not accessible for TBP. Otherwise these motifs would act as competing TBP-binding sites and the Kd would clearly deviate from the measurements with the isolated TATA–oligonucleotide. To further investigate this we carried out a competition experiment between a pre-formed labelled TATA–oligonucleotide/TBP complex at half-saturation (50 nM TBP) and the DNA origami (Supplementary Figure S7). Addition of the origami did not result in any significant change in FRET efficiency providing clear evidence that the TATA–box motifs in the DNA origami are not available for TBP. Mei et al. showed that DNA origami are even stable in cell lysate making it suitable or for in vivo applications (45). It is noteworthy that these measurements were carried out at elevated temperatures (55°C) because the TBP protein used in this study originates from a hyperthermophilic organism (Methanocaldococcus jannaschii). Stability tests showed that the origami structure is stable and does not unfold when exposed to temperatures up to 55°C for at least up to 20 min (Supplementary Figure S1). Hence, the origami can additionally serve as firm platform to study biomolecular reactions that require more extreme conditions. These data demonstrate that (i) the attached DNA is freely available for the TBP interaction and (ii) the TBP–TATA–box interaction occurs specifically between the exposed dsDNA that encodes the TATA–box but not between similar sequence motifs found in the M13 DNA sequence that builds up the origami structure. At the single-molecule level the TBP-induced increase in FRET was monitored employing either TIRF spectroscopy (immobilized molecules) or confocal fluorescence microscopy (freely diffusing molecules). In the absence of TBP a well-defined population at low FRET values (E = 0.28 ± 0.07) can be measured for the TATA–oligo (Figure 4C). The attachment of the TATA–DNA to the origami did not affect the FRET value (E = 0.29 ± 0.07). The addition of TBP leads to an increase in FRET efficiency as seen in ensemble measurements. Again, the presence of the origami does not interfere with the TBP–TATA–DNA interaction as the mean FRET values of the bent DNA are almost identical (TATA–DNA: E = 0.47 ± 0.10, TATA–DNA/origami: E = 0.51 ± 0.08). Immobilization of the TATA–oligo decorated origami on a quartz slide makes it possible to study the TBP–TATA interaction with a time-resolution in the millisecond range (Figure 5). Hence, the association and dissociation of a nucleic acid-binding protein like TBP can be monitored in real-time adding another level of information, namely kinetic parameters like complex lifetime and transition rates that cannot be obtained from ensemble measurements.
Figure 4.

(A) TATA–oligonucleotide used in this study showing the position of the donor fluorophore Cy3B and the acceptor Atto647N. The TATA–box sequence is highlighted (cyan box). Coupling of a biotin at the 5′-end of the upper strand allows direct immobilization of the TATA–oligo on a cover slide. For the attachment of the TATA–DNA to the origami surface the upper strand has been extended by the staple strand sequence (see ‘Materials and Methods’ section). (B) Addition of the TBP to the TATA–oligonucleotide induces a bending of the DNA. Bending of the DNA brings the fluorophores in close proximity which results in an increased FRET efficiency. (C) Ensemble fluorescence titration of 25 nM free TATA–oligonucleotide (filled circles) or 10 nM of origami-attached TATA–oligonucleotide (filled rectangle) was titrated with TBP while the FRET signal was observed (excitation at 515 nm, emission at 660 nm). The curve shows the best fit of the data to a quadratic equation yielding a dissociation constant (Kd) of 21.5 ± 1.1 (free oligonucleotide) and 21.7 ± 2.0 (oligo on DNA origami). The titration was carried out at 55°C. (D) Single molecule ALEX measurements on freely diffusing molecules using the Cy3B–Atto647N labelled TATA–DNA (top) or the labelled TATA–DNA attached to the origami (bottom). Measurements were carried out in the presence (right) or absence (left) of TBP. Upon addition of TBP the dsDNA bends and the donor and acceptor fluorophores get in close proximity. Consequently, in addition to the low FRET population of the straight dsDNA (Eoligo = 0.29, Eorigami = 0.29) a high FRET population (Eoligo = 0.47 and Eorigami = 0.51) can be detected in the presence of TBP (right). The emergence of the high FRET population is independent on whether or not the TATA–oligo is attached to the origami. Measurements were carried out at 25°C.
Figure 5.

(A) A transient of an immobilized origami-bound TATA–oligo visualizes the rapid binding and unbinding of TBP to the TATA–box (at 35°C, 1 µM TBP). At 40 s the acceptor ATTO647N bleaches and the donor fluorophore Cy3B shows increased fluorescence. (B) The TBP-induced bending is shown in high-time resolution of 20 ms/frame (Seconds 2–5 of panel A). (C and D). FRET efficiency over time is changing between 0.19 (low FRET of straight DNA) and 0.47 (TBP induced high FRET due to DNA bending).
Taken together, we introduced the recently developed DNA origami as a biocompatible platform that paves the way for a reliable and direct transfer of a fluorescence-based experiment from the ensemble to the single-molecule level. Making use of the DNA origami platform, the conditions for a biomolecular reaction can be optimized first on the ensemble level and subsequently the very same experiment can be transferred to the single-molecule level. Here, the DNA origami provides an identical nano-environment that ensures highly congruent reaction conditions, which consequently leads to comparable results and adds all the benefits of the single-molecule technique.
For optimal comparability of single-molecule and ensemble data we suggest the following procedure that can be applied to a wide range of studies on biomolecular mechanisms: (i) the functionality of the biomolecules is proven in an ensemble fluorescence assay using a cuvette and a spectrometer; (ii) the same assay is carried out with the biomolecules attached to the DNA origami and any effect of the origami can directly be detected. In case the reaction is affected by the DNA origami pseudo-surface the biocompatibility can be further improved e.g. by using pegylated oligonucleotides to convert the DNA origami into a PEG surface that can still be used to match single-molecule and ensemble measurements; and (iii) a transfer of the assay to the single-molecule setup is now possible as the DNA origami platform can be immobilized on the cover slide via its biotin-moieties. Following this scheme the researcher has a high confidence that surface induced artefacts can be excluded. The DNA origami approach is of special interest for studies that require immobilized nucleic acids as these can be easily introduced into the self-assembled DNA origami and error-prone immobilization reactions are avoided. Therefore, biomolecular reactions placed on the DNA origami surface can be easily studied on the single-molecule level and a deeper understanding of the system can be achieved as structurally different complexes can be identified and time-resolved data are obtained without the need to synchronize molecules. The DNA origami immobilization scheme is of interest for studies that are compatible with immobilized nucleic acids or immobilized proteins via linkers or tags. It is especially simple when the immobilization is straightforward such as for (i) nucleic acids that can adopt multiple structures dependent on co-factor, ligand or metal binding (e.g. Q-quadruplexes, ribozymes, complex RNA structures, DNA walkers) and (ii) protein–nucleic acids interactions (e.g. aptamer–ligand interaction, molecular motors acting on nucleic acids, transcription factors). We therefore suggest the origami-platform to bridge the often encountered gap between ensemble and single-molecule methods.
Finally, the demonstration of biocompatibility and unchanged kinetics in solution and on the DNA origami is fundamental for the design of new DNA origami applications that imply biomolecular dynamics including molecular computing, aritifical molecular machines, molecular assembly lines and nanorobots (23,46,47).
SUPPLEMENTARY DATA
Supplementary Data are available at NAR Online: Supplementary Figures 1–7.
FUNDING
ERC starting grant (SiMBA), and a grant from the DFG [TI329/5-1]. Funding for open access charge: ERC starting grant [ERC-2010-StG-20091118].
Conflict of interest statement. None declared.
Supplementary Material
ACKNOWLEDGEMENTS
The authors like to thank Emmanuel Margeat for his advice and help in constructing a PRISM TIRF microscope as well as Ingo H. Stein for his support with respect to confocal solution measurements.
REFERENCES
- 1.Myong S, Stevens BC, Ha T. Bridging conformational dynamics and function using single-molecule spectroscopy. Structure. 2006;14:633–643. doi: 10.1016/j.str.2006.02.005. [DOI] [PubMed] [Google Scholar]
- 2.Tinnefeld P, Sauer M. Branching out of single-molecule fluorescence spectroscopy: challenges for chemistry and influence on biology. Angew. Chem. Int. Ed. Engl. 2005;44:2642–2671. doi: 10.1002/anie.200300647. [DOI] [PubMed] [Google Scholar]
- 3.Kim HD, Nienhaus GU, Ha T, Orr JW, Williamson JR, Chu S. Mg2+-dependent conformational change of RNA studied by fluorescence correlation and FRET on immobilized single molecules. Proc. Natl Acad. Sci. USA. 2002;99:4284–4289. doi: 10.1073/pnas.032077799. [DOI] [PMC free article] [PubMed] [Google Scholar]
- 4.Schwille P, Haupts U, Maiti S, Webb WW. Molecular dynamics in living cells observed by fluorescence correlation spectroscopy with one- and two-photon excitation. Biophys. J. 1999;77:2251–2265. doi: 10.1016/S0006-3495(99)77065-7. [DOI] [PMC free article] [PubMed] [Google Scholar]
- 5.Amirgoulova EV, Groll J, Heyes CD, Ameringer T, Rocker C, Moller M, Nienhaus GU. Biofunctionalized polymer surfaces exhibiting minimal interaction towards immobilized proteins. Chemphyschem. 2004;5:552–555. doi: 10.1002/cphc.200400024. [DOI] [PubMed] [Google Scholar]
- 6.Groll J, Amirgoulova EV, Ameringer T, Heyes CD, Rocker C, Nienhaus GU, Moller M. Biofunctionalized, ultrathin coatings of cross-linked star-shaped poly(ethylene oxide) allow reversible folding of immobilized proteins. J. Am. Chem. Soc. 2004;126:4234–4239. doi: 10.1021/ja0318028. [DOI] [PubMed] [Google Scholar]
- 7.Okumus B, Wilson TJ, Lilley DM, Ha T. Vesicle encapsulation studies reveal that single molecule ribozyme heterogeneities are intrinsic. Biophys. J. 2004;87:2798–2806. doi: 10.1529/biophysj.104.045971. [DOI] [PMC free article] [PubMed] [Google Scholar]
- 8.Rasnik I, McKinney SA, Ha T. Surfaces and orientations: much to FRET about? Acc. Chem. Res. 2005;38:542–548. doi: 10.1021/ar040138c. [DOI] [PubMed] [Google Scholar]
- 9.Okumus B, Arslan S, Fengler SM, Myong S, Ha T. Single molecule nanocontainers made porous using a bacterial toxin. J. Am. Chem. Soc. 2009;131:14844–14849. doi: 10.1021/ja9042356. [DOI] [PMC free article] [PubMed] [Google Scholar]
- 10.Talaga DS, Lau WL, Roder H, Tang J, Jia Y, DeGrado WF, Hochstrasser RM. Dynamics and folding of single two-stranded coiled-coil peptides studied by fluorescent energy transfer confocal microscopy. Proc. Natl Acad. Sci. USA. 2000;97:13021–13026. doi: 10.1073/pnas.97.24.13021. [DOI] [PMC free article] [PubMed] [Google Scholar]
- 11.Cisse I, Okumus B, Joo C, Ha T. Fueling protein DNA interactions inside porous nanocontainers. Proc. Natl Acad. Sci. USA. 2007;104:12646–12650. doi: 10.1073/pnas.0610673104. [DOI] [PMC free article] [PubMed] [Google Scholar]
- 12.Dickson RM, Norris DJ, Tzeng YL, Moerner WE. Three-dimensional imaging of single molecules solvated in pores of poly(acrylamide) gels. Science. 1996;274:966–969. doi: 10.1126/science.274.5289.966. [DOI] [PubMed] [Google Scholar]
- 13.Ishitsuka Y, Okumus B, Arslan S, Chen KH, Ha T. Temperature-independent porous nanocontainers for single-molecule fluorescence studies. Anal. Chem. 2010;82:9694–9701. doi: 10.1021/ac101714u. [DOI] [PMC free article] [PubMed] [Google Scholar]
- 14.Koopmans WJ, Schmidt T, van Noort J. Nucleosome immobilization strategies for single-pair FRET microscopy. Chemphyschem. 2008;9:2002–2009. doi: 10.1002/cphc.200800370. [DOI] [PubMed] [Google Scholar]
- 15.Kufer SK, Dietz H, Albrecht C, Blank K, Kardinal A, Rief M, Gaub HE. Covalent immobilization of recombinant fusion proteins with hAGT for single molecule force spectroscopy. Eur Biophys. J. 2005;35:72–78. doi: 10.1007/s00249-005-0010-1. [DOI] [PubMed] [Google Scholar]
- 16.Lee JY, Okumus B, Kim DS, Ha T. Extreme conformational diversity in human telomeric DNA. Proc. Natl Acad. Sci. USA. 2005;102:18938–18943. doi: 10.1073/pnas.0506144102. [DOI] [PMC free article] [PubMed] [Google Scholar]
- 17.Wennmalm S, Edman L, Rigler R. Conformational fluctuations in single DNA molecules. Proc. Natl Acad. Sci. USA. 1997;94:10641–10646. doi: 10.1073/pnas.94.20.10641. [DOI] [PMC free article] [PubMed] [Google Scholar]
- 18.Seeman NC. Nanomaterials based on DNA. Annu. Rev. Biochem. 2010;79:65–87. doi: 10.1146/annurev-biochem-060308-102244. [DOI] [PMC free article] [PubMed] [Google Scholar]
- 19.Torring T, Voigt NV, Nangreave J, Yan H, Gothelf KV. DNA origami: a quantum leap for self-assembly of complex structures. Chem. Soc. Rev. 2011;40:5636–5646. doi: 10.1039/c1cs15057j. [DOI] [PMC free article] [PubMed] [Google Scholar]
- 20.Pinheiro AV, Han D, Shih WM, Yan H. Challenges and opportunities for structural DNA nanotechnology. Nat. Nanotechnol. 2011;6:763–772. doi: 10.1038/nnano.2011.187. [DOI] [PMC free article] [PubMed] [Google Scholar]
- 21.Rajendran A, Endo M, Sugiyama H. Single-molecule analysis using DNA origami. Angew. Chem. Int. Ed. Engl. 2012;51:874–890. doi: 10.1002/anie.201102113. [DOI] [PubMed] [Google Scholar]
- 22.Jungmann R, Scheible M, Kuzyk A, Pardatscher G, Castro CE, Simmel FC. DNA origami-based nanoribbons: assembly, length distribution, and twist. Nanotechnology. 2011;22:275301. doi: 10.1088/0957-4484/22/27/275301. [DOI] [PubMed] [Google Scholar]
- 23.Simmel FC. DNA-based assembly lines and nanofactories. Curr. Opin. Biotechnol. 2012 doi: 10.1016/j.copbio.2011.12.024. In press. [DOI] [PubMed] [Google Scholar]
- 24.Rothemund PW. Folding DNA to create nanoscale shapes and patterns. Nature. 2006;440:297–302. doi: 10.1038/nature04586. [DOI] [PubMed] [Google Scholar]
- 25.Grohmann D, Klose D, Fielden D, Werner F. FRET (fluorescence resonance energy transfer) sheds light on transcription. Biochem. Soc. Trans. 2011;39:122–127. doi: 10.1042/BST0390122. [DOI] [PubMed] [Google Scholar]
- 26.Cordes T, Vogelsang J, Tinnefeld P. On the mechanism of Trolox as antiblinking and antibleaching reagent. J. Am. Chem. Soc. 2009;131:5018–5019. doi: 10.1021/ja809117z. [DOI] [PubMed] [Google Scholar]
- 27.Rasnik I, McKinney SA, Ha T. Nonblinking and long-lasting single-molecule fluorescence imaging. Nat. Methods. 2006;3:891–893. doi: 10.1038/nmeth934. [DOI] [PubMed] [Google Scholar]
- 28.Douglas SM, Dietz H, Liedl T, Hogberg B, Graf F, Shih WM. Self-assembly of DNA into nanoscale three-dimensional shapes. Nature. 2009;459:414–418. doi: 10.1038/nature08016. [DOI] [PMC free article] [PubMed] [Google Scholar]
- 29.Steinhauer C, Jungmann R, Sobey TL, Simmel FC, Tinnefeld P. DNA origami as a nanoscopic ruler for super-resolution microscopy. Angew. Chem. Int. Ed. Engl. 2009;48:8870–8873. doi: 10.1002/anie.200903308. [DOI] [PubMed] [Google Scholar]
- 30.Werner F, Weinzierl RO. A recombinant RNA polymerase II-like enzyme capable of promoter-specific transcription. Mol. Cell. 2002;10:635–646. doi: 10.1016/s1097-2765(02)00629-9. [DOI] [PubMed] [Google Scholar]
- 31.Roy R, Hohng S, Ha T. A practical guide to single-molecule FRET. Nat. Methods. 2008;5:507–516. doi: 10.1038/nmeth.1208. [DOI] [PMC free article] [PubMed] [Google Scholar]
- 32.Nir E, Michalet X, Hamadani KM, Laurence TA, Neuhauser D, Kovchegov Y, Weiss S. Shot-noise limited single-molecule FRET histograms: comparison between theory and experiments. J. Phys. Chem. B. 2006;110:22103–22124. doi: 10.1021/jp063483n. [DOI] [PMC free article] [PubMed] [Google Scholar]
- 33.Kapanidis AN, Lee NK, Laurence TA, Doose S, Margeat E, Weiss S. Fluorescence-aided molecule sorting: analysis of structure and interactions by alternating-laser excitation of single molecules. Proc. Natl Acad. Sci. USA. 2004;101:8936–8941. doi: 10.1073/pnas.0401690101. [DOI] [PMC free article] [PubMed] [Google Scholar]
- 34.Pinheiro AV, Han D, Shih WM, Yan H. Challenges and opportunities for structural DNA nanotechnology. Nat. Nanotechnol. 2011;6:763–772. doi: 10.1038/nnano.2011.187. [DOI] [PMC free article] [PubMed] [Google Scholar]
- 35.Stein IH, Steinhauer C, Tinnefeld P. Single-molecule four-color FRET visualizes energy-transfer paths on DNA origami. J. Am. Chem. Soc. 2011;133:4193–4195. doi: 10.1021/ja1105464. [DOI] [PubMed] [Google Scholar]
- 36.Berardi MJ, Shih WM, Harrison SC, Chou JJ. Mitochondrial uncoupling protein 2 structure determined by NMR molecular fragment searching. Nature. 2011;476:109–113. doi: 10.1038/nature10257. [DOI] [PMC free article] [PubMed] [Google Scholar]
- 37.Sannohe Y, Endo M, Katsuda Y, Hidaka K, Sugiyama H. Visualization of dynamic conformational switching of the G-quadruplex in a DNA nanostructure. J. Am. Chem. Soc. 2010;132:16311–16313. doi: 10.1021/ja1058907. [DOI] [PubMed] [Google Scholar]
- 38.Vogelsang J, Steinhauer C, Forthmann C, Stein IH, Person-Skegro B, Cordes T, Tinnefeld P. Make them blink: probes for super-resolution microscopy. Chemphyschem. 2010;11:2475–2490. doi: 10.1002/cphc.201000189. [DOI] [PubMed] [Google Scholar]
- 39.Maune HT, Han SP, Barish RD, Bockrath M, Iii WA, Rothemund PW, Winfree E. Self-assembly of carbon nanotubes into two-dimensional geometries using DNA origami templates. Nat Nanotechnol. 2010;5:61–66. doi: 10.1038/nnano.2009.311. [DOI] [PubMed] [Google Scholar]
- 40.McKinney SA, Joo C, Ha T. Analysis of single-molecule FRET trajectories using hidden Markov modeling. Biophys. J. 2006;91:1941–1951. doi: 10.1529/biophysj.106.082487. [DOI] [PMC free article] [PubMed] [Google Scholar]
- 41.Joo C, McKinney SA, Lilley DM, Ha T. Exploring rare conformational species and ionic effects in DNA Holliday junctions using single-molecule spectroscopy. J. Mol. Biol. 2004;341:739–751. doi: 10.1016/j.jmb.2004.06.024. [DOI] [PubMed] [Google Scholar]
- 42.McKinney SA, Declais AC, Lilley DM, Ha T. Structural dynamics of individual Holliday junctions. Nat. Struct. Biol. 2003;10:93–97. doi: 10.1038/nsb883. [DOI] [PubMed] [Google Scholar]
- 43.Werner F, Grohmann D. Evolution of multisubunit RNA polymerases in the three domains of life. Nat. Rev. Microbiol. 2011;9:85–98. doi: 10.1038/nrmicro2507. [DOI] [PubMed] [Google Scholar]
- 44.Masters KM, Parkhurst KM, Daugherty MA, Parkhurst LJ. Native human TATA-binding protein simultaneously binds and bends promoter DNA without a slow isomerization step or TFIIB requirement. J. Biol. Chem. 2003;278:31685–31690. doi: 10.1074/jbc.M305201200. [DOI] [PubMed] [Google Scholar]
- 45.Mei Q, Wei X, Su F, Liu Y, Youngbull C, Johnson R, Lindsay S, Yan H, Meldrum D. Stability of DNA origami nanoarrays in cell lysate. Nano Lett. 2011;11:1477–1482. doi: 10.1021/nl1040836. [DOI] [PMC free article] [PubMed] [Google Scholar]
- 46.Gu H, Chao J, Xiao S-J, Seeman NC. A proximity-based programmable DNA nanoscale assembly line. Nature. 2010;465:202–205. doi: 10.1038/nature09026. [DOI] [PMC free article] [PubMed] [Google Scholar]
- 47.Jungmann R, Steinhauer C, Scheible M, Kuzyk A, Tinnefeld P, Simmel FC. Single-molecule kinetics and super-resolution microscopy by fluorescence imaging of transient binding on DNA origami. Nano Lett. 2010;10:4756–4761. doi: 10.1021/nl103427w. [DOI] [PubMed] [Google Scholar]
Associated Data
This section collects any data citations, data availability statements, or supplementary materials included in this article.