Abstract
Neuronal membrane phospholipids are highly affected by oxidative stress caused by ischemic injury. Thus, it is necessary to identify key lipid components that show changes during ischemia to develop an effective approach to prevent brain damage from ischemic injury. The recent development of MALDI imaging MS (MALDI IMS) makes it possible to identify phospholipids that change between damaged and normal regions directly from tissues. In this study, we conducted IMS on rat brains damaged by ischemic injury and detected various phospholipids that showed unique distributions between normal and damaged areas of the brain. Among them, we confirmed changes in phospholipids such as lysophosphatidylcholine, phosphatidylcholine, phosphatidylethanolamine, and sphingomyelin by MALDI IMS followed by MS/MS analysis. These lipids were present in high concentrations in the brain and are important for maintenance of cellular structure as well as production of second messengers for cellular signal transduction. Our results emphasize the identification of phospholipid markers for ischemic injury and successfully identified several distinctly located phospholipids in ischemic brain tissue.
Keywords: brain imaging, matrix-assisted laser desorption/ionization, mass spectrometry
Lipids, particularly phospholipids, are important for cellular function due to their location in the cell and their involvement in numerous signaling pathways. Brain tissue contains the second highest concentration of phospholipids (20–25%) after adipose tissue (1, 2). Because of their diverse and complex chemical structures, less attention has been given to cellular phospholipid analyses compared with protein or peptide analyses. However, recent progress in mass spectrometric analysis has enabled the identification of small cellular components including phospholipids and quantification of their cellular expression profiles (3, 4).
ESI MS is widely used for phospholipid analysis. Currently, MALDI imaging MS (MALDI IMS) has become the prime choice because it provides additional advantages over ESI, including simple sample preparation and an abundance of information about molecular structures and spatial data (3, 5–9). The principal advantage of MALDI IMS is its ability to ionize molecules directly from the surface of tissue samples, which can demonstrate the spatial distribution of molecules of interest. However, MALDI IMS must be further improved to resolve technical problems such as the ambiguity of structural determination, unequal ionization efficiencies of different compounds, and complications due to uneven tissue structure. Glycerophospholipids can be classified according to their head groups, linkage between the polar chain and glycerol backbone, and variability in their FA composition (9). Depending on the presence of amine or hydroxyl structures on their head group, phospholipids can be ionized in either positive or negative mode. The ionization efficiency of lipids can also be affected by their head group structure. Occasionally, it is difficult to perform MALDI IMS analysis twice in both positive and negative ionization modes on the same tissue sample to identify lipid composition due to complex tissue structure and matrix stability of the tissue under a high vacuum system. However, the binary matrix used in this study may overcome such problems (10).
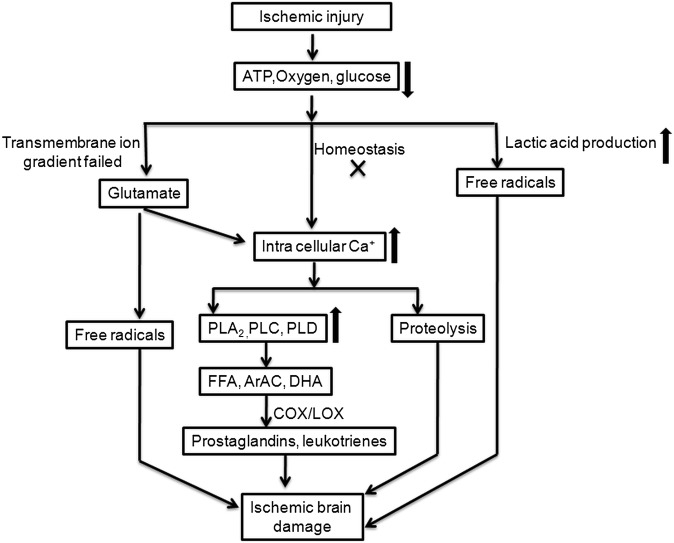
Cerebral ischemia is a condition in which there is insufficient blood flow to the brain, resulting in brain tissue death (11, 12). Depending on its severity and location, there are several categories of ischemic injury, including diffuse cerebral hypoxia, focal cerebral ischemia, massive cerebral infarction, global cerebral ischemia, and transient ischemic attack. The current study focused on focal cerebral ischemia. This is a condition in which acute or transient stroke occurs in a particular area due to low oxygen supply, and represents >80% of human stroke cases. Studies have shown that ischemic injury characterized by low oxygen and glucose supply obstructs ATP production and induces transmembrane gradient failure, which causes depolarization of ions and release of glutamate (13). These effects increase intracellular Ca2+ concentration, resulting in activation of phospholipases. Increased activities of various phospholipases induce changes in membrane phospholipid composition and initiate the production of second messengers, including arachidonic acid, docosahexaenoic acid, FFAs, and free radicals, resulting in cell death or apoptosis (Fig. 1).
Fig. 1.
Changes in cellular signaling process during ischemic injury.
In this study, focal cerebral ischemic rat brain tissue was analyzed by MALDI IMS, using the binary matrix recently developed by our laboratory (10). MALDI IMS analysis identified 11 upregulated phospholipids, including lysophosphatidylcholine (LPC), phosphatidylcholine (PC), and sodiated forms of sphingomyelin (SM) and PCs in ischemic-damaged regions. In contrast, seven other phospholipids, including potassiated forms of PCs, SM, and LPC were downregulated in the ischemic-damaged region, compared with those in the normal region. Thus, these results suggest that ischemic injury induces changes in PC and SM distribution and the Na+/K+ ion gradient.
MATERIALS AND METHODS
Preparation of the matrix solution
The binary matrix was prepared using a mixture of 2,5-dihydroxybenzoic acid (DHB) and α-cyano-4-hydroxycinnamic acid (CHCA) (7 mg/ml each). Trifluoroacetic acid (0.1% TFA) and 1% piperidine were added as ion-pairing agents (10, 14, 15). The 2,5 DHB and CHCA matrices were purchased from Bruker Daltonics (Bremen, Germany) and used without purification. TFA and piperidine were purchased from Sigma-Aldrich (Steinheim, Germany). Usually, 1.5–2 ml of matrix solution was sprayed onto each tissue section using Imageprep (Bruker Daltonics). All other materials were laboratory grade and purchased from Sigma-Aldrich and Abcam Biochemicals (Cambridge, UK).
Animal handling and tissue preparation
All experimental procedures were conducted using protocols approved by the Institutional Animal Care and Use Committee of Konkuk University. Male Sprague–Dawley rats (aged 10 weeks and weighing 300 g) were purchased from Orient Co., Ltd, a branch of Charles River Laboratories (Seoul, Korea). The animals were anesthetized using xylazine/ketamine (30 mg/75 mg/kg, i.p.). The right common carotid artery of the rats was exposed at the external carotid artery (ECA) and internal carotid artery (ICA) division level with a midline neck incision. The ICA was followed rostrally to the pterygopalatine branch, and the ECA was ligated and cut at its lingual and maxillary branches. A 3-0 nylon suture was then introduced into the ICA via an incision on the ECA stump and advanced through the carotid canal until it became lodged in the narrowing of the anterior cerebral artery, blocking the origin of the middle cerebral artery. The endovascular suture was left in place for 2 h. Then the suture filament was retracted to allow reperfusion for 1 h, and the rats were euthanized. Animals were maintained at 37 ± 1°C during all surgical procedures.
To determine the damaged area by hematoxylin and eosin (H and E) staining, brains were dissected, maintained in 4% paraformaldehyde (PFA) for postfixation overnight, and then placed in a 30% sucrose solution for cryoprotection. After dehydration, 30 µm-thick consecutive coronal sections were prepared using a freezing microtome (Leica; Nussloch, Germany) and stained with H and E solution. A digitalized image of each stained brain was obtained under a light microscope (Olympus BX51; Tokyo, Japan).
Animals were euthanized and perfused with ice-cold 4% PFA in phosphate buffered saline (PBS), pH 7.4, for 20 min to determine phospholipase A2 (PLA2) expression in damaged and normal brain regions. Brains were rapidly removed, immersed into a tube with the same fixative for 1 day at 4°C, and stored in 30% sucrose in PBS for 3 days. Forty micrometer-thick coronal sections were cut through the striatum as serial sections on a freezing cryostat (Leica, CM3050). Sections were collected in 24-well culture plates (Falcon; Becton Dickinson Labware S.A., Le Pont de Claix, France) containing 1 ml of tissue stock solution in each well. Every sixth section of each rat was processed using the free-floating method. Sections were immersed with blocking buffer (10% goat serum, 0.3% Triton X-100 in PBS) for 1 h at room temperature. The brain sections were incubated overnight at 4°C with primary antibody against PLA2 (1:100, Abcam) and rinsed with washing buffer (1% goat serum, 0.1% Triton X-100 in PBS) three times for 10 min. Secondary antibody conjugated with Alexa488 anti-rabbit IgG (Invitrogen; Carlsbad, CA) was diluted in blocking buffer and incubated with tissue sections for 2 h at room temperature. After three washes with washing buffer, the brain slices were attached onto the coated slide glass, mounted in Vectashield (Vector Laboratories; Burlingame, CA), and viewed under a confocal microscope (FV-1000 spectral, Olympus).
For IMS experiments, animals were euthanized to dissect the brain, immediately transferred to liquid N2, and then transferred to −80°C. Frozen brain tissue was sectioned using a cryo-cut microtome at −20°C. Usually, 12 µm-thick consecutive coronal sections were made for IMS experiments. Tissue sections were thaw-mounted onto MALDI indium-tin oxide-coated slides (Bruker Daltonics). Sections were dehydrated in a desiccator for 20 min and stored at −80°C until use.
IMS analysis of phospholipids
Both profiling and IMS experiments on tissue sections were performed using an Ultraflex MALDI MS instrument. The 100–1,200 m/z region was selected in both positive- and negative-ionization modes for analysis in the IMS experiments by averaging 500 consecutive laser shots/pixel, because most of the glycerophospholipids appeared in this region. The spatial resolution for the imaging data shown was 150 µm. Mass calibration was performed with external standards prior to data acquisition. Software obtained from Bruker Daltonics (Fleximaging, Flexanalysis, and ClinproTools) was used for data analysis. The region of interest-1 (ROI-1) was selected in the damaged region for principal components analysis (PCA), which was previously confirmed by H and E staining. ROI-2 was selected as representing a normal region of the brain, where no ischemic injury occurred. We compared ROI-1 and ROI-2 to obtain phospholipid numbers that showed significant differences in their distribution between the two regions. We calculated intensity ratios by comparing the average intensities between injured and normal areas with particular m/z values. Ion intensities for each m/z value were normalized by the ClinproTools and FlexImaging software in which all spectral intensities were divided by the obtained total ion count value. Ion intensities were evaluated by comparing ion pairs from injured and consecutive normal tissue on the same brain section after normalization. MS/MS analysis was performed to confirm the chemical structure of the selected lipid of interest.
RESULTS
Comparison of profiling spectra between normal and ischemic-damage regions
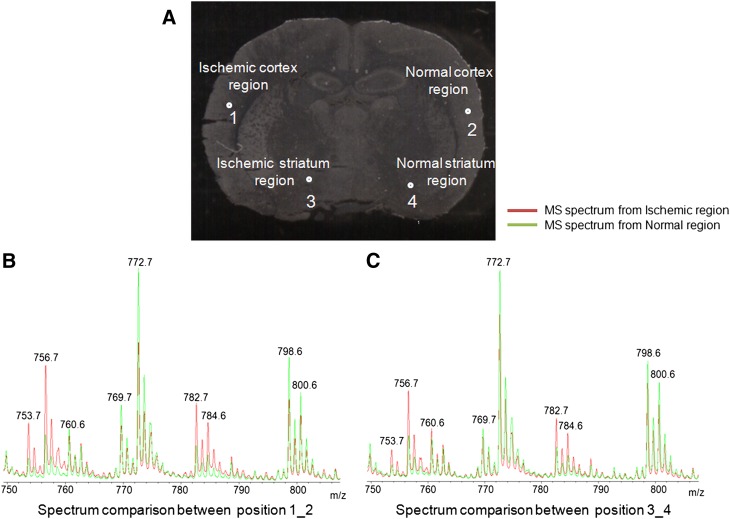
Figure 2A shows ischemic brain tissue in which the left side of the brain experienced a focal ischemic injury and the right side was normal. Certain regions on the left side of the brain were damaged due to the obstruction of blood flow. Figure 2B compares the MS data obtained from a profile experiment conducted in positive-ionization mode between an ischemic cortex region and a normal cortex region. The green-colored spectrum is from a normal region, and the red-colored spectrum is from the ischemic region. We found that several phospholipids, including m/z 753.7, 756.7, 782.7, and 784.6, showed higher expression in the ischemic region, whereas m/z 772.7, 798.6, and 800.6 appeared to be expressed higher in the normal region. In Fig. 2C, we also compared profiling MS spectra from an ischemic striatum and a normal striatum region, and they showed a phospholipid distribution similar to that detected in the cortical regions. We identified several phospholipids that were prominently upregulated in the ischemic-injured portion of the brain (Fig. 2). However, no significant changes in phospholipid distribution were observed when we analyzed spectra obtained in negative mode.
Fig. 2.
Comparison of the tissue imaging and profile data between the ischemic-damaged and normal regions. A: Focal ischemic brain tissue with the four highlighted positions where spectra were collected. Positions 1 and 3 were from a damaged region, whereas 2 and 4 were from a normal region. B: Comparison of MS spectra in positive ionization mode between positions 1 and 2, which are from ischemic and normal cortex regions. C: Comparison of spectra between positions 3 and 4, which are from ischemic striatum and normal striatum regions.
Total MS spectra analysis from IMS by PCA and classification
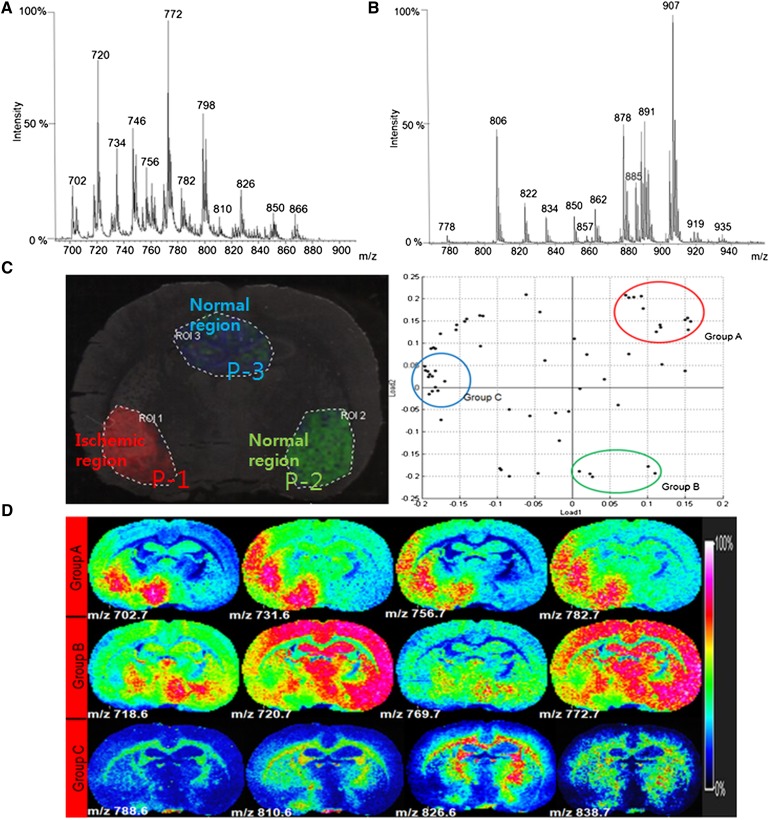
Figures 3A, B show the average MS spectra from whole rat brain tissue in both positive and negative modes, respectively. Based on our previous phospholipid analysis of rat brain tissue sections, >100 m/z features were assigned to specific phospholipids according to their m/z values and MS/MS spectra in both ionization modes (10). Interestingly, some of the phospholipids detected in the positive-ionization mode showed changes in their intensity in the damaged region compared with the normal region of the brain, as seen in the profiling experiments and imaging analysis.
Fig. 3.
Total MS spectrum analysis and statistical analysis by PCA. A: Total MS spectrum in positive ionization mode. B: Total MS spectrum in negative ionization mode. C: PCA and classification analysis of the IMS data in positive-ionization mode. D: Representative images corresponding to the PCA result.
After total MS analysis of tissue in both positive- and negative-ionization modes, the images and distribution of selected m/z features were analyzed statistically by PCA and classified (Fig. 3C). Three regions of P-1, P-2, and P-3 were chosen for classifying the MS spectra. Using the IMS results and H and E-stained images, we confirmed that tissues from the P-1 region were damaged by ischemia, whereas P-2 corresponded to a normal region and P-3 was a normal hippocampal region (Fig. 3C).
Although m/z values corresponding to phospholipids were present in both ischemic-damaged and normal regions of brain tissue, their intensities were enormously different. The PCA revealed that two major phospholipid groups were distinctly distributed in their ion images due to damage. Phospholipids belonging to group A showed increased intensity levels only in the focal ischemic-damaged region of the brain, such as m/z 702.7, 756.7, and 782.7. However, group B phospholipids showed decreased intensity in the ischemic-damaged region compared with that in the normal tissue region, such as m/z 720.6, 769.7, and 772.7. Group C phospholipids were not significantly different in their distribution due to ischemia, such as peaks corresponding to m/z 788.6, 810.6, and 826.6, and showed higher intensity in the corpus callosum region. These PCA results were the same as the classification results, and the intensity ratios are listed in Table 1 (Fig. 3D).
TABLE 1.
Phospholipids that showed significant changes in overall ischemic brain
| m/z | Phospholipid Class | FA (c:db) | Adduct Formation | Average Intensity Ratio of Three IMS Data (Isc-P1/nor-P2) | % RSD (Average of Three IMS Data) | Level of Intensity (Isc-P1/nor-P2) |
| 466.6 | LPCab | 14:1 | no adduct | 2.5 | 41.9 | Increase |
| 496.3 | LPCa | 16:0 | no adduct | 1.8 | 36.7 | Increase |
| 518.3 | LPCab | 16:0 | Na | 4.2 | 43.5 | Increase |
| 580.6 | LPC | 22:0 | no adduct | 4.6 | 45.8 | Increase |
| 702.7 | PEb | 30:0 | no adduct | 2 | 42.7 | Increase |
| 705.7 | SMab | d34:0 | no adduct | 2.3 | 44.9 | Increase |
| 731.6 | SMab | d36:1 | no adduct | 1.3 | 36.6 | Increase |
| 753.7 | SMab | 36:1 | Na | 2.8 | 38.2 | Increase |
| 756.7 | PCa | 32:0 | Na | 3.4 | 39.2 | Increase |
| 782.7 | PCab | 34:1 | Na | 1.8 | 36.4 | Increase |
| 784.6 | PCab | 34:0 | Na | 3 | 37.8 | Increase |
| 534.3 | LPCab | 16:0 | K | 1.6 | 45.8 | Decrease |
| 718.6 | PEab | 34:1 | no adduct | 0.3 | 37.8 | Decrease |
| 747.5 | SMab | d34:1 | no adduct | 0.8 | 48.2 | Decrease |
| 769.7 | SMab | 36:1 | K | 0.3 | 42.1 | Decrease |
| 772.7 | PCa | 32:0 | K | 0.6 | 34.1 | Decrease |
| 798.6 | PCab | 34:1 | K | 0.6 | 38.3 | Decrease |
| 800.6 | PCab | 34:0 | K | 0.8 | 34 | Decrease |
Tissue distribution analysis of selected phospholipids by IMS
Interestingly, the H+ forms of LPC 16:0, PC 34:0, PC 34:1, and PC 32:0 showed nonspecific distribution patterns throughout the brain; whereas Na+ forms of the corresponding phospholipids showed significant increases specifically in the ischemic-damaged region. In contrast, K+ forms of those phospholipids showed decreased concentration in terms of intensity in the ischemic region, compared with those in the normal region (see supplementary ). It was intriguing that there was a propensity toward more-sodiated forms of phospholipids than potassiated forms in the damaged brain region. Energy failure due to loss of ATP in ischemic regions leads to cellular membrane depolarization and initiates uncontrolled leakage of ions across cell membranes (16, 17). Excess formation of glutamate also activates various receptors such as N-methyl-d-aspartate (NMDA) and non-NMDA receptors that are linked to Na+/K+ channels (18). Overstimulation of glutamate receptors causes accumulation of intracellular Na+, Ca2+, inositol trisphosphate, and diacylglycerol (DAG), as well as depletion of intracellular K+. Another explanation concerning Na+ and K+ ion distribution was provided by Amstalden van Hove et al. and Adibhatla and Hatcher (12, 19). In previous studies, it was demonstrated that higher levels of Na+ are present in necrotic regions due to decreased Na+/K+ pump activity and increased cell membrane permeability. A decline in Na+/K+ pump activity can also explain the presence of a lower K+ concentration in a necrotic region. It can also occur due to dysfunction in voltage-gated K+ channels (20). Our findings agree with these previous studies, including our own IMS results of nonsmall cell lung cancer (21). The increased levels of sodiated phospholipids in ischemic regions could be related to disrupted energy regulation in ischemic brain tissue or could be due to acidosis that induces Na+ accumulation during ischemia.
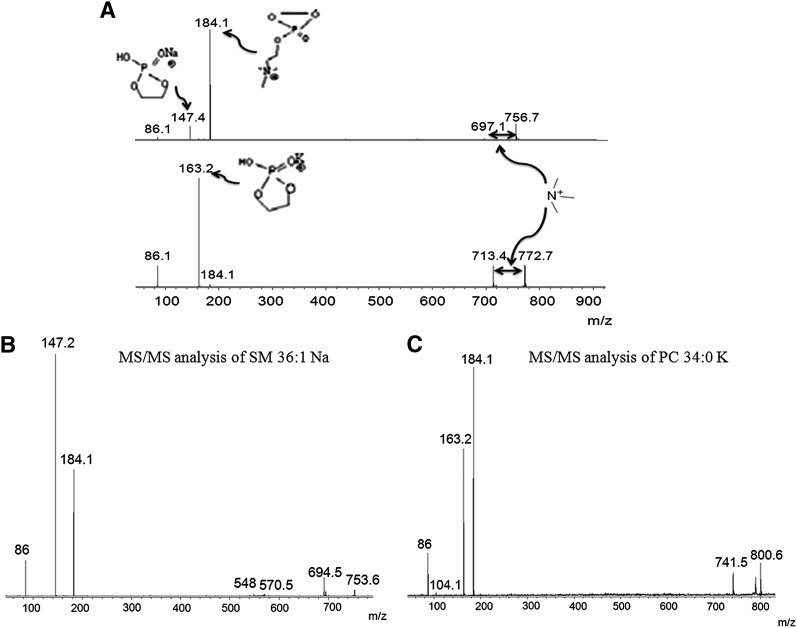
An MS/MS analysis was performed to confirm the structural information on the ions of interest. Figure 4A shows the MS/MS spectra of PC 32:0 Na+ (upper lane) and PC 32:0 K+ (lower lane). The fragment ion at m/z 184.1 of PC 32:0 Na+ represented the PC head group, and a new ion appeared at m/z simultaneously due to the addition of Na+ to the head group. The peak at m/z 697.1 also arose from a neutral loss of 59 u corresponding to trimethylamine, which is a diagnostic fragment ion for PC in MS/MS. The PC 32:0 K parent ion appeared at m/z 772.7. The first fragment ion was at m/z 713.4, which corresponded to the neutral loss of trimethylamine (59 u), which is a characteristic for PC. Because K+ is attached to PC 32:0, a modified head group peak appeared at m/z 163.2, and a PC head group appeared at m/z 184.1. MS/MS analyses of other differentially expressed phospholipids were performed to identify their chemical structures (Fig. 4B, C; supplementary ).
Fig. 4.
A: Validation of selected phospholipids PC 32:0 Na (upper lane) and PC 32:0 K (lower lane) by MS/MS analysis directly on tissue. B: MS/MS spectrum of SM 36:1 Na at m/z 753.6. C: MS/MS spectrum of PC 34:0 K at m/z 800.6.
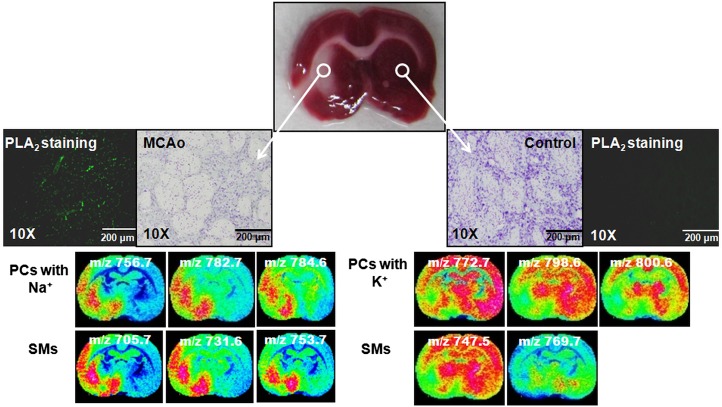
To correlate the IMS data with a conventional imaging method, pictures of H and E-stained ischemic-damaged brain tissue were compared with the MALDI images. Focally ischemic rat brain tissues were stained with Cresyl violet to show the damaged and normal regions of the brain. At the same time, PLA2 staining was performed on tissue to distinguish PLA2 expression between damaged and nondamaged regions. It is well known that overactivation of phospholipase enzymes may change membrane phospholipid composition due to ischemic injury (19, 22, 23).
When MALDI images were evaluated with both H and E- and PLA2-stained images, a number of sodiated sphingo- and glycerol-phospholipids at m/z 753.7, 756.7, 782.7, and 784.6 showed higher intensities in the damaged parts of the brain. In contrast, the potassiated forms of those sphingo- and glycerol-phospholipids at m/z 769.7, 772.7, 798.6, and 800.6 showed comparatively lower intensities in the ischemic-damaged region than in normal brain tissue regions (Fig. 5).
Fig. 5.
Correlation of MALDI imaging data with H and E- and PLA2-stained images. According to the H and E pictures, the left side of the brain showed ischemic damage, and the right side was normal. As expected, the PLA2-stained images showed that the PLA2 level increased in the ischemic-damaged region compared with that in the normal tissue region. The IMS data are matched with the stained images.
Changes in smaller mass lipid species in the infarcted region
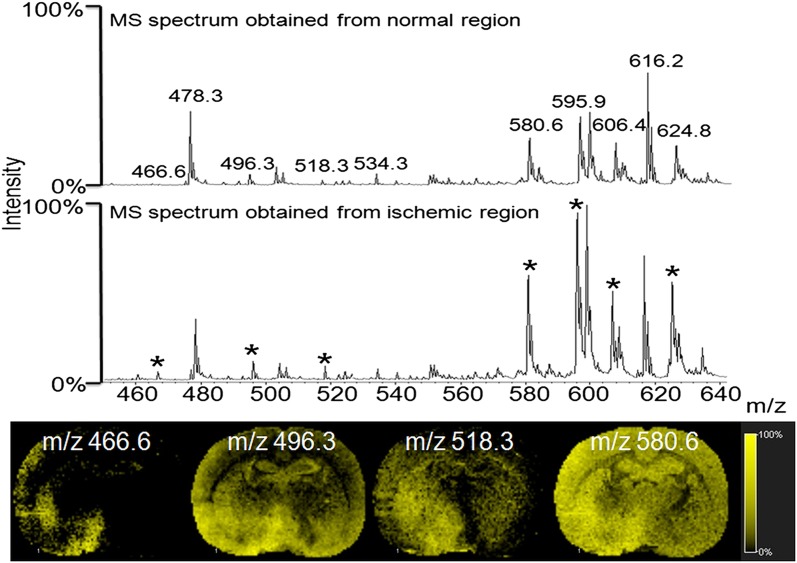
Koizumi et al. (24) and Wang et al. (25) showed that one specific LPC (16:0) at m/z 496.3 is induced after brain ischemic injury. Our present data showed several other lipid species, including LPC (16:0) at m/z 496.3, which showed increased intensity in the ischemic-damaged region. As shown in the Fig. 6 profiling data, several other m/z values were differentially expressed between the damaged and the normal parts of the brain, including LPC (14:1) at m/z 466.6, LPC (16:0 Na) at m/z 518.3, and LPC (16:0 K) at m/z 534.3. All of these lipids were assigned by MS/MS and the lipid map database (http://www.lipidmaps.org). The upregulation of these lipid species is a well-known feature during ischemic cell death (2, 11). The most-prominent change in brain tissue after ischemic damage is the accumulation of DAG and lysophospholipids. Increased DAG kinase activity, initiated by the influx of Ca2+, initiates upregulation of phospholipase enzymes that may change membrane phospholipid composition and increase cellular LPC concentrations to induce apoptosis (26). The images shown in Fig. 6 confirm the higher expression level of these lipid species in the infarcted region.
Fig. 6.
Total MS spectrum comparison in the lower mass range region, and images of selected spectra (*).
An additional statistical analysis was performed on total IMS spectra to confirm our results. We found that the ratios of average intensity and percent relative standard deviation of several phospholipids varied greatly between the ischemic and normal regions of three different ischemic mouse brains (Table 1). We found 18 differentially distributed phospholipids according to their m/z values (Table 1). Among them, 11 phospholipids showed higher concentrations in the focal ischemic-damaged regions of brain tissue and 7 other phospholipids showed lower concentrations in the damaged regions compared with the normal regions.
DISCUSSION
In the present study, we analyzed focal ischemic rat brain tissue sections using Ultraflex MALDI IMS and determined that global phospholipid changes occurred due to ischemia. We found several lipid groups, such as LPC, PC, and phosphatidylethanolamine (PE), which are already known to be active participants in inflammation and apoptosis. We also presented some new findings that might be useful.
We found different compositions of LPC 16:0 between ischemic and normal brain regions, which have been identified by Koizumi et al. (24) as a marker for ischemia. Several other research groups have shown that low ATP production and uncontrolled outflow of ions across the membrane trigger the production of different groups of phospholipases, which, in turn, produce excess amounts of LPC, DAG, and other second messengers during ischemia, due to lower oxygen flow. We found several LPCs in the lower-mass range region that had higher intensities in the damaged region and confirmed their distribution (Fig. 6).
Our goal was to identify global phospholipid changes by IMS to provide insights concerning other types of changes occurring following an ischemic infarction. Because PC is the most-abundant phospholipid on the outer surface of cellular membranes, we presumed that there would be a vast change in this phospholipid. As a result, we found several PC groups with differences in intensity by IMS. When we compared the distribution of PC groups between the ischemic-injured and normal brain regions, we found that sodiated forms of PC were expressed at higher levels in damaged areas, whereas the potassiated form was expressed at higher levels in the normal regions.
However, this result was only observed regarding FA compositions of C16:0, C18:0, and C18:1 and can be explained by uncontrolled ion channels and the effect of FA composition. Paik et al. (27) measured the amount of total FFAs in plasma and brain using a cerebral ischemic rat model. They showed that different FFAs, including palmitic acid (16:0), stearic acid (18:0), and oleic acid (18:1), change. Fang et al. (28) showed that arachidonic acid (20:0), palmitic acid (C16:0), oleic acid (C18:1), and linoleic acid (18:2) also play important roles during ischemic reperfusion, which impacts ion channels. Both palmitic and oleic acid induce intracellular Ca2+ and Na+ production in a dose-dependent manner by opening permeability transition pores. These observations could be an explanation for our finding of higher sodiated PC expression in the ischemic part of the brain.
Production of excess neurotransmitters during cerebral ischemia induces the activity of different phospholipases and activates several receptors that depolarize ion pumps. A decrease in K+ in an infarcted region is a common feature due to irregular Na+/K+ ion channels and dysfunction in voltage-gated K+ channels. Our present IMS data, showing lower expressed potassiated PCs, agree with previously reported cellular mechanisms.
Another interesting finding was the increase in SM content including m/z 705.7, m/z 731.6, and m/z 753.7 in ischemic brain (Fig. 5). SM is the immediate source of several phospholipid metabolites, including ceramide and sphingosine-1-phosophate (S-1-P). Ceramide and S-1-P have been implicated in pathophysiological processes such as apoptosis, the stress response, and inflammatory responses. A number of studies have suggested that ceramide accumulates in the brain during cerebral ischemia, at least, in part, through the activation of sphingomyelinase (29–31). Increased substrate availability, along with the enzymatic activation of sphingomyelinase, may facilitate the production of ceramides and contribute to mitochondrial dysfunction (32). S-1-P plays an important role in the regulation of vascular and immune functions. The S-1-P receptor antagonist fingolimod (FTY720) is in a clinical trial to prevent autoimmune diseases such as multiple sclerosis by inhibiting the recruitment of autoimmune lymphocytes into the central nervous system. Additionally, fingolimod may provide long-term protection in rodent models of cerebral ischemia (33). Taken together, these results and the results from the present study suggest that increased SM availability along with altered metabolic and signaling pathways may underlie the pathological responses in the ischemic brain, although further studies should be conducted.
The objective of this study was to identify compositional changes in total phospholipids initiated by ischemic injury in brain tissue. We successfully analyzed the IMS data acquired from ischemic rat model tissue and found interesting phospholipid changes that were directly related to damaged tissue. Our data agree with previous findings concerning the role of lipid species in ischemic injury, including lysophospholipid formation and disturbances in Na+/K+ homeostasis. We have confirmed that the identified phospholipids can be used as phospholipid biomarkers of ischemic injury.
Supplementary Material
Footnotes
Abbreviations:
- CHCA
- α-cyano-4-hydroxycinnamic acid
- DAG
- diacylglycerol
- DHB
- 2, 5-dihydroxybenzoic acid
- ECA
- external carotid artery
- H and E
- hematoxylin and eosin
- ICA
- internal carotid artery
- LPC
- lysophosphatidylcholine
- MALDI IMS
- MALDI imaging MS
- NMDA
- N-methyl-d-aspartate
- PC
- phosphatidylcholine
- PCA
- principal components analysis
- PFA
- paraformaldehyde
- PLA2
- phospholipase A2
- ROI
- region of interest
- S-1-P
- sphingosine-1-phosophate
- PE
- phosphatidylethanolamine
- TFA
- trifluoroacetic acid
This work was supported by the Converging Research Center Program (Grant 11K000898) and World Class University program (Project No. R33-10128) through the National Research Foundation of Korea, funded by the Ministry of Education, Science, and Technology.
The online version of this article (available at http://www.jlr.org) contains supplementary data in the form of supplementary data in the form of two figures.
REFERENCES
- 1.Adibhatla R. M., Hatcher J. F., Dempsey R. J. 2006. Lipids and lipidomics in brain injury and diseases. AAPS J. 8: E314–E321. [DOI] [PMC free article] [PubMed] [Google Scholar]
- 2.Farooqui A. A., Horrocks L. A., Farooqui T. 2000. Glycerophospholipids in brain: their metabolism, incorporation into membranes, functions, and involvement in neurological disorders. Chem. Phys. Lipids. 106: 1–29. [DOI] [PubMed] [Google Scholar]
- 3.Chaurand P., Schwartz S. A., Reyzer M. L., Caprioli R. M. 2005. Imaging mass spectrometry: principles and potentials. Toxicol. Pathol. 33: 92–101. [DOI] [PubMed] [Google Scholar]
- 4.Murphy R. C., Hankin J. A., Barkley R. M. 2009. Imaging of lipid species by MALDI mass spectrometry. J. Lipid Res. 50 (Suppl.): 317–322. [DOI] [PMC free article] [PubMed] [Google Scholar]
- 5.Schwamborn K., Caprioli R. M. 2010. Molecular imaging by mass spectrometry–looking beyond classical histology. Nat. Rev. Cancer. 10: 639–646. [DOI] [PubMed] [Google Scholar]
- 6.Taguchi R., Houjou T., Nakanishi H., Yamazaki T., Ishida M., Imagawa M., Shimizu T. 2005. Focused lipidomics by tandem mass spectrometry. J. Chromatogr. B Analyt. Technol. Biomed. Life Sci. 823: 26–36. [DOI] [PubMed] [Google Scholar]
- 7.Goto-Inoue N., Hayasaka T., Zaima N., Setou M. 2011. Imaging mass spectrometry for lipidomics. Biochim. Biophys. Acta. 1811: 961–969. [DOI] [PubMed] [Google Scholar]
- 8.Chughtai K., Heeren R. M. 2010. Mass spectrometric imaging for biomedical tissue analysis. Chem. Rev. 110: 3237–3277. [DOI] [PMC free article] [PubMed] [Google Scholar]
- 9.Schiller J., Suss R., Arnhold J., Fuchs B., Lessig J., Muller M., Petkovic M., Spalteholz H., Zschornig O., Arnold K. 2004. Matrix-assisted laser desorption and ionization time-of-flight (MALDI-TOF) mass spectrometry in lipid and phospholipid research. Prog. Lipid Res. 43: 449–488. [DOI] [PubMed] [Google Scholar]
- 10.Shanta S. R., Zhou L. H., Park Y. S., Kim Y. H., Kim Y., Kim K. P. 2011. Binary matrix for MALDI imaging mass spectrometry of phospholipids in both ion modes. Anal. Chem. 83: 1252–1259. [DOI] [PubMed] [Google Scholar]
- 11.Drgová A., Likavcanova K., Dobrota D. 2004. Changes of phospholipid composition and superoxide dismutase activity during global brain ischemia and reperfusion in rats. Gen. Physiol. Biophys. 23: 337–346. [PubMed] [Google Scholar]
- 12.Amstalden van Hove E. R., Blackwell T. R., Klinkert I., Eijkel G. B., Heeren R. M., Glunde K. 2010. Multimodal mass spectrometric imaging of small molecules reveals distinct spatio-molecular signatures in differentially metastatic breast tumor models. Cancer Res. 70: 9012–9021. [DOI] [PMC free article] [PubMed] [Google Scholar]
- 13.Lipton P. 1999. Ischemic cell death in brain neurons. Physiol. Rev. 79: 1431–1568. [DOI] [PubMed] [Google Scholar]
- 14.Schiller J., Arnhold J., Benard S., Muller M., Reichl S., Arnold K. 1999. Lipid analysis by matrix-assisted laser desorption and ionization mass spectrometry: a methodological approach. Anal. Biochem. 267: 46–56. [DOI] [PubMed] [Google Scholar]
- 15.Lytle C. A., Gan Y. D., White D. C. 2000. Electrospray ionization/mass spectrometry compatible reversed-phase separation of phospholipids: piperidine as a post column modifier for negative ion detection. J. Microbiol. Methods. 41: 227–234. [DOI] [PubMed] [Google Scholar]
- 16.Lutz P. L., Prentice H. M. 2002. Sensing and responding to hypoxia, molecular and physiological mechanisms. Integr. Comp. Biol. 42: 463–468. [DOI] [PubMed] [Google Scholar]
- 17.Hankin J. A., Farias S. E., Barkley R. M., Heidenreich K., Frey L. C., Hamazaki K., Kim H. Y., Murphy R. C. 2011. MALDI mass spectrometric imaging of lipids in rat brain injury models. J. Am. Soc. Mass Spectrom. 22: 1014–1021. [DOI] [PMC free article] [PubMed] [Google Scholar]
- 18.Farooqui A. A., Yang H. C., Rosenberger T. A., Horrocks L. A. 1997. Phospholipase A2 and its role in brain tissue. J. Neurochem. 69: 889–901. [DOI] [PubMed] [Google Scholar]
- 19.Muralikrishna Adibhatla R., Hatcher J. F. 2006. Phospholipase A2, reactive oxygen species, and lipid peroxidation in cerebral ischemia. Free Radic. Biol. Med. 40: 376–387. [DOI] [PubMed] [Google Scholar]
- 20.Summers R. M., Joseph P. M., Kundel H. L. 1991. Sodium nuclear magnetic resonance imaging of neuroblastoma in the nude mouse. Invest. Radiol. 26: 233–241. [DOI] [PubMed] [Google Scholar]
- 21.Lee G. K., Lee H. S., Park Y. S., Lee J. H., Lee S. C., Lee S. J., Shanta S. R., Park H. M., Kim H. R., Kim I. H., et al. 2012. Lipid MALDI profile classifies non-small cell lung cancers according to the histologic type. Lung Cancer. 76: 197–203. [DOI] [PubMed] [Google Scholar]
- 22.Adibhatla R. M., Hatcher J. F. 2007. Secretory phospholipase A2 IIA is up-regulated by TNF-alpha and IL-1alpha/beta after transient focal cerebral ischemia in rat. Brain Res. 1134: 199–205. [DOI] [PMC free article] [PubMed] [Google Scholar] [Retracted]
- 23.Wright C. B., Moon Y., Paik M. C., Brown T. R., Rabbani L., Yoshita M., DeCarli C., Sacco R., Elkind M. S. 2009. Inflammatory biomarkers of vascular risk as correlates of leukoariosis. Stroke. 40: 3466–3471. [DOI] [PMC free article] [PubMed] [Google Scholar]
- 24.Koizumi S., Yamamoto S., Hayasaka T., Konishi Y., Yamaguchi-Okada M., Goto-Inoue N., Sugiura Y., Setou M., Namba H. 2010. Imaging mass spectrometry revealed the production of lyso-phosphatidylcholine in the injured ischemic rat brain. Neuroscience. 168: 219–225. [DOI] [PubMed] [Google Scholar]
- 25.Wang H. Y., Liu C. B., Wu H. W., Kuo J. S. 2010. Direct profiling of phospholipids and lysophospholipids in rat brain sections after ischemic stroke. Rapid Commun. Mass Spectrom. 24: 2057–2064. [DOI] [PubMed] [Google Scholar]
- 26.Nakano T., Hozumi Y., Ali H., Saino-Saito S., Kamii H., Sato S., Kayama T., Watanabe M., Kondo H., Goto K. 2006. Diacylglycerol kinase zeta is involved in the process of cerebral infarction. Eur. J. Neurosci. 23: 1427–1435. [DOI] [PubMed] [Google Scholar]
- 27.Paik M. J., Li W. Y., Ahn Y. H., Lee P. H., Choi S., Kim K. R., Kim Y. M., Bang O. Y., Lee G. 2009. The free fatty acid metabolome in cerebral ischemia following human mesenchymal stem cell transplantation in rats. Clin. Chim. Acta. 402: 25–30. [DOI] [PubMed] [Google Scholar]
- 28.Fang K. M., Lee A. S., Su M. J., Lin C. L., Chien C. L., Wu M. L. 2008. Free fatty acids act as endogenous ionophores, resulting in Na+ and Ca2+ influx and myocyte apoptosis. Cardiovasc. Res. 78: 533–545. [DOI] [PubMed] [Google Scholar]
- 29.Nakane M., Kubota M., Nakagomi T., Tamura A., Hisaki H., Shimasaki H., Ueta N. 2000. Lethal forebrain ischemia stimulates sphingomyelin hydrolysis and ceramide generation in the gerbil hippocampus. Neurosci. Lett. 296: 89–92. [DOI] [PubMed] [Google Scholar]
- 30.Kubota M., Nakamura T., Sunami K., Ozawa Y., Namba H., Yamaura A., Makino H. 1989. [Changes in local cerebral glucose utilization, DC potential and extracellular potassium in various degrees of experimental cerebral contusion] No To Shinkei. 41: 799–805. [PubMed] [Google Scholar]
- 31.Herr I., Martin-Villalba A., Kurz E., Roncaioli P., Schenkel J., Cifone M. G., Debatin K. M. 1999. FK506 prevents stroke-induced generation of ceramide and apoptosis signaling. Brain Res. 826: 210–219. [DOI] [PubMed] [Google Scholar]
- 32.Novgorodov S. A., Gudz T. I. 2009. Ceramide and mitochondria in ischemia/reperfusion. J. Cardiovasc. Pharmacol. 53: 198–208. [DOI] [PMC free article] [PubMed] [Google Scholar]
- 33.Wei Y., Yemisci M., Kim H. H., Yung L. M., Shin H. K., Hwang S. K., Guo S., Qin T., Alsharif N., Brinkmann V., et al. 2011. Fingolimod provides long-term protection in rodent models of cerebral ischemia. Ann. Neurol. 69: 119–129. [DOI] [PMC free article] [PubMed] [Google Scholar]
Associated Data
This section collects any data citations, data availability statements, or supplementary materials included in this article.


