Abstract
Apolipoprotein (apo) O is a novel apolipoprotein that is present predominantly in high density lipoprotein (HDL). However, overexpression of apoO does not impact on plasma HDL levels or functionality in human apoA-I transgenic mice. Thus, the physiological function of apoO is not yet known. In the present study, we investigated relationships between plasma apoO levels and high-sensitive C-reactive protein (hs-CRP) levels, as well as other lipid parameters in healthy subjects (n = 111) and patients with established acute coronary syndrome (ACS) (n = 50). ApoO was measured by the sandwich dot-blot technique with recombinant apoO as a protein standard. Mean apoO level in healthy subjects was 2.21 ± 0.83 µg/ml whereas it was 4.94 ± 1.59 µg/ml in ACS patients. There were significant differences in plasma level of apoO between two groups (P < 0.001). In univariate analysis, apoO correlated significantly with lg(hsCRP) (r = 0.48, P < 0.001) in ACS patients. Notably, no significant correlation between apoO and other lipid parameters was observed. Logistic regression analysis showed that plasma apoO level was an independent predictor of ACS (OR = 5.61, 95% CI 2.16–14.60, P < 0.001). In conclusion, apoO increased in ACS patients, and may be regarded as an independent inflammatory predictor of ACS patients.
Keywords: apolipoproteins, atherosclerosis, high density lipoprotein, inflammation, lipoproteins
HDL is endowed with antiatherogenic effects. In addition to its role in reverse cholesterol transport, HDL exerts several other beneficial effects, including the ability to induce endothelial nitric oxide synthase, to protect LDL against oxidation and to inhibit immune and inflammatory responses (1–4). Protein cargo of HDL accounts for its major function. Proteomics analysis revealed the presence of 56 HDL-associated proteins including all known apolipoproteins and lipid transport proteins (5). However, the precise function of each HDL-associated protein and the factors responsible for the protective effects of HDL are still incompletely understood.
Apolipoprotein (apo) O is a new member of the apolipoprotein family, which was first discovered in 2006 (6). It is mainly present in HDL and in a much lower amount in LDL and VLDL. Its physiologic role remains incompletely known. Comparable to other α-helix-containing proteins, purified recombinant apoO has been shown to elicit cholesterol efflux from J774 cells in vitro. However, an in vivo study has shown that high level overexpression of apoO resulted in a substantial increase in plasma apoO level as well as HDL apoO content but left plasma HDL cholesterol level and HDL functionality essentially unchanged (7), suggesting this newly identified apolipoprotein might not be a major modulator of HDL under normal physiological conditions. Moreover, apoO was not detected in the comprehensive proteomics study aiming at the identification of HDL-associated proteins (5), conceivably because the abundance of this apolipoprotein is low. However, until now, little was known about its plasma level either in normal subjects or in pathophysiological conditions such as acute coronary syndrome (ACS).
Therefore, the aim of the present study was to measure the plasma levels of apoO and explore the association between apoO and other lipid parameters. We have synthesized apoO protein and raised a monoclonal antibody (MAb) against human apoO and used them to develop a new dot-blot sandwich analysis. We then used the assay to study plasma total apoO concentrations in healthy subjects and ACS patients.
MATERIALS AND METHODS
Study groups
Subjects for the present study consisted of 50 ACS patients (32 males and 18 females with a mean age of 64.6 ± 9.3 years) and 111 unrelated individuals who were enrolled as control group (71 males and 40 females with a mean age of 63.2 ± 5.8 years). Diagnostic criteria for unstable angina and acute myocardial infarction were taken from the related guidelines from American College of Cardiology/American Heart Association published in 2007 [for details, please see: (1)]. Briefly, the patients were diagnosed as ACS who had acute chest pain symptoms, changes in serial ECG tracings with (acute myocardial infarction) or without (unstable angina) abnormalities of serum cardiac biomarkers such as creatine kinase, creatine kinase-MB, and/or troponins. Exclusion criteria were (1) severe hepatic or/and renal diseases; (2) severe heart failure; (4) other diseases, including severe hypertriglyceridemia (triglycerides ≥5.65 mmol/L), acute or recent (<2 months) infection, immunologic disorders, thyroid diseases, recent major trauma, and cancer; and (5) treatment with immunosuppressive or anti-inflammatory agents. All individuals in both ACS and control groups are Han Chinese. This study was approved by the ethical committee of the Second XiangYa Hospital. Written informed consent was obtained from all subjects.
Strains and plasmids
ApoO cDNA generated from reverse transcription of mRNA from human normal liver L-02 cells was PCR-amplified using Taq polymerase (Takara) and the following primers: forward, 5′- GTC TCG GAT CCA AAA AGG ACT CAC CTC CCA AAA ATT -3′, and reverse, 5′-GTC TCC TCG AGC TTA GTT CCA GGT GAA TTC TTC AC-3′. The sequence was inserted into pET-32a(+) expression vector (Qiagen) using the restriction sites BamHI and XhoI. Competent DH10B and BL21 (DE3) cells (Novagen) were prepared using Transformation and Storage Solution, essentially as described previously. The DH10B transformants obtained were subjected to sequence analysis to verify the presence of the expected sequence. The constructed pET-apoO plasmid was isolated and transformed into BL21 (DE3) cells for protein expression.
Protein expression and purification
ApoO protein was expressed in BL21 (DE3) cells, which were grown on Luria-Bertani medium with 50 μg/ml ampicillin. The culture was incubated at 37°C with constant shaking at 200 rpm until the A550 nm reached 0.5-1.0. Isopropyl β-d-thiogalactoside (IPTG) was added to a final concentration of 0.1 mM to induce protein expression, and the culture was incubated at 37°C with shaking for 4 h. Cells were pelleted at 5,000 g for 15 min at 4°C and resuspended in 40 ml of ice-cold imidazole buffer (20 mM imidazole, 500 mM NaCl, and 20 mM phosphate buffer, pH 6.6) supplemented with 1 mM phenylmethanesulfonyl fluoride (Amresco), 1 mM MgCl2, and 0.2 mg/ml lysozyme. The cells were disrupted by sonication and insoluble proteins were pelleted by centrifugation at 5,000 g for 30 min at 4°C. Supernatant contained soluble apoO conjugated with thioredoxin (Trx). Purified Trx-apoO was purified using an IMAC (Immobilized Metal Affinity Chromatography) column HiTrap FF (Amersham-Pharmacia Bio-Science) following the manufacturer's recommendations. The elution fractions containing Trx-apoO were dialyzed in PBS at 4°C overnight, and the protein concentration was determined by BCA assay with BSA (Sigma) as the standard.
Generation and screening of monoclonal antibodies
Purified Trx-apoO was used to immunize BALB/c mice. Animals were euthanized 3 days after the last injection and splenocytes were fused at a 1:10 ratio with the mouse SP2/0 hybridoma fusion partner using standard techniques. Hybridomas were selected in complete DMEM-10% FCS with 1×hypoxanthine/aminopterin/thymidine supplement, prior to limiting dilution culture in 96-well plates for 10 days. After hypoxanthine/aminopterin/thymidine selection, hybridomas were passaged into 1×HT medium for 2 weeks, during which time supernatants were collected in 96-well format and screened by ELISA for their specificity to apoO using purified apoO. The anti-apoO antibody-producing hybridoma clones were injected into the abdominal cavities of normal BALB/c mice. After 7–10 days, the mice were euthanized and ascites were collected. Finally, the apoO antibodies were purified by column chromatography using DEAE Sephadex A-50 ion-exchange chromatography (Pharmacia) from the ascites. Antibody concentration was determined by absorbance at 280 nm.
Measurement of plasma apoo concentration
Plasma apoO concentration was determined with a dot-blot sandwich technique. Each plasma sample was diluted in PBS (dilution ratio1:20). The protein standard, recombinant human apoO with a Trx-tag at a concentration of 0.1 μg/μl, was diluted in PBS, in ratios of 1:100, 1:200, 1:400, 1:800, 1:1600, and 1:3200. 5 μl of the plasma specimens was placed on the polyvinylidene difluoride (PVDF) membrane (Bio-rad) in three repetitions and 5 μl of the recombinant apoO dilutions was placed in two repetitions. Distilled water and a 3% solution of BSA were used as a negative control. The membrane was blocked with a 5% solution of nonfat dry milk. The membranes were then incubated at room temperature in a 1:1000 dilution of HRP conjugated mouse anti-human apoO monoclonal antibody in Tween-TBS overnight. Membranes were washed three times in Tween/TBS, and then developed using Supersignal West Pico chemiluminescent substrate (Pierce), and signal detection was made by Kodak Image Station 4000MM. The mean signal densities within the repetitions of each specimen and protein standards were measured with Carestream Molecular Imaging software (Version 5.0.2.30 Kodak) and presented as net intensity. ApoO concentration was calculated from the standard curves computed on the basis of recombinant apoO dilutions.
The inter- and intra-assay imprecision of the measurements was evaluated with 10 and 20 repeated measurements respectively for three samples. The precision was presented as coefficient of variation (CV).
To test for the specificity of the detection, a Western blot assay was performed with 10 μl of 1:20 dilutions of plasma samples, 1:1000 recombinant apoO dilution, 0.3% BSA, and distilled water. The proteins were separated by 10% SDS-PAGE gel and transferred to PVDF membranes using the wet tank transfer technique. The membranes were then processed as described above.
Lipid measurements
Blood samples were obtained after an overnight fast and stored at −80°C until analysis. Plasma was isolated from blood coagulation with centrifugation for 20 min at 4°C. Lipids were measured enzymatically by a Hitachi 7060 analyzer using available commercial kits for cholesterol and triglycerides. C-reactive protein levels were analyzed with a high-sensitivity assay (hs-CRP; N Latex CRP mono).
Lipoprotein seperation by FPLC
Size-fractionation of lipoproteins was performed by fast protein liquid chromatography (FPLC). In brief, a Amersham BioSciences FPLC equipped with a Superose 6 column (GE Healthcare Europe GmbH, Munich, Germany) was used with Dulcobecco's PBS containing 1 mM EDTA as a running buffer. After loading 0.6ml serum, the system was run with a constant flow of 0.5 ml/min, and fractions 1–40 were harvested for further dot-blot analysis.
Statistical analysis
Data are presented as mean ± SE. Because hs-CRP plasma concentrations have nonGaussian distribution, the original hs-CRP values were transformed logarithmically. Test of normality and homogeneity test for variance were essential. Independent samples t-test was used to compare means in groups.Correlations were analyzed by Pearson's correlation coefficient. Logistic regression analysis was used to create a model to predict the risk of plasma apoO concentration for ACS. A P-value < 0.05 was considered statistically significant.
RESULTS
Characterization of anti-apoO MAb
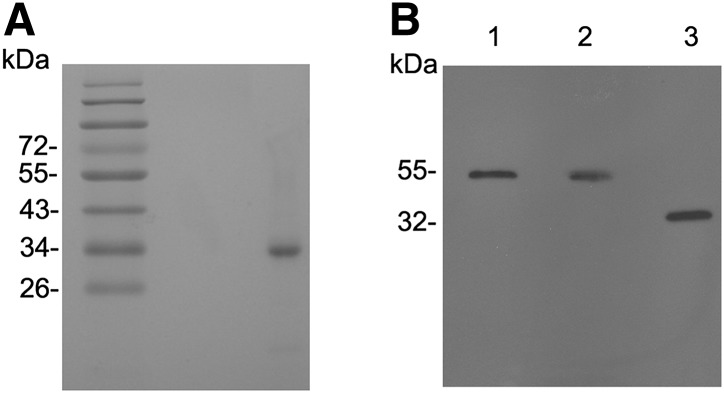
The bacterial Trx-apoO purified from the lysate of Escherichia coli showed a major band of 32 kDa (Fig. 1A). This represented 99% of the total protein after scanning the gel. The MAb specific for apoO was established. When human plasma and culture medium of HepG2 cells were subjected to SDS-PAGE, the MAb reacted with a single protein (Fig. 1B), the molecular mass of which (55 kDa, Fig. 1B, lanes 1 and 2) was similar to that previously reported for human plasma apoO (6). Because of the cellular glycosylation process, the molecular weight of bacterial recombinant apoO (rhapoO) conjugated with Trx appeared to be less than those in plasma and culture medium. There was no evidence of recognition of other plasma proteins. Neither distilled water nor albumin produced a detectable signal in Western blot and dot-blot (data not shown).
Fig. 1.
Characterization of purified human recombinant Trx-tagged apolipoprotein O (Trx-apoO; A) and monoclonal antibody (MAb; B). A: Purified Trx-apoO (1µg) was analyzed by SDS-PAGE and visualized by Coomassie brilliant blue. B: Human plasma (1µl; lane 1), culture medium of HepG2 cells (1µl; lane 2), and purified bacterial Trx-apoO (0.2 ng; lane 3) were subjected to SDS-PAGE under reducing conditions. Immunoblotting with MAb was performed as described in Methods.
Distribution of apoO on lipoprotein subclasses
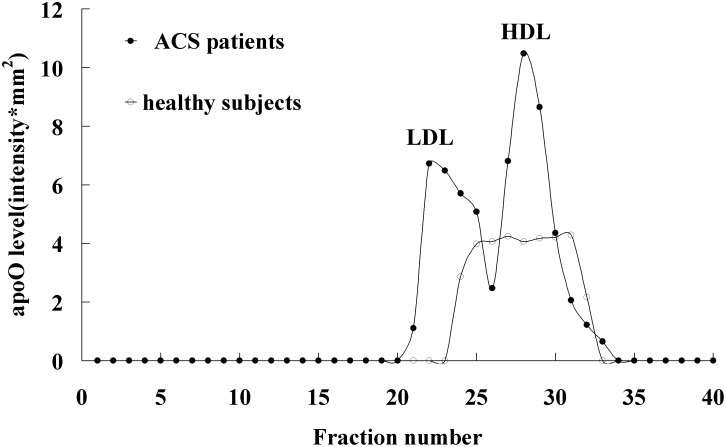
To characterize the apoO distribution in plasma lipoprotein subclasses, lipoproteins from healthy subjects or ACS patients were separated by FPLC for subsequent dot-blot analysis of apoO expression. ApoO distribution in lipoprotein subclasses are shown in Fig. 2. In healthy subjects, apoO mainly exists in HDL particles; we could not detect apoO in LDL and VLDL particles. However, in ACS patients, apoO was detected in both LDL and HDL particles.
Fig. 2.
Distribution of apoO on lipoprotein subclasses. HDL, LDL, and VLDL were isolated from healthy subjects and ACS patients by FPLC. Then, each fraction was analyzed by dot-blot. ApoO level in each fraction was expressed as sum intensity.
Standardization of dot-blot sandwich analysis for plasma apoO concentration
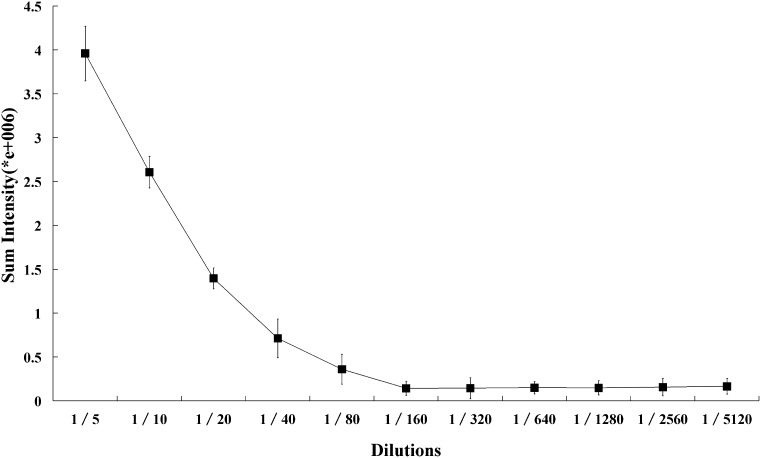
To avoid potential nonlinearity caused by very low or high intensity, the apoO concentrations in plasma samples were measured using several dilutions (1:5 to 1:5,120). The analysis system we developed showed a dose-dependent response to human plasma in the dilution range of 1:5 to 1:160 (Fig. 3). Thus, a 20-fold dilution of plasma was chosen for routine use.
Fig. 3.
Titration curve of human plasma. The dot-blot sandwich analysis was performed as described in Methods. The titration curve was made using serial dilutions (1:5 to 1:100, 5120) of human plasma. Each point represents the mean of triplicate determinations.
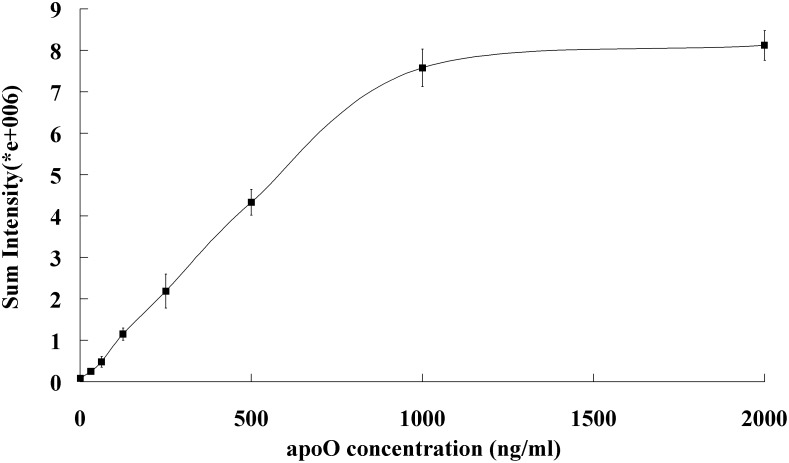
For calibration of the analysis, purified bacterial rhapoO was used as the calibrator. Serial dilutions (1:100 to 1:3200) of 0.1 μg/μl rhapoO were made to obtain a calibration curve (Fig. 4). The dot-blot was linear up to 1,000 ng/ml and suitable for quantifying apoO concentrations as low as 31.25 ng/ml.
Fig. 4.
Standard curve for purified rhapoO concentration. The standard curve was made using serial dilutions (1:100 to 1:3200) of 0.1 μg/μl purified rhapoO. Each point is the mean of triplicate determinations.
Mean inter-assay imprecision of dot-blot, evaluated as CV, was 7.9% and intra-assay imprecision (CV) was 7.4%.
Clinical characteristics of CAD patients and control group
The clinical characteristics of coronary artery disease (CAD) patients and control group are shown in Table 1. There were no significant differences in gender, age, body mass index, and blood glucose between these groups. ACS patients had higher hypertension rates. As expected, triglycerides (1.85 ± 0.97 mmol/L vs. 1.27 ± 0.72 mmol/L, P= 0.027) were significantly higher in the ACS group whereas HDL cholesterol level (1.00 ± 0.22 mmol/L vs. 1.48 ± 0.34 mmol/L, P< 0.001) was markedly lower. Surprisingly, the plasma TC level in ACS patients (4.27 ± 1.33 mmol/L) was significantly lower than that in control subjects (4.85 ± 0.63 mmol/L, P< 0.001), conceivably because the modifications in lipids occur after ACS (8, 9). Hs-CRP concentration was significantly higher in patients with ACS (11.84 ± 21.30 mmol/L) than in controls (0.75 ± 0.36 mmol/L) (P< 0.001). In addition, five patients in ACS group took statins before admission.
TABLE 1.
The clinical and biochemical data of the subjects
| Control Group | ACS Group | P | |
| (n = 111) | (n = 50) | ||
| Gender (male/female) | 71/ 40 | 32/18 | NS |
| Age (years) | 63.2 ± 5.8 | 64.6 ± 9.3 | NS |
| BMI (kg/m2) | 23.3 ± 2.8 | 23.5 ± 2.7 | NS |
| Hypertentsion (%) | 10.1 | 33.9 | 0.000 |
| Blood glucose (mmol/L) | 4.82 ± 0.58 | 4.78 ± 0.62 | NS |
| Triglycerides (mmol/L) | 1.27 ± 0.72 | 1.85 ± 0.97 | 0.027 |
| Total cholesterol (mmol/L) | 4.85 ± 0.63 | 4.27 ± 1.33 | 0.000 |
| HDL cholesterol (mmol/L) | 1.48 ± 0.34 | 1.00 ± 0.22 | 0.008 |
| LDL cholesterol (mmol/L) | 2.78 ± 0.58 | 2.77 ± 1.25 | NS |
| hs-CRP (mg/L) | 0.75 ± 0.36 | 11.84 ± 21.30 | 0.000 |
ACS, acute coronary syndrome; BMI, body mass index; hs-CRP, high-sensitivity C-reactive protein.
Plasma apoO concentration in healthy subjects and CAD patients
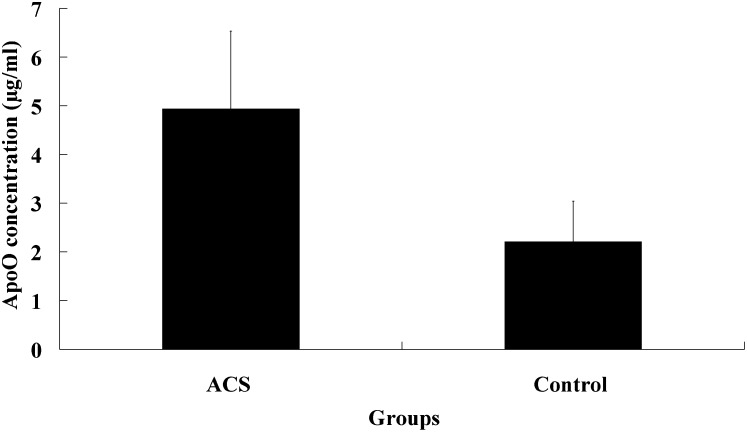
As shown in Fig. 5, the average plasma apoO concentration was 2.21 ± 0.83 µg/ml, ranging from 1.05 to 5.47µg/ml in healthy subjects, whereas it was 4.94 ± 1.59 µg/ml in CAD patients. There were significant differences in plasma level of apoO between two groups (P<0.001). Sex did not influence apoO level in healthy subjects (2.29 vs. 2.15 µg/ml, p =0.893 for males and females). In CAD patients, it was higher in males (5.09 ± 1.51 µg/ml) than in females (4.39 ± 1.77µg/ml) although without statistic significance (P =0.356).
Fig. 5.
Plasma concentration of ApoO in CAD patients and the control group. ApoO concentration was determined by dot-blot sandwich analysis as described in Methods. Data are presented as means ± SD. The concentration of plasma ApoO was 4.94 ± 1.59 µg/ml in CAD patients and 2.21 ± 0.83 µg/ml in the control group. Plasma concentration of ApoO was higher in CAD patients than that in the control group. There were significant differences between CAD patients and controls using Student's t-test (P < 0.001).
Plasma apoO concentrations in relation to lipid profiles and hs-CRP
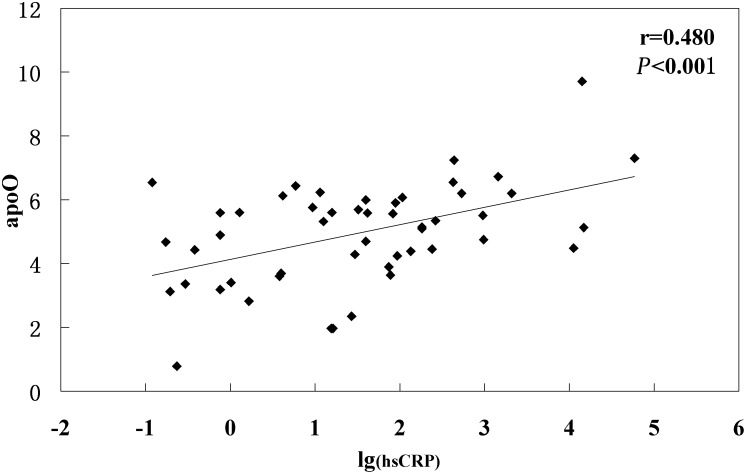
To investigate the relationship between plasma apoO level and other lipid parameters, a correlation analysis was performed in both controls and ACS patients. To our surprise, no significant associations were observed between plasma apoO level and all other lipid parameters in either controls or ACS patients. However, significant positive correlation was detected between apoO and lg(hsCRP) in ACS patients (r = 0.480, P < 0.001) (Fig. 6).
Fig. 6.
Correlation between plasma apoO levels and lg(hs-CRP) in all CHD patients.
Relationship between plasma apoO level and the risk of ACS
To determine whether plasma apoO level is an independent predictor of ACS, a multiple logistic regression analysis was performed. After adjustment for confounding factors including age, gender, smoking, blood pressure, blood glucose, triglyceride, HDL cholesterol, LDL cholesterol, statins treatment, and hs-CRP, we demonstrated that apoO was an independent predictor of ACS (OR = 5.61, 95% CI 2.16–14.60, P < 0.001).
Lipopolysaccharide stimulates apoO expression in adipocytes and HepG2 cells
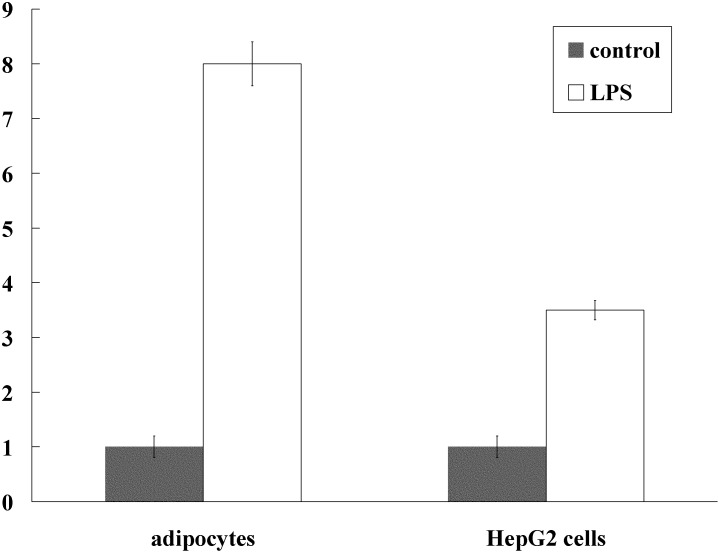
To explore the effect of inflammatory stimulus on the expression of apoO, we detected the apoO mRNA expression using real-time PCR in adipocytes and HepG2 cells pretreated with lipopolysaccharide (LPS, 1000ng/ml). It has been shown that incubation of adipocytes and HepG2 cells with lipopolysaccharide for 24 h can cause a 7-fold and 2.5-fold increase in apoO mRNA expression, respectively, as compared with the control (P < 0.001 for both) (Fig. 7).
Fig. 7.
Lipopolysaccharide stimulates apoO expression in adipocytes and HepG2 cells. Fully differentiated adipocytes and HepG2 cells were incubated in the medium containing lipopolysaccharide (LPS, 1000ng/ml) for 24 h. The expression of apoO was assessed by real-time PCR and GAPDH was used as the housekeeping gene for normalization. P < 0.001 for both.
DISCUSSION
We developed a dot-blot sandwich analysis for plasma apoO concentration using a monoclonal antibody. The specificity of the antibody was confirmed by immunoblotting. It could react with purified rhapoO from E. coli. Furthermore, it could similarly react with a single protein of 55 kDa in human plasma and culture medium from HepG2 cells, which is the same as that reported previously for secreted apoO. The applied sandwich analysis can be used to measure up to 1,000 ng/ml plasma apoO with linearity. The lowest concentration of apoO detectable was about 31.25 ng/ml.
Using the dot-blot sandwich apoO analysis that we developed, for the first time, we observed human plasma apoO concentrations ranging from 1.05 to 5.47 mg/L with a mean value in normal subjects of 2.21 mg/L. These are very low concentrations compared with 1 g/L for apoA-I,which is the main apolipoprotein in HDL. Furthermore, analysis of the distribution of apoO on lipoprotein subclasses in healthy subjects showed that apoO mainly exists in nonlipoprotein fraction and HDL particles (6). Hence, its level in HDL particles is lower than that in plasma. This explains why apoO was not detected in the comprehensive proteomics study aiming at the identification of HDL-associated proteins.
Although apoO was reported to have an apparent association with plasma HDL, the impact of apoO expression on plasma lipid and lipoprotein levels as well as on HDL functional properties still need to be further investigated. The availability of dot-blot sandwich analysis, which is used to detect apoO concentration in human plasma, will contribute to gaining insight into either the function of apoO or the mechanism involved. However, in our study, we detected plasma apoO concentrations in 111 healthy Chinese individuals and failed to find a significant correlation between apoO plasma level and HDL cholesterol or other lipid parameters in either males or females. Thus, we were unable to confirm the influence of apoO on plasma lipoprotein levels or HDL functionality. Earlier studies showed that purified apoO could elicit cholesterol efflux from macrophages in vitro (6), consistent with its role as an α-helix-containing apolipoprotein. However, Nijstad et al (7) recently demonstrated that high level overexpression of apoO by means of a recombinant adenovirus or AAV vector resulted in a substantial increase in plasma apoO levels as well as HDL apoO content in human apoA-I transgenic mice but left plasma HDL cholesterol levels and HDL functionality essentially unchanged. Hence, these data and the results of our study indicate that, in contrast to the reported efflux-eliciting properties in vitro, apoO as a constituent of HDL might not determine plasma HDL levels or function in vivo. The possibility remains that apoO is carried on HDL particles to elicit biological responses on cells and tissues. In addition, a recently published genome-wide association study suggested apoO might be involved in increasing suicidal ideation during antidepressant treatment (10), raising the possibility that apoO has functions in the tissues it is expressed in. Therefore, further studies will be needed to investigate the precise functional importance of apoO in vivo.
More interestingly, our analysis showed that concentration of plasma apoO in ACS patients was higher than that in the control group. Despite part of apoO protein being distributed in LDL particles, we were unable to find a significant correlation between apoO plasma level and LDL cholesterol. Notably, correlation analysis between the concentration of plasma apoO and hs-CRP showed that plasma level of apoO is positively associated with hs-CRP. It is clear that inflammation play a vital role in the pathogenesis of ACS. In the vicinity of plaque formation, inflammation in ACS also occurs at a systemic level, not only from locally produced cytokines that are released into the circulation but also from liver proteins that are produced during the acute phase response. CRP is a pentraxin acute-phase protein and its level increases many hundred-fold in ACS (11, 12). Other apolipoproteins such as apoAV and apoA-IV were demonstrated to be acute-phase proteins (13). In previous studies from our laboratory, we have shown that plasma apoAV levels elevated in ACS patients (14). Furthermore, in vitro studies have shown that lipopolysaccharide, which is a kind of inflammatory stimulus, could significantly stimulate apoO expression in HepG2 cells and adipocytes. Thus, even though we have no in vivo evidence, it is conceivable that apoO may also be a positive acute-phase protein that elevates during inflammation and the overproduction of apoO from liver and adipose tissue resulting from activated inflammation could be the reason for elevated apoO during ACS.
The systemic inflammatory mediators and acute phase reactants can act as biomarkers for ACS. In the present study, logistic regression analysis showed that plasma apoO level was an independent predictor of ACS. However, because of the limited samples, the predictive value of apoO as a biomarker for ACS and its potential functional role in plaque progression, instability, and rupture is to be further investigated.
In conclusion, using the dot-blot analysis system we developed, we detected plasma apoO concentration for the first time, and found that plasma apoO concentration was significantly increased and positively correlated with hs-CRP in ACS patients. However, no significant correlation between apoO and other lipid parameters was observed. These findings suggest that apoO might be regarded as an independent inflammatory predictor of ACS patients despite the precise functional importance of apoO remaining to be determined.
Footnotes
Abbreviations:
- ACS
- acute coronary syndrome
- CAD
- coronary artery disease
- CV
- coefficient of variation
- FPLC
- fast protein liquid chromatography
- hs-CRP
- high-sensitive C-reactive protein
- MAb
- monoclonal antibody
This study is supported by a grant from the National Natural Science Foundation of China (NSCF), Grant No: 81000123 (B-l.Y).
REFERENCES
- 1.Mineo C., Yuhanna I. S., Quon M. J., Shaul P. W. 2003. High density lipoprotein induced endothelial nitric-oxide synthase activation is mediated by Akt and MAP kinases. J. Biol. Chem. 278: 9142–9149. [DOI] [PubMed] [Google Scholar]
- 2.Mackness M. I., Durrington P. N. 1995. HDL, its enzymes and its potential to influence lipid peroxidation. Atherosclerosis. 115: 243–253. [DOI] [PubMed] [Google Scholar]
- 3.Yu B. L., Wang S. H., Peng D. Q., Zhao S. P. 2010. HDL and immunomodulation: an emerging role of HDL against atherosclerosis. Immunol. Cell Biol. 88: 285–290. [DOI] [PubMed] [Google Scholar]
- 4.Norata G. D., Pirillo A., Catapano A. L. 2011. HDLs, immunity, and atherosclerosis. Curr. Opin. Lipidol. 22: 410–416. [DOI] [PubMed] [Google Scholar]
- 5.Vaisar T., Pennathur S., Green P. S., Gharib S. A., Hoofnagle A. N., Cheung M. C., Byun J., Vuletic S., Kassim S., Singh P., et al. 2007. Shotgun proteomics implicates protease inhibition and complement activation in the antiinflammatory properties of HDL. J. Clin. Invest. 117: 746–756. [DOI] [PMC free article] [PubMed] [Google Scholar]
- 6.Lamant M., Smih F., Harmancey R., Philip-Couderc P., Pathak A., Roncalli J., Galinier M., Collet X., Massabuau P., Senard J. M., et al. 2006. ApoO, a novel apolipoprotein, is an original glycoprotein up-regulated by diabetes in human heart. J. Biol. Chem. 281: 36289–36302. [DOI] [PubMed] [Google Scholar]
- 7.Nijstad N., de Boer J. F., Lagor W. R., Toelle M., Usher D., Annema W., der Giet M., Rader D. J., Tietge U. J. 2011. Overexpression of apolipoprotein O does not impact on plasma HDL levels or functionality in human apolipoprotein A-I transgenic mice. Biochim. Biophys. Acta. 1811: 294–299. [DOI] [PubMed] [Google Scholar]
- 8.Pitt B., Loscalzo J., Ycas J., Raichlen J. S. 2008. Lipid levels after acute coronary syndromes. J. Am. Coll. Cardiol. 51: 1440–1445. [DOI] [PubMed] [Google Scholar]
- 9.Miller M. 2008. Lipid levels in the post-acute coronary syndrome setting: destabilizing another myth? J. Am. Coll. Cardiol. 51: 1446–1447. [DOI] [PubMed] [Google Scholar]
- 10.Perroud N., Uher R., Ng M. Y., Guipponi M., Hauser J., Henigsberg N., Maier W., Mors O., Gennarelli M., Rietschel M., et al. 2012. Genome-wide association study of increasing suicidal ideation during antidepressant treatment in the GENDEP project. Pharmacogenomics J. 12: 68–77. [DOI] [PubMed] [Google Scholar]
- 11.Carter A. M. 2005. Inflammation, thrombosis and acute coronary syndromes. Diab. Vasc. Dis. Res. 2: 113–121. [DOI] [PubMed] [Google Scholar]
- 12.Armstrong E. J., Morrow D. A., Sabatine M. S. 2006. Inflammatory biomarkers in acute coronary syndromes: part II: acute-phase reactants and biomarkers of endothelial cell activation. Circulation. 113: e152–e155. [DOI] [PubMed] [Google Scholar]
- 13.Khovidhunkit W., Duchateau P. N., Medzihradszky K. F., Moser A. H., Naya-Vigne J., Shigenaga J. K., Kane J. P., Grunfeld C., Feingold K. R. 2004. Apolipoproteins A-IV and A-V are acute-phase proteins in mouse HDL. Atherosclerosis. 176: 37–44. [DOI] [PubMed] [Google Scholar]
- 14.Huang X. S., Zhao S. P., Zhang Q., Bai L., Hu M. 2009. Association of plasma apolipoprotein AV with lipid profiles in patients with acute coronary syndrome. Atherosclerosis. 204: e99–e102. [DOI] [PubMed] [Google Scholar]


