

Abstract
The biological hypothesis that the atrocyte-secreted cytokine, interleukin-6 (IL6), stimulates differentiation of adult rat hippocampal progenitor cells (AHPCs) is considered from a mathematical perspective. The proposed mathematical model includes two different mechanisms for stimulation and is based on mass-action kinetics. Both biological mechanisms involve sequential binding, with one pathway solely utilizing surface receptors while the other pathway also involves soluble receptors. Choosing biologically-reasonable values for parameters, simulations of the mathematical model show good agreement with experimental results. A global sensitivity analysis is also conducted to determine both the most influential and non-influential parameters on cellular differentiation, providing additional insights into the biological mechanisms.
Keywords: Receptor Kinetics, Interleukin-6 (IL6), Adult Hippocampal Progenitor Cells (AHPC), Cellular Differentiation, Extended Fourier Amplitude Sensitivity Test (eFAST)
1. Introduction
Adult neural stem and progenitor cells hold great promise for the possible repair of the damaged and diseased nervous system due to their potential to proliferate and to differentiate into neurons and glial cells (oligodendrocytes and astrocytes) [3, 12, 54]. It is due to this potential that we would like to better understand the mechanisms of selective differentiation of these cells into neurons. Previous in vitro research on adult rat hippocampal progenitor cells (AHPCs) has shown that neural progenitor cells are responsive to molecular cues provided by astroytes [2, 50, 52]. Among these cues is the secreted cytokine interleukin-6 (IL6). In this manuscript we focus on the construction and analysis of a mathematical model for a set of in vitro experiments related to hippocampal neurogenesis [37, 38, 41]. The biological experiments simulated in this manuscript explored various mechanisms of communication between AHPCs and hippocampal astrocytes. We derive a system of ordinary differential equations for known IL6 signaling mechanisms and demonstrate that they are sufficient to explain many of these recently reported biological results.
The production of new neurons is principally localized to two regions of the mammalian brain: the subventricular zone [1] and the dentate gyrus of the hippocampus [11]. Adult neural progenitor cells residing in these neurogenic regions, along with the local cellular and molecular components, comprise a “neural stem cell niche”. Cellular components of the hippocampal neurogenic niche include the adult progenitor cells, astrocytes, neurons and endothelial cells residing within the dentate gyrus. These species form a unique cellular environment that controls hippocampal neurogenesis. The interactions of these hippocampal astrocytes with the adult neural progenitor cells is crucial for neurogenesis [50, 52]. They produce signals that promote proliferation, neuronal differentiation, and stimulate synaptogenesis of newborn neurons [2, 52]. Furthermore, astrocytes from non-neurogenic regions do not promote neurogenesis, suggesting that regional specific differences in astrocyte populations provide a means to generate unique sets of signals that are important for maintaining neurogenesis [2, 52].
Recent in vitro studies using AHPCs have helped provide a better understanding of the role of astrocytes in adult hippocampal neurogenesis. AHPCs are self-renewing, multipotent neural progenitors that have the ability to differentiate into both neurons and glial cells. The experiments performed by Recknor et.al. [41] and Oh et.al. [37, 38] examined various mechanisms of communication between AHPCs and hippocampal astrocytes. Four of these experimental conditions are summarized in Table 1. Each experiment involved cells seeded on a laminin-coated micropatterned polymer substrate where one half of the plate was smooth and the other half etched with parallel grooves. The first table entry shows the results of a control experiment with AHPCs cultured alone on the laminin, demonstrating a certain level of astrocyte-independent (background) differentiation. The second shows those of a contact co-culture where astrocytes were plated on the laminin and AHPCs were applied to the astrocytes. This experiment demonstrated that co-culture facilitates selective neuronal differentiation of AHPCs, possibly involving cell-cell and/or cell-extracellular matrix interactions in addition to soluble factors. This spatial and temporal control for selectively enhancing neuronal differentiation is commonly observed in neuronal development [7, 39]. The third shows results from a noncontact co-culture where AHPCs were plated on the laminin with a Transwell semi-porous membrane insert separating AHPCs from astrocytes. The membrane allowed communication by soluble factors but prevented direct contact. Neuronal differentiation was dramatically increased above contact co-culture levels, indicating the importance of soluble factors in neuronal differentiation. The last entry corresponds to a conditioned-media experiment where AHPCs were plated on the laminin and astrocytes were cultured separately. Every 24 hours the media from the astrocyte culture was fed to the AHPC culture, allowing the transfer of secreted molecules but preventing communication between the cell types. The results presented in Table 1 show the percentage of AHPCs expressing TUJ1 (class III β-tubulin) after 6 days. TUJ1 is an early neuronal marker indicating that these cells have begun to differentiate into neurons.
Table 1.
Percent observed differentiation (TUJ1 expression)
| Experiment | AHPC cells only (contol) | AHPC+Astrocyte in contact (co-culture) | AHPC+Astrocyte in non contact (co-culture) | AHPC in Astrocyte secreted media (conditioned) |
|---|---|---|---|---|
| Patterned | 16% | 35% | 75% | 38% |
| Non patterned | 17% | 20% | 73% | 41% |
Efforts have been made to identify the potential soluble factors responsible for the selective neuronal differentiation of AHPCs. One molecule of interest that has been identified is the cytokine interleukin-6 (IL6) [2, 37, 38, 41, 52]. IL6 has been found to have a myriad of biological functions [14]. For example, it is involved in modulating both hematopoiesis and immune function [24]. It also appears to be important for the central nervous system (CNS) response during injury and disease [42]. During CNS development IL6 may play an important role in regulating neurogenesis [35], cell survival [57], process outgrowth [21], synaptogenesis [17, 59] and astrocyte function [32]. Studies have shown that IL6 was expressed at higher levels in astrocytes from regions of the brain (newborn and adult hippocampus, and newborn spinal cord astrocytes) supportive of neurogenesis [2] and that IL6 could promote differentiation of hippocampal neural progenitor cells into neurons [2, 38].
In this paper the hypothesis that astrocyte-secreted IL6 stimulates differentiation of the AHPCs is considered. A mathematical model is proposed that includes two different biological mechanisms for this stimulation. One utilizes ligand binding to surface receptors on an AHPC, while the other involves binding to soluble extracellular receptors. The model is based on reaction kinetics and is described in Section 2. Section 3.1 compares simulation results with experimental results. Choosing biologically-reasonable values for parameters, simulations with the model show good agreement with experimental results, indicating that an IL6-mediated mechanism is sufficient in explaining many experimental results. Moreover, the simulations suggest that (1) in the absence of direct contact, the secretion rates of IL6 and its soluble receptor sIL6Rα from hippocampal astrocytes are not altered through the action of soluble paracrine factors communicating between the astrocytes and AHPCs; (2) the surface IL6 receptor is a limiting factor in the surface receptor pathway, in that saturating these receptors results in only 35% differentiation over a six day period; (3) contact between astrocytes and AHPCs likely alters TUJ1 expression via mechanisms more complex than simply inducing a decrease in the expression of mRNA for, or the secretion rate of, IL6 and its soluble receptor sIL6Rα. All simulations for time course data in this manuscript were performed in Fortran 90 using the Classical Fourth Order Runge Kutta Method, with the corresponding graphics generated in Matlab.
It is well-known that one of the most challenging features of molecular biological modeling lies in determining parameter values. Some of the values used in the simulations were found in the literature, but not all. To identify both the most influential and non-influential parameters in the model as measured by their effect on the specific output of interest, namely the percentage of differentiated cells after six days, a detailed sensitivity analysis was conducted. The results are reported in Section 3.2 and show that many of the most influential parameters, causing the highest amount of uncertainty, are recorded in the literature. However, some of the most influential unknown parameters are involved with the production or decay of an as yet undetermined intracellular differentiation factor that results from a hypothesized signaling cascade, and as such the intracellular mechanism leading to differentiation should be studied in more detail.
Both signaling pathways involve the surface transmembrane receptor gp130. This is a common receptor used in many signaling mechanisms [13]. A soluble analog of this receptor, sgp130, has the potential to inhibit these mechanisms when they utilize soluble receptors. One surprising result of the sensitivity analysis is that this biological inhibitor does not significantly affect the level of differentiation occurring via these IL6 mechanisms over a six day period, when it is present at biologically reasonable values. This is a testable hypothesis and will be an area of future research.
2. Methods
2.1. Derivation of the Model System
Differentiation is a multistep process, initiated by an initial progenitor cell, whereby subsequent generations of cells become more highly specialized as the lineage traverses a differentiation pathway. This process entails the expression of proteins and the exhibiting of behaviors common to the fully-differentiated cell-type. Mathematical models of differentiation typically include many species, representing stem cells, various forms of partially differentiated cells, and the fully-differentiated cell-type [9, 27, 30, 53]. The proliferative behavior of cells in one of the partially-differentiated states may be under the influence of feedback regulation by cells at other positions of the differentiation pathway. Some models simplify this framework with a three species model, substituting one transit-amplifying (TA) stage to represent partially-differentiated cells. These models commonly incorporate an age structure to the TA stage to represent the passage through multiple stages [4, 10, 22, 28, 56]. In our model, we are concerned solely with the initiation of differentiation and therefore only include two species: the initial progenitor cells and TUJ1-expressing cells. TUJ1 is an early neuronal marker, indicating that the cell has begun to differentiate.
In the cell culture systems under consideration it is hypothesized that the cytokine IL6, secreted by astrocytes, stimulates differentiation of the AHPCs. The hypothesized IL6 intercellular signaling pathway [16, 23, 25, 32, 40, 55] utilizes sequential binding to two receptors. First IL6 undergoes a low affinity binding to an IL6 receptor forming a complex. This complex then undergoes a high affinity binding to a glycoprotein 130 receptor homodimer (gp130). This can occur through two related pathways. One pathway utilizes ligand binding to surface receptors on the AHPC, while the other pathway involves binding to an extracellular soluble receptor. In both cases a tetrameric complex is formed by the high affinity binding to a gp130 receptor on the cell surface, which activates a signal transduction cascade in the target cell that utilizes cytosolic signaling molecules [25], for example a JAK/STAT signal transduction cascade.
The proposed model involves both chemical and cellular entities which are summarized in Table 2. All of the soluble chemical concentrations have units of nmol/mL, the concentrations of surface receptors and intracellular molecules have units of nmol/cell, and the cell densities have units of cells/cm2. The IL6 mechanism is illustrated in the “wiring diagram” in Figure 1. Following the surface receptor pathway in the diagram, IL6 (Ai) first binds to an IL6 receptor ( ) on the surface of an AHPC, forming the complex As. This complex then binds to the surface gp130 homodimer ( ), initiating a signal transduction cascade. This cascade leads to the production of the intracellular molecule J whose existence is hypothesized. In accordance with their biological activities, Ai may be called “inactive IL6” and As “surface (activated) IL6”. These reactions can be summarized as
| (1) |
Following the soluble receptor pathway in the diagram, IL6 (Ai) first binds to the soluble IL6 receptor (Ril). This soluble receptor corresponds to the extracellular domain of the IL6 surface receptor. It can be formed either by cleaving off the extracellular portion of the surface receptor, or via alternative splicing of the mRNA for [29, 32, 36]. The soluble complex Aa, formed by the binding of IL6 with the soluble receptor, can be referred to as “activated IL6” since it can bind directly to , initiating the signal transduction cascade producing J. These reactions can be summarized as
| (2) |
Competitive inhibition of the soluble receptor pathway can occur through the reaction
| (3) |
in which the activated IL6 (Aa) binds to the soluble form of the gp130 receptor (Gp), forming the complex Ao. Ao can be termed “inhibited IL6” since it is not bound to the cell membrane and hence cannot initiate an intracellular signal transduction cascade. However, Gp is not an antagonist to the surface receptor pathway as steric hinderance prevents Gp from associating with As [23]. The soluble gp130 receptor can be formed in a similar fashion as the soluble receptor Ril [8, 23, 32]. The kinetics of the above reactions lead to a system of eleven differential equations for the nine chemical species given in Table 2 and the two tetrameric complexes , . This system, which is derived via mass action kinetics and recorded in Appendix A, is augmented and modified as follows.
Table 2.
Variables and their definitions
| Species | Chemical Abbreviation | Concentration/Density |
|---|---|---|
| interleukin-6 | IL6 | [Ai] |
| soluble IL6 receptor | sIL6Rα | [Ril] |
| IL6 ligand-soluble receptor complex | {IL6:sIL6Rα} | [Aa] |
| soluble glycoprotein-130 | sgp130 | [Gp] |
| IL6, sIL6Rα, sgp130 trimeric complex | {IL6:sIL6α:sgp130} | [Ao] |
| surface IL6 receptor on AHPC | IL6R | [ ] |
| IL6 ligand-surface receptor complex | {IL6:IL6R} | [As] |
| transmembrane glycoprotein-130 on AHPC | gp130 | [ ] |
| IL6-induced signal transduction product | [J] | |
| progenitor cell | AHPC | Np |
| TUJ1 expressing cell | Nd | |
| astrocyte | Na |
Figure 1.
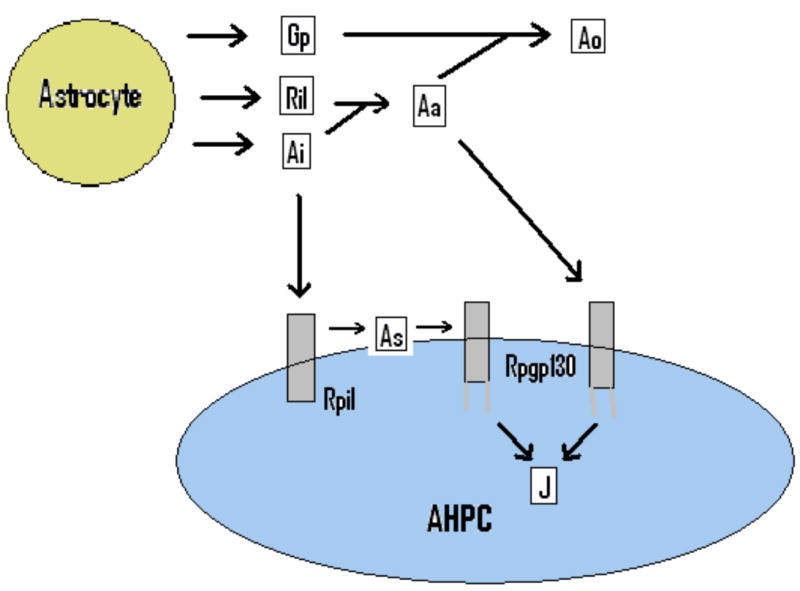
Schematic of hypothesized cellular communication through an IL6 mechanism.
Hippocampal astrocytes have been shown experimentally to secrete IL6 [2, 38]. In this model it is hypothesized that astrocytes also secrete the two soluble receptors sIL6Rα and sgp130. The production and degradation of the soluble proteins, along with the degradation of the intracellular molecule J, are assumed to satisfy the rate laws
| (4) |
where Na denotes the density of astrocytes and Sai(t), Sil(t), Saa(t), Sgp(t), and Sao(t) are possible source terms. The astrocyte density Na and the source functions Sz(t) are chosen according to experimental conditions. For example, if there are no astrocytes present (as in the control experiment or in the conditioned media experiment), then Na = 0. In the latter of these two cases, the source functions would be used to model the daily treatment of astrocyte conditioned medium. For example, they could be written as
| (5) |
where are the times at which the astrocyte-conditioned medium is introduced into the culture, with Z0 being the concentration of the protein Z present in the conditioned medium. This is the only experiment in which the source functions Sil(t), Saa(t), Sgp(t), and Sao(t) are taken to be not identically zero. Sai(t) will be nonzero for both the conditioned media experiment and the IL6 dose-response experiments which were conducted in [38] to determine certain parameters in the model, as described in Section 3 and illustrated in Table 3.
Table 3.
Percent observed differentiation (TUJ1 expression) in IL6 Dose-Response Experiments
| IL6 added (ng/mL) | 0 | .00001 | .0001 | .001 | .01 | .1 | 1 | 10 | 100 |
|---|---|---|---|---|---|---|---|---|---|
| Experimental(%) | 19 | 20 | 20 | 27 | 25 | 31 | 37 | 35 | 36 |
| Simulation(%) | 19.2 | 19.2 | 19.3 | 20.3 | 24.0 | 29.4 | 35.1 | 36.8 | 36.9 |
It is hypothesized within this simplified mechanism that the initiation of differentiation of the AHPC is a direct response to the concentration of J, an intracellular molecule produced in response to the IL6 signaling mechanism. A more thorough accounting of the cytosolic mechanism is presented in [51] for the case where the target cell is a hepatocyte. This system incorporates both JAK/STAT and MAPK pathways, potentially with cross-talk, both initiated by IL6 signaling. However, as our system is neuronal, it is unknown whether this system incorporates JAK/STAT, MAPK, or both. Since our manuscript focuses on the extracellular interactions, we use a simplifying approximation where the IL6 signaling results in the production of an intracellular differentiation factor J. These models are complementary in that they may be combined to potentially gain a more complete understanding of the mechanism, provided the validity of employing the hepatocyte system.
The function governing the rate of IL6-induced differentiation is taken here to be sigmoidal under the assumption that a certain threshold of J must be reached to have any appreciable level of differentiation and that there is a maximal rate at which AHPCs differentiate. Thus the rate of differentiation of an AHPC is taken to be for some empirically determined constants κ1 and κ2. However, since J is produced through the IL6 mechanism alone in this mathematical model, but differentiation occurred during the control experiment where there were no astrocytes present to produce IL6, a certain level of background differentiation must be included. The rate of background differentiation is taken to be proportional to the density of progenitor cells. Finally, since the experimental conditions we are attempting to simulate were in vitro experiments performed on a 1 cm2 plate, we include a standard logistic growth term with carrying capacity Nmax to account for resource limitations on the proliferation of progenitor cells.
As part of our modeling strategy we assume that surface receptors act in a fashion similar to enzymes in that they take a substrate (IL6) and convert it to a product (J). Numerical simulations indicate that the concentrations of the surface receptor complexes [ ], [As], and [ ] quickly come to equilibrium with the other species in the system. In accordance with the Michaelis-Menten hypothesis (see Appendix B for more details), we assume that the time rates of change of these complexes are small,
Superimposing all of the above effects, and adding two equations for cell dynamics, yields our model system for IL6-induced differentiation of AHPCs:
| (6) |
with AHPC receptor concentrations given by
| (7) |
where
| (8) |
Recall that [J] is measured in units of nmol/cell. The appearance of the logistic term in the equation for [J] is a consequence of its division among daughter cells during proliferation. The role of proliferation in this regard is discussed in Appendix B. Initial conditions must accompany this system. Under the assumption that there are no cytokines present initially, and that the only cell population present initially are the undifferentiated AHPCs (and possibly astrocytes), the initial conditions are taken to be
| (9) |
2.2. Notes on Spatial Considerations
The biological experiments occurred on two different configurations of the same substrate. The substrates were designed such that one-half of the polystyrene surface was smooth (or nonpatterned), and the other half was patterned with parallel grooves etched into the plate [37, 41]. These polystyrene substrates were then coated with the extracellular matrix molecule laminin. The laminin serves to facilitate cellular adhesion to the polystyrene surface.
For simulations of the experiments performed on the nonpatterned half of the substrate, a spatial model would consider activity over a two-dimensional region [0, Lx] × [0, Ly]. However, it can be claimed that use of a purely kinetic model will suffice due to the spatial homogeneity of all species involved. In each experiment, AHPCs were plated uniformly and astrocyte density was either uniform or nonexistent. It had been observed that there was little to no movement of the cell bodies of either the AHPCs or the astrocytes during these experiments. All molecules present on the nonpatterned substrate were therefore either added uniformly by adding homogeneous cultured media to the system, or they were secreted by the astrocytes which were present in a uniform density, again causing the addition of chemicals to be uniform.
Now consider the simulations of the experiments performed on the patterned half of the substrate. When astrocytes were not present on the substrate (i.e. all but the contact co-culture experiment), all chemicals were again added to the system uniformly as described above. Moreover, there was little to no cell movement occurring. Hence the uniform layer of AH-PCs plated on the substrate remained uniform. By the same reasoning as in the smooth substrate experiments, it can be argued that the kinetic model will suffice for the analysis. Note also that for the experimental data in Table 1, the same percentage of cells differentiated regardless of whether the experiments occurred on the patterned or nonpatterned substrate.
This reasoning no longer holds for the contact co-culture on the patterned substrate due to a possible heterogeneous component. In this experiment, a uniform layer of astrocytes was applied to the laminin at a density of 1.5 × 10⁴ cells/cm2 and cultured for two days. After this period of time it was found that the astrocytes aggregated in the grooved regions, roughly forming a monolayer over the substrate. The AHPCs were then plated above the astrocytes in direct contact with them. Hence AHPCs in some regions were possibly exposed to different concentrations of active molecules than AHPCs in other regions. However, the diffusion of the soluble molecules during the numerical simulations of the corresponding spatial model occurred at such a rate that their concentrations appeared to be roughly uniform for all time. Since there was no directed cellular movement occurring we considered the corresponding kinetic model, which produced identical results.
2.3. Parameters Determining the Rate of Differentiation
There are three parameters in the model that determine the rate of differentiation: ε, κ1, and κ2. The rate of background differentiation is represented by ε, and the parameters κ1 and κ2 determine the sigmoidal response to the intracellular molecule J. In the control experiment a monolayer of AHPCs was applied to the laminin-coated substrate at a density of 1.5 × 10⁴ cells/cm2. No astrocytes were added to the system. There was no IL6 entering this system as the AHPCs produce little IL6 [38], so the only differentiation occurring was due to the background mechanism. The system of ODEs in this case reduces to
| (10) |
with initial conditions Np(0) = 1.5 × 10⁴ and Nd(0) = 0. A value in the literature [34] was available for the cell growth parameter, M1 = .0213 hr−1. To fit the experimental data, the coefficient governing background differentiation was chosen as ε = .0026 hr−1. This choice of ε results in 19.2% of the cells expressing TUJ1. The time course simulation is shown in Figure 2.
Figure 2.
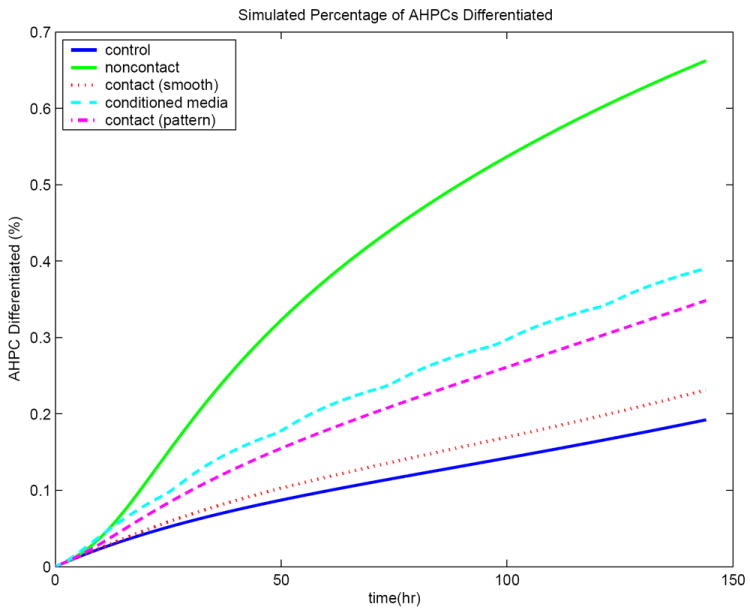
Simulation results for the mathematical model. Illustrated here is the percentage of cells expressing TUJ1 over a six day period for the control experiment, noncontact co-culture experiment, conditioned media experiment, contact co-culture on the nonpatterned substrate, and contact co-culture on the patterned substrate.
To determine the parameters κ1 and κ2, a set of IL6 dose-response experiments were performed [38]. In these experiments, AHPCs were cultured on a laminin coated substrate in the absence of astrocytes. However, fresh media containing various concentrations of IL6 was added every 48 hours for six days. A significant increase in the percentage of AHPCs expressing TUJ1 was observed for the experiments where IL6 was added at concentrations at or greater than 0.1 ng/mL. Furthermore, the effect of IL6 was specific for neuronal differentiation (TUJ1) as no change in glial cell differentiation was observed under these conditions. The responses to each of the experimental concentrations are given in the second row of Table 3.
In these experiments differentiation was only occurring via the surface receptor pathway and the background mechanism. The system of ODEs describing this situation is given by
| (11) |
with initial conditions [Ai]0 = 0, [J]0 = 0, Np(0) = 1.5 × 10⁴, Nd(0) = 0, and receptor concentrations
| (12) |
where
| (13) |
with L, L̂, K̂, and η defined in (8).
Given a choice of the constants κ1 and κ2 and a treatment concentration of 10−6+ing/mL for some i ∈ {1, …, 8}, a simulation of the above system produces a value that is the simulated percentage of differentiated cells after six days. Let denote the percentage of differentiated cells after six days determined experimentally, with the same treatment level. Using a least-squares approach an optimum pair {κ1, κ2} was sought that would minimize
| (14) |
over an appropriate set Ωκ of values for κ1 and κ2. Using a trial and error approach an initial point (κ1, κ2) ∈ Ωκ was found with the aid of the modeling program Berkeley Madonna. This initial point was then refined by using the Metropolis algorithm [43]. Since the dependence on (κ1, κ2) is nonlinear this approach was used to avoid becoming trapped near a local minimum of ε(κ1, κ2). Briefly described, a direction of movement from the current estimate of a minimizer (κ1, κ2) is chosen randomly and a new estimate of a minimizer ( ) is generated by a move in that direction. If the new estimate is accepted, otherwise it is accepted with probability for some predetermined u ∈ (0, 1). Thus choices that move “up hill” are sometimes accepted. The optimizing values of {κ1, κ2} found in this way produced the simulation results recorded in the last row of Table 3, and are given in Table 4.
Table 4.
Table of Constants
| Parameter | Description | Value | Comments | ||
|---|---|---|---|---|---|
| Ld, ℓ−;1, ℓ1 | Binding of inactivated IL6 Ai to soluble IL6 receptor Ril | ||||
| Ld | 30 nM | [49] | |||
| ℓ−1 | 5 hr−1 | [18] | |||
| ℓ1 |
|
calc. | |||
| Kd, k−1, k1 | Binding of active IL6 Aa to soluble gp130 receptor Gp | ||||
| Kd | 3 nM | [49] | |||
| k−1 | 5 hr−1 | sim. | |||
| k1 |
|
calc. | |||
| , , k̂1 | Binding of inactivated IL6 Ai to surface IL6 receptor | ||||
|
|
100 pM | [49] | |||
|
|
500 hr−1 | sim. | |||
| k̂1 |
|
calc. | |||
| , , ℓ̂1, ℓ̂2 | Binding of surface complex to surface gp130 receptor | ||||
|
|
10 pM | [49] | |||
|
|
5 hr−1 | sim. | |||
| ℓ̂1 |
|
calc. | |||
| ℓ̂2 | .002 hr−1 | sim. | |||
| Vm, ν−1, ν1, ν2 | Binding of active IL6 Aa to surface gp130 receptor | ||||
| Vm | 60 pM | [49] | |||
| ν−1 | 5 hr−1 | sim. | |||
| ν1 |
|
calc. | |||
| ν2 | .5 hr−1 | sim. | |||
| μai | decay of IL6 | .173 hr−1 | [26] | ||
| μil | decay of sIL6Rα | .173 hr−1 | sim. | ||
| μaa | decay of activated IL6 | .173 hr−1 | sim. | ||
| μgp | decay of sgp130 | .173 hr−1 | sim. | ||
| μao | decay of inhibited IL6 | .173 hr−1 | sim. | ||
| μj | decay of differentiation factor | .173 hr−1 | sim. | ||
| a1 | IL6 secretion rate |
|
[38] | ||
| ba | sIL6Rα secretion rate |
|
sim. | ||
| sa | sgp130 secretion rate |
|
sim. | ||
|
|
density of IL6 receptors on AHPC |
|
sim. | ||
|
|
density of gp130 receptors on AHPC |
|
sim. | ||
| M1 | cell growth parameter | .0213hr−1 | [34] | ||
| Nmax | carrying capacity |
|
calc. | ||
| ε | differentiation parameter | .0026hr−1 | |||
| κ1 | differentiation parameter | 2.5hr−1 | |||
| κ2 | differentiation parameter |
|
calc. = calculated value (Appendix D), sim. = simulation value
Time course simulations for (11-13) are shown in Figure 3. The time course of the concentration of occupied IL6 surface receptors, given by , in comparison to the total concentration of IL6 surface receptors, given by , is shown in Figure 4. This figure illustrates that the receptors are saturating as the concentration of available IL6 increases, resulting in the plateau effect observed in Table 3.
Figure 3.
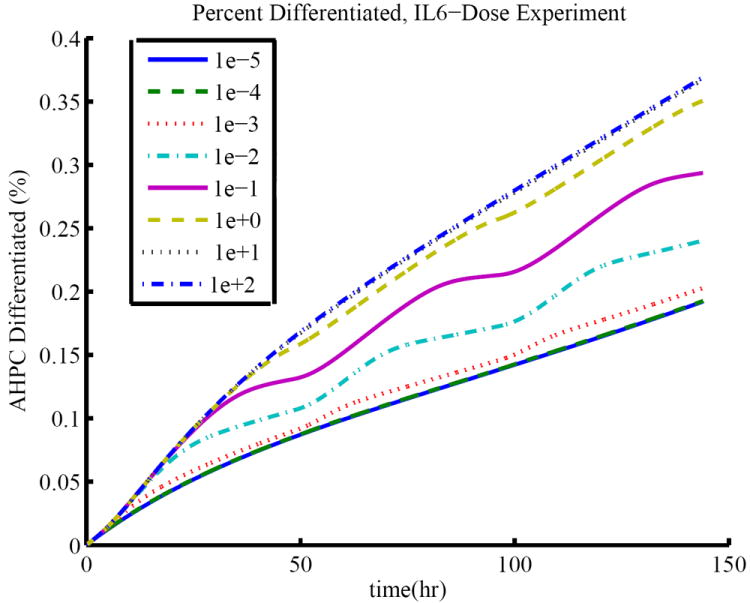
Percentage of cells expressing TUJ1 over a six day period for the IL6 dose-response experiments. The lowest curve represents the time course for a treatment of media containing 10−5 ng/mL IL6 added every 48 hours. The top curve represents the time course for a treatment of media containing 102 ng/mL IL6 added every 48 hours. Note that some curves overlap.
Figure 4.
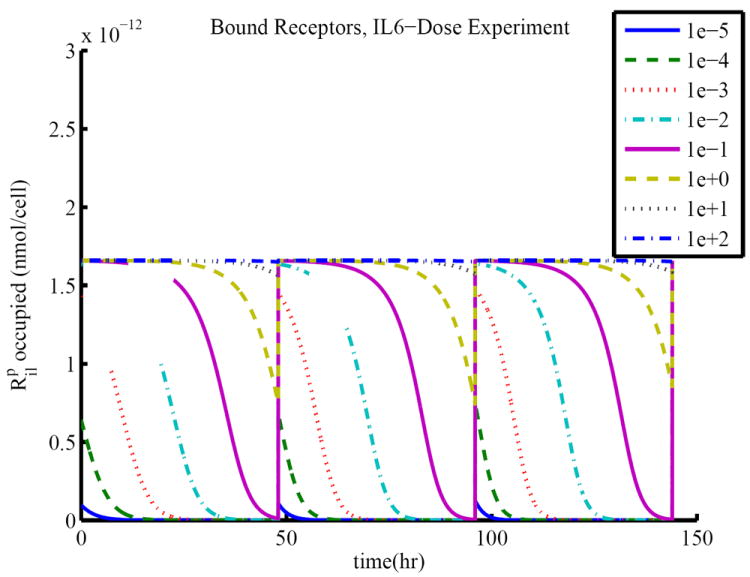
Time course of the concentration of bound receptors in the IL6 dose-response experiments. The concentration of occupied receptors approaches a maximal value as the treatment approaches 102 nmol/mL. This maximal value corresponds to saturation of receptors.
3. Results and Discussion
3.1. Comparison to Experimental Results
3.1.1. Noncontact Co-culture
In this experiment, a uniform layer of AHPCs was applied to the laminin at a density of 1.5 × 10⁴cells/cm2. A uniform layer of astrocytes, also at a density of 1.5 × 10⁴cells/cm2, was held above the AHPCs in an insert that allowed diffusion of most molecules but prevented direct contact between AHPCs and astrocytes. IL6 signaling could occur through both pathways. The surface receptor pathway was seen earlier to be limited by . However, the soluble receptor pathway does not use . The time course simulation is shown in Figure 2. The percentage of cells that have differentiated after six days is found to be 66.3% from the simulation. This is a similar increase from the control as is seen experimentally, where 73-75% of cells differentiated.
3.1.2. Conditioned Media
In this experiment, a uniform layer of AHPCs was applied to the laminin at a density of 1.5 × 10⁴cells/cm2. Astrocytes, also at a density of 1.5 × 10⁴cells/cm2, were cultured separately. Every 24 hours the media from the astrocyte culture, now containing astrocyte-secreted factors, was removed and added to the AHPC culture. The concentrations of soluble factors in this astrocyte-conditioned media are given by the solution of
| (15) |
with initial conditions [Ai]0 = [Aa]0 = [Ao]0 = [Ril]0 = [Gp]0 = 0. Using the same secretion rates as for the noncontact co-culture, the simulation results in 39% of the cells expressing TUJ1. This is a similar decrease from the noncontact co-culture as is seen experimentally, where 38-41% of cells differentiated. One explanation for this result is that there are no soluble paracrine factors communicating between the astrocytes and AHPCs that affect the secretion rates for the active proteins Ai, Ril, and Gp by any appreciable amount. The time course simulation is shown in Figure 2.
3.1.3. Contact Co-culture – Smooth Substrate
A uniform layer of astrocytes was applied to the laminin on the nonpatterned substrate at a density of 1.5 × 10⁴cells/cm2 and cultured for two days. A uniform layer of AHPCs was then applied to the astrocytes at a density of 1.5 × 10⁴cells/cm2. This experiment differed from the noncontact co-culture experiment only in that the AHPCs and astrocytes were in direct contact. This direct cell-cell contact may include binding by cadherins or other cell adhesion molecules (CAM) on the surface of these cells.
The AHPCs express a number of functional integrin receptor subunits [20]. Integrin binding has the potential to trigger a number of varied responses. Among these possible responses are: altered expression of mRNA for either soluble molecules or surface receptors, altered secretion of soluble molecules, regulation of an AHPC’s response to J, or even secretion of proteases for or . We do not claim to have identified the biological response to contact in this system. We instead examine whether altered secretion rates of the soluble molecules (a1, ba, and sa) are sufficient to simulate experimental results.
One may hypothesize that contact induces an increase in secretion of the inhibitor Gp, leading to decreased differentiation. However, it will be shown during the sensitivity analysis (Section 3.2) that varying the secretion rate of the inhibitor Gp within biologically reasonable ranges does not affect the level of differentiation. To determine how to vary the other two secretion rates, it is important to understand the biological behavior of this system. The experimental values for differentiation on smooth and patterned substrates were 20% and 35% respectively. These are approximately the same values as the minimum and maximum achieved during the IL6 dose-response experiments (Table 3). During those experiments, only the surface receptor pathway was active. Hence we set ba = 0. To achieve less than 23% differentiation on the smooth substrate via this mathematical model, the parameter a1 must then be reduced to less than . This is (1/200)th of the rate observed when astrocytes are not in contact with AHPCs. The time course simulation is shown in Figure 2. Note that if ba > 0, then a1 must be reduced by an even greater amount. Although a contact-dependent negative feedback mechanism may regulate the production of IL6 and sIL6Rα, the magnitude to which they must be decreased to simulate the biological behavior indicates that a more complicated mechanism may be involved.
3.1.4. Contact Co-culture – Patterned Substrate
To simulate the contact co-culture results on the nonpatterned substrate via decreased secretion rates, the rate of secretion of Ai must be set to less than (1/200)th of its noncontact rate while the secretion of Ril must be completely inhibited (ba = 0). Since this behavior occurred during direct contact, it could possibly be mediated by CAM or cadherin binding. On the patterned substrate, much of the astrocyte density was within the grooves. The area of the astrocytes accessible to the AHPCs was decreased relative to that available on the nonpatterned substrate. Therefore there would have been less binding, so it would be reasonable to assume that the secretion of Ai was not reduced as drastically on the patterned substrate. Figure 2 shows that if a1 is lowered to (1/20)th of its noncontact rate, then we can achieve approximately 35% differentiation after six days. Note however that since the soluble receptor pathway is inactive, the experimental result can be simulated without altering a1.
3.2. Global Sensitivity Analysis
The previous section illustrates the capability of an IL6-mediated mechanism to simulate recent experimental results, based on parameter values found in the literature and biologically reasonable values for those not found in the literature. In this section we examine the influence of variation in these parameters on the output of the mathematical model (the percentage of cells that have differentiated after six days). This is accomplished through a global sensitivity analysis whereby one varies multiple parameters simultaneously throughout specified parameter distributions. The goal is to identify both the most influential and non-influential parameters via their effects on the output.
The results of a global sensitivity analysis exhibit a dependence on both the model structure and the ranges of parameters chosen for the analysis. The structure of system (6-8) is consistent with basic mass action representations of the accepted biochemical interactions occuring between the secreted proteins, and has been shown to simulate all experimental behaviors under consideration. We therefore examine the sensitivity of the biochemical parameters in the context of this model structure. The parameters can be divided into five groups: decay rates, secretion rates, dissociation constants, kinetic rates, and receptor/cell densities. An exploration of the effects of parameter ranges on the results of the SA is performed through parameter variation within two separate parameter spaces. The first can be considered the “full” parameter space. It consists of wide ranges for each parameter, using either uniform or log uniform distributions, depending on the size of the interval. The intervals are determined through an analysis of values present in the literature. The second is a more local parameter space. It consists of varying each parameter with a normal distribution whose mean is it’s nominal value (those recorded in Table 4), with a standard deviation equal to one-sixth of it’s mean. Sensitivity coefficients are generated using the eFAST method [5, 6, 31, 44-48], which is summarized in Appendix C. The eFAST method allows one to decompose the variance in an output of interest among the k input parameters being varied. The main effect (Si) of parameter xi is the percentage of variance attributed solely to variations in xi, and the total effect (STi) is the percentage of variance attributed to variations in xi and its interactions with other parameters. Sensitivity indices which were found to be significantly different from a dummy parameter are listed in Tables 5-11 in the form Si/STi. Second-order interaction effects between parameters are examined [60] in an attempt to more completely understand the important influences within this model structure. Due to the myriad of interaction effects observed when varying all parameters simultaneously, we also perform partially-global analyses whereby we vary parameters within a specific group while holding all others at their nominal values.
Table 5.
eFAST results, varying decay rates:
| Parameter | Uni. Dist. | eFAST | Norm. Dist. | eFAST |
|---|---|---|---|---|
| dummy | U(.1155,.6931) | — | N(.173) | — |
| μai | U(.1155,.6931) | 3.81/9.08 | N(.173) | 16.80/19.78 |
| μil | U(.1155,.6931) | 3.52/8.39 | N(.173) | 17.06/19.93 |
| μaa | U(.1155,.6931) | 0.10/1.59 | N(.173) | — |
| μgp | U(.1155,.6931) | — | N(.173) | — |
| μao | U(.1155,.6931) | — | N(.173) | — |
| μj | U(.1155,.6931) | 86.22/91.92 | N(.173) | 61.97/64.34 |
Table 11.
eFAST results, varying all parameters:
| Parameter | Uni. Dist. | eFAST | Norm. Dist. | eFAST | |
|---|---|---|---|---|---|
| dummy | U(1,10) | — | N(1) | — | |
| ℓ−1 | LU(1e-3,1e+3) | 0.31/5.23 | N(5) | — | |
| Ld | LU(1e-6,1e-1) | 0.94/11.16 | N(30e-3) | 4.43/6.92 | |
| k−1 | LU(1e-3,1e+3) | —/1.57 | N(5) | — | |
| Kd | LU(1e-6,1e-1) | —/1.95 | N(3e-3) | — | |
|
|
LU(1e-3,1e+3) | 9.75/30.99 | N(500) | — | |
|
|
LU(1e-6,1e-1) | 12.30/35.25 | N(100e-6) | — | |
|
|
LU(1e-3,1e+3) | 1.67/11.28 | N(5) | — | |
| ℓ̂2 | LU(1e-3,1e+3) | 6.70/20.49 | N(.002) | 6.99/9.70 | |
|
|
LU(1e-6,1e-1) | 2.75/14.24 | N(10e-6) | — | |
| ν−1 | LU(1e-3,1e+3) | —/10.11 | N(5) | 0.07/— | |
| ν2 | LU(1e-3,1e+3) | 0.76/9.34 | N(.5) | 3.90/6.48 | |
| Vd | LU(1e-6,1e-1) | 7.27/23.65 | N(60e-6) | 5.64/8.52 | |
| a1 | LU(1e-12,1e-9) | 1.12/9.55 | N(1e-11) | 4.65/6.96 | |
| ba | LU(1e-12,1e-9) | —/7.85 | N(2e-10) | 4.20/6.35 | |
| sa | LU(1e-12,1e-9) | —/1.55 | N(1e-11) | — | |
| μai | U(.1155,.6931) | 0.24/2.65 | N(.173) | 4.12/6.16 | |
| μil | U(.1155,.6931) | —/2.12 | N(.173) | 6.15/9.05 | |
| μaa | U(.1155,.6931) | — | N(.173) | — | |
| μgp | U(.1155,.6931) | — | N(.173) | — | |
| μ ao | U(.1155,.6931) | — | N(.173) | — | |
| μj | U(.1155,.6931) | 0.69/4.39 | N(.173) | 19.81/23.30 | |
|
|
U(1e+2,1e+5) | 7.91/25.02 | N(1e+3) | 5.60/7.89 | |
|
|
U(1e+2,1e+5) | 7.65/20.80 | N(1e+5) | 5.80/8.86 | |
| Na | U(1e+4,1e+5) | 0.78/5.37 | N(3e+4) | 17.57/21.32 |
3.2.1. Decay Rates
In the analysis described in this subsection, the decay rates were varied simultaneously while all other parameters were kept constant at their nominal values. In the full parameter space, all decay rates were assigned a uniform pdf over [.1155, .6931] hr−1. This corresponds to varying the half-lives between values of 1 hour and 6 hours, a range consistent with values provided in [15, 26, 33]. In the more local parameter space, the decay rates were varied according to normal distributions with mean values of .173, corresponding to a half-life of 4 hours. eFAST sensitivity coefficients are presented in Table 5.
Three decay rates are found to have a significant influence on the output: μai, μil, and μj. The parameter μaa could also be suspected to also have a significant effect, however it appears to be negligible. In the full space, significant second order effects were detected for interactions between {μai, μil}, {μai, μj}, {μil, μj}, and {μaa, μj}, with the strongest effects detected for {μai, μj} and {μil, μj}. The only effect identified for the local parameter space was {μai, μil}, an interaction between the decay rates for the soluble molecules that bind to form activated IL6.
The most influential of these parameters is μj, the decay rate of the intracellular molecule that results in the differentiation of AHPCs. Most of the variance in the output can be attributed to this parameter. This is reasonable considering this molecule is directly involved with differentiation in this model. The parameters associated with the inhibitor sgp130, μgp and μao, do not appear to have a significant influence on the output.
3.2.2. Production Constants
This subsection describes the result of varying the secretion rates simultaneously. These are the rates at which astrocytes secrete IL6 (a1), sIL6Rα (ba), and sgp130 (sa). All other parameters were kept constant at their nominal values. In the full parameter space, all secretion rates were assigned a log uniform pdf over . A log uniform distribution was chosen to prevent undersampling of the region [1 × 10⁻¹², 1 × 10⁻¹¹], which is an area with a significant effect when tested around the nominal values. This range corresponds biologically to astrocytes secreting between 600 and 600,000 of each of these molecules per cell per hour, a range consistent with values provided in [19, 38]. In the more local parameter space, the secretion rates were varied according to normal distributions centered around their nominal values. eFAST sensitivity coefficients are presented in Table 6.
Table 6.
eFAST results, varying secretion rates:
| Parameter | Uni. Dist. | eFAST | Norm. Dist. | eFAST |
|---|---|---|---|---|
| dummy | LU(1e-12,1e-9) | — | N(1) | — |
| a1 | LU(1e-12,1e-9) | 41.16/59.90 | N(1e-11) | 48.81/51.83 |
| ba | LU(1e-12,1e-9) | 40.07/58.79 | N(2e-10) | 47.55/51.12 |
| sa | LU(1e-12,1e-9) | — | N(1e-11) | — |
Two secretion rates have a significant effect on output: a1 and ba. Both of these parameters appear to be equally influential, since equal percentages of the variance in output can be attributed to each. Significant second order effects were also detected for the interaction between these two production rates which is expected since the two molecules being produced bind to form activated IL6. The parameter for the secretion rate of the inhibitor sgp130, sa, does not appear to have a significant effect on the output.
3.2.3. Dissociation Constants
This subsection describes the result of varying the dissociation constants simultaneously. These parameters each determine the binding affinity between ligands and their respective receptors. The dissociation constant is a measure of how tightly they bind, and is approximately equal to the concentration of ligand at which half of the receptors are bound to the ligand and the other half remains unbound. Low values for the dissociation constant signify a tight binding, while higher values indicate that the ligand can more easily dissociate from its receptor. All other parameters were kept constant at their nominal values. In the full parameter space, all dissociation constants were assigned a log uniform pdf over [1 × 10⁻⁶, 1 × 10⁻¹] μM, a range that encompasses all values discussed in [49]. A log uniform distribution was chosen to establish an even sampling of all orders within this range since some of the dissociation constants have been found experimentally to be in the range of 10-100 pM, while others have been found to be 10-100 nM. In the more local parameter space, the dissociation constants were varied according to normal distributions centered around their nominal values. eFAST sensitivity coefficients are presented in Table 7.
Table 7.
eFAST results, varying dissociation constants:
| Parameter | Uni. Dist. | eFAST | Norm. Dist. | eFAST | |
|---|---|---|---|---|---|
| dummy | LU(1e-6,1e-1) | — | N(1) | — | |
| Ld | LU(1e-6,1e-1) | 22.00/45.64 | N(30e-3) | 48.05/52.57 | |
| Kd | LU(1e-6,1e-1) | — | N(3e-3) | — | |
|
|
LU(1e-6,1e-1) | 0.89/3.27 | N(100e-6) | — | |
|
|
LU(1e-6,1e-1) | 0.55/2.82 | N(10e-6) | — | |
| Vd | LU(1e-6,1e-1) | 49.69/73.66 | N(60e-6) | 47.02/50.50 |
Two dissociation constants were found to have a significant effect on output in both simulations: Ld and Vd. Ld governs the binding of IL6 to its soluble receptor sIL6Rα to form activated IL6. This activated IL6 binds to the gp130 receptor dimer on the AHPC to initiate signal transduction via the soluble receptor pathway, with this binding governed by the dissociation constant Vd. When varied with a normal distribution around their nominal values, both of these parameters appear to be equally influential since equal percentages of the variance in output can be attributed to each parameter. However, when varied over the wider log-uniform distribution, Vd appears to be more influential. In addition, over the log-uniform distribution and , the dissociation coefficients involved with the surface receptor pathway, appear to have a slightly significant effect on the output. However, much less of the variance in the output can be attributed to these parameters in comparison to Ld and Vd. The parameter interaction {Ld, Vd} was observed to be significant for both parameter spaces. Four other significant interactions were detected for the full parameter space: {Ld, }, {Ld, }, { , Vd}, and { , Vd}. Note that each of these second order effects incorporates one of the dissociation constants involved in the soluble receptor pathway.
Altering binding strength for the soluble receptor pathway causes much more variability in differentiation than altering binding strength for the surface receptor pathway. These results suggest that the soluble receptor pathway has a much stronger effect on the differentiation of AHPCs than the surface receptor pathway. The dissociation constant Kd, governing the binding of activated IL6 (Aa) to its inhibitor (sgp130), does not appear to have a significant effect on the output.
3.2.4. Kinetic Rates
This subsection describes studies in which the kinetic rates were varied simultaneously. These rates are measurements of how fast the reactions occur. For reversible reactions, kinetic rates appear in pairs; for example, ℓ1 is the rate for Ai binding to Ril to form the complex Aa, while ℓ−1 is the rate for the dissociation of Aa into its constituent parts Ai and Ril. They are related through the dissociation constant; for example, Ld = ℓ−1/ℓ1, or equivalently, ℓ−1 = Ldℓ1. Experimentally it is much easier to measure the dissociation constant than it is to measure these rates separately.
Since all other parameters were held constant at their nominal values, including the dissociation constants, only one rate constant from each pair was varied explicitly for the sensitivity analysis. Changing this one parameter had the effect of simultaneously changing the rate constant for the alternate direction due to the fixed dissociation constants. Therefore, in reality, these sensitivity coefficients are not necessarily measures of the sensitivity solely to those parameters in the table (ex. ℓ−1). Instead, it is a measure of the sensitivity to the pair of rate constants (ex. ℓ−1 and ℓ1). However, note that ℓ̂2 and ν2 are rates from irreversible reactions, and as such the sensitivity to each of these parameters is due solely to these parameters.
In the full parameter space, all kinetic rates were assigned a log uniform pdf over [1 × 10⁻³, 1 × 10+3] hr−1. A log uniform distribution was chosen to get an even sampling of all orders within this range. In the more local parameter space, the kinetic rates were varied according to normal distributions centered around their nominal values. eFAST sensitivity coefficients are presented in Table 8.
Table 8.
eFAST results, varying kinetic rates:
| Parameter | Uni. Dist. | eFAST | Norm. Dist. | eFAST | |
|---|---|---|---|---|---|
| dummy | LU(1e-3,1e+3) | — | N(1) | — | |
| ℓ−1 | LU(1e-3,1e+3) | 1.31/9.83 | N(5) | 0.13/— | |
| k−1 | LU(1e-3,1e+3) | — | N(5) | — | |
|
|
LU(1e-3,1e+3) | 58.99/76.78 | N(500) | — | |
|
|
LU(1e-3,1e+3) | —/0.66 | N(5) | — | |
| ℓ̂2 | LU(1e-3,1e+3) | 8.93/17.43 | N(.002) | 58.57/62.04 | |
| ν−1 | LU(1e-3,1e+3) | 2.78/14.97 | N(5) | 0.47/3.18 | |
| ν2 | LU(1e-3,1e+3) | 2.48/13.95 | N(.5) | 37.18/39.99 |
From varying the parameters locally around their nominal values using normal distributions, two parameters appear to be the most important: ν2 and ℓ̂2. These are the two parameters governing the rates of the final reactions in the two pathways, the production of the differentiation factor J.
An interesting situation occurs when considering the larger parameter space. The parameter k̂−1, which governs the binding of inactivate IL6 (Ai) to the surface receptor, accounts for a majority of the variance in the output. When local distributions were considered, the system did not show sensitivity to this parameter. This indicates that there is a range of high sensitivity to this parameter, although it is farther from the mean than the areas that the normal distributions sample heavily. This result is expected, since this parameter governs the rate of Ai binding to the cell. If it becomes too high, the surface receptor pathway is essentially shut off. The IL6 that would be saturating the surface receptor is now free to act via the soluble receptor pathway, which does not utilize . This result indicates that this parameter should be studied in more detail to try to reduce the uncertainty in it’s value. Finally, note that in both parameter spaces, the parameter pair (k−1, k1), governing the rate of binding of activated IL6 to its inhibitor sgp130, does not appear to be significant.
Although no significant second order interactions were detected for the local parameter space, six were detected for the full space: {ℓ−1, k̂−1}, {ℓ−1, ν−1}, {ℓ−1, ν2}, {ℓ̂2, ν−1}, {ℓ̂2, ν2}, and {ν−1, ν2}. Note that all of these interactions include parameters from the soluble receptor pathway, with all but one incorporating rate constants from the binding of activated IL6 to the surface gp130 receptor (ν−1 and ν2), initiating production of the differentiation factor J. The strongest effects were for {ℓ−1, ν−1}, the constants from the production of Aa and its subsequent binding to the cell, and from {ν−1, ν2}, the two rate constants governing this binding.
3.2.5. Densities of Cell Receptors and Astrocytes
This subsection describes studies in which the densities of astrocytes and the AHPC surface receptors were varied simultaneously. The astrocytes produce the soluble molecules, is utilized by the surface receptor pathway, and is an essential component in both pathways. The binding and the resultant signal transduction induces the AHPC to produce the differentiation factor J.
In the full parameter space, the cell surface receptor densities were assigned a log uniform pdf over [1 × 10+2, 1 × 10+5]receptors/cell, a range encompassing values provided for hematopoietic cells [58]. The astrocyte density was varied with a uniform distribution over [1 × 10+4, 1 × 10+5]cells/cm2. The reason for the smaller distribution for Na has to do with the consequences of lowering this parameter too much. Na is the sole producer of IL6 in this system. If Na has a log uniform pdf of [1 × 10+2, 1 × 10+5], then, for Na in the lower range there is not enough IL6 produced for any substantial amount of differentiation to occur. Most parameters will appear to be insensitive, while Na will have a strong effect on the output. For the experiments being considered in this paper, Na is a known quantity, within the range [1 × 10+4, 1 × 10+5]cells/cm2. Hence we restricted the distribution of this parameter in order to have an effective study of the sensitivity of the model to the other parameters. In the more local parameter space, the densities were varied according to normal distributions centered around their nominal values. eFAST sensitivity coefficients are presented in Table 9.
Table 9.
eFAST results, varying receptor and astrocyte densities:
| Parameter | Uni. Dist. | eFAST | Norm. Dist. | eFAST | |
|---|---|---|---|---|---|
| dummy | U(1e+2,1e+5) | — | N(1) | — | |
|
|
U(1e+2,1e+5) | 21.98/38.99 | N(1e+3) | 19.53/21.90 | |
|
|
U(1e+2,1e+5) | 60.82/77.62 | N(1e+5) | 15.52/18.67 | |
| Na | U(1e+4,1e+5) | 1.03/5.92 | N(3e+4) | 61.15/64.52 |
The results show sensitivity to all three parameters. Over the large parameter space, appears to be the most important, which is expected since this receptor is utilized by both pathways. Second order effects were detected for all three interactions, with { , } being the most influential interaction. Na is the most important parameter when considered locally, with second order effects detected for both { , Na} and { , Na}, with { , Na} appearing to be the strongest of the two interactions.
3.2.6. Unknown Parameters
This subsection describes studies in which the parameters were varied for which no value was found recorded in the literature. All other parameters were held at their nominal values, which are within the ranges reported in the literature. In the full parameter space, parameters were varied over a wide range relative to their nominal values. These were sampled using either uniform or log-uniform distributions. In the more local parameter space, these parameters were varied around their nominal values via normal distributions. The parameters that are the most influential, and as such should be studied biologically in more detail, are as follows: k̂−1, ℓ̂2, ν2, ba, , and . Note that in order to study ν2 and ℓ̂2, the intracellular mechanism leading to differentiation needs to be examined in more detail. In particular, the intracellular mechanism producing the differentiation factor J would need to be explored. eFAST sensitivity coefficients are presented in Table 10.
Table 10.
eFAST results, varying unknown parameters:
| Parameter | Uni. Dist. | eFAST | Norm. Dist. | eFAST | |
|---|---|---|---|---|---|
| dummy | LU(1e-3,1e+3) | — | N(1) | — | |
| ℓ−1 | LU(1e-3,1e+3) | — | N(5) | — | |
| k−1 | LU(1e-3,1e+3) | — | N(5) | — | |
|
|
LU(1e-3,1e+3) | 46.16/68.00 | N(500) | — | |
|
|
LU(1e-3,1e+3) | 0.27/2.58 | N(5) | — | |
| ℓ̂2 | U(1e-3,1e+3) | 11.81/25.21 | N(.002) | 23.16/25.71 | |
| ν−1 | LU(1e-3,1e+3) | 0.10/2.61 | N(5) | 0.19/— | |
| ν2 | LU(1e-3,1e+3) | —/3.02 | N(.5) | 14.02/16.36 | |
| ba | LU(1e-12,1e-9) | — | N(2e-10) | 17.53/20.12 | |
| sa | LU(1e-12,1e-9) | — | N(1e-11) | — | |
|
|
U(1e+2,1e+5) | 13.42/34.55 | N(1e+3) | 23.06/26.04 | |
|
|
U(1e+2,1e+5) | 1.93/10.94 | N(1e+5) | 17.16/19.97 |
Second order interaction effects within the large parameter space were detected for {k̂−1, }, {ℓ̂2, }, {ν2, }, and {ν2, }. Within the local parameter space, interactions were detected for {ℓ̂2, }, {ν2, ba}, {ν2, }, and {ba, }. Note that all but one of these interactions includes the density of a surface receptor required to translate the signal, with many of these being interactions between these receptor densities and the rate constant for the production of the differentiation factor J.
3.2.7. All Parameters
This subsection describes results of studies in which all parameters were varied simultaneously. Each parameter can be considered as belonging to one of the following groups: decay rates, secretion rates, dissociation constants, kinetic rates, or receptor/cell densities. In the full parameter space, each parameter was assigned either a uniform or log uniform pdf whose range depended on to which group it belonged. In the more local parameter space, the parameters were varied according to normal distributions centered around their nominal values. eFAST sensitivity coefficients are presented in Table 11.
When varied throughout the full parameter space, the output does not appear to be very sensitive to the variations in the decay rates. The other groups, however, do appear to have significant effects on the output. Many of the eFAST sensitivities are very similar, and there is apparently much variance due to interactions among the parameters. Second order effects were detected for thirteen interactions: {k̂−1, k̂2}, {k̂−1, ν2}, {k̂−1, Vd}, {ℓ̂−1, ℓ̂2}, {ℓ̂−1, }, {ℓ̂2, ν−1}, {ℓ̂2, Vd}, {ℓ̂2, μai}, {ℓ̂2, μil}, {ℓ̂2, }, {ν−1, ν2}, {ν−1, μai}, and {a1, ba}. Note that eleven of these interactions involve rate constants for reactions resulting in the production of the differentiation factor J. The interaction {k̂−1, k̂2} governs the binding of inactive IL6 to its surface receptor, while a1 and ba are the production rates for IL6 and its soluble receptor.
When the distributions were considered more locally, the decay rates appear to be influential on the output. The most influential parameter in this local space is μj, the decay rate of the intracellular differentiation factor. Other important parameters in this space are ℓ̂2, Ld, ν2, Vd, , , a1, and ba, while significant second order interactions were detected for {ν2, a1}, {Vd, ba}, {Vd, μil}, {Vd, Na}, {ba, Na}, {μai, μil}, {μai, μj}, and {μai, }. Many of these parameters are known. However, ℓ̂2, ν2, and μj are all involved with the intracellular differentiation molecule, and since the model exhibits sensitivity to these parameters, a goal of future work should be to better understand the intracellular mechanism leading to AHPC differentiation.
4. Conclusions
In this manuscript, we explored a mechanism of selective differentiation of AHPCs into neurons in response to astrocyte-secreted cues in an in vitro culture system. Specifically, we examined whether an IL6-mediated signaling pathway was sufficient to explain various results recently reported in the literature. We have shown that by choosing biologically-reasonable values for parameters not recorded in the literature, a mathematical model describing an IL6 mechanism is sufficient to simulate these experimental results. This model also provides many observations and testable hypotheses for the biological mechanism. These simulations suggest that (1) in the absence of direct contact, the secretion rates of IL6 and its soluble receptor sIL6Rα from hippocampal astrocytes are not altered through the action of soluble paracrine factors communicating between the astrocytes and AHPCs; (2) the surface IL6 receptor is a limiting factor in the surface receptor pathway, in that saturating these receptors results in only 35% differentiation over a six day period; (3) contact between astrocytes and AHPCs likely alters TUJ1 expression via mechanisms more complex than solely inducing a decrease in the expression of mRNA for, or secretion rate of, IL6 and its soluble receptor sIL6Rα.
Since many of the parameters in the model are presently unknown, a global sensitivity analysis was performed to determine (1) which parameters are the most influential on differentiation, and (2) which parameters are not influential on differentiation. The most important result of this analysis is that the biological inhibitor of the soluble receptor pathway, sgp130, does not significantly affect the level of differentiation occurring via this mechanism over a six day period, when it is present at biologically reasonable levels. This is a testable hypothesis and will be an area of future research. The sensitivity analysis also showed that the percentage of cells that differentiate over a six day period is influenced more by the parameters involved with the soluble receptor pathway, indicating that this pathway should be the target of future investigation into increasing the selective differentiation of AHPCs into neurons.
The sensitivity analysis shows that many of the most influential parameters, causing the highest amount of uncertainty, are recorded in the literature. However, some of the most influential unknown parameters are involved with the production or decay of the intracellular differentiation factor J, and as such the intracellular mechanism leading to differentiation should be studied in more detail. It is known that a JAK-STAT pathway involving STAT3 is utilized by the IL6 mechanism. However, it is possible that the response is due to activation of a different signal transduction cascade initiated by IL6 binding. For example, a RAS/MAPK signaling pathway may also be activated by stimulation of gp130 [32, 55]. STAT proteins dimerize in the cytosol, and the dimer binds to the corresponding regions of DNA to activate transcription of the neighboring genes. If the mechanism incorporates the reaction and we assume that , then κ2 corresponds to the Michaelis constant of this reaction. The value of κ2 found numerically in this mechanism is approximately 1 nM, provided one assumes the AHPC has a diameter of 10 μm. This observation may be helpful in future analysis of the intracellular mechanism.
Acknowledgments
Funding was provided by National Institutes of Health grant NIGMS 1 RO1 GM072005 and the Stem Cell Research Fund.
A. System of Differential Equations for the Kinetics
The reaction kinetics of the model are given by the following system of ordinary differential equations, and is formed through simple mass action considerations.
| (16) |
Np denotes the density of progenitor cells and is included in the differential equations for Ai and Aa due to the different units used for soluble molecules and surface receptors.
B. Michaelis-Menten Kinetics for AHPC Surface Receptor Complexes
Simple logistic growth is included for the proliferation of the progenitor cells. Since the surface receptors and intracellular molecules are measured in units nmol/cell, we must consider how their concentrations change during proliferation. When a cell divides, it is assumed here that division is symmetric so that the molecules of J are divided equally among the daughter cells. Likewise, all surface receptor complexes are divided equally among the cells. During proliferation only the unbound receptors and are synthesized, and the receptors are divided equally among the daughter cells. To see how these concentrations are changing, note that the total nmol of Z in the system is given by [Z] · Np, where Z is an existing surface receptor, bound surface receptor complex, or intracellular molecule. Differentiating, we have that , which implies
| (17) |
Letting yields the proliferation dynamics
| (18) |
We make the following chemical identifications for notational simplicity in the following derivation:
| (19) |
The chemical equations describing the reactions involving the surface receptors can be provided by
| (20) |
Superimposing the kinetic equations and the proliferation dyamics yields the system for the dynamics that involve the surface receptors:
| (21) |
We first note that two conservation laws exist for this system:
| (22) |
This allows for a simplified system, which does not include explicit dynamics for [E1] and [E2]. However, we would like to also derive expressions for [C1], [C2], and [C3]. The surface receptors are assumed to act in a fashion similar to enzymes, in that they take a substrate (Ai or Aa) and convert it into product (J). Numerical simulations suggest that the concentrations of [C1], [C2], and [C3] quickly come to equilibrium with the other species in the system. In accordance with the Michaelis-Menten hypothesis, we calculate the pseudo-steady state by setting , , and , which results in the system of equations
| (23) |
| (24) |
| (25) |
Adding equations (B.7) and (B.8) yields
| (26) |
After defining and , this equation can be solved for [C3] in terms of [C1], generating the relationship
| (27) |
This can be substituted into equation (B.8), where after identifying the Michaelis constant and defining , we solve for [C2] generating the relationship
| (28) |
In order to solve for [C1], we substitute [C2] and [C3] into (B.9). Define the Michaelis constant , and subsequently . After getting a common denominator and combining like terms, we form the equation
| (29) |
By multiplying by the nonzero term and rearranging we get the quadratic
| (30) |
Considering this equation in the form a[C1]2 + b[C1] + c = 0, we note that there is one nonnegative solution since a = 1 and c ≤ 0, and it is given by . Reintroducing the original variables yields the system presented in Section 2.
C. eFAST Summarized
The method of sensitivity analysis chosen here is the extended Fourier Amplitude Sensitivity Test (eFAST). eFAST is a variance-based technique for global sensitivity analysis that allows one to partition the variance of an output of interest among the various input factors. This allows one to identify both the most influential parameters and those that are not influential on the output. eFAST was developed by Saltelli et. al. [44-47], and is an extension of the original FAST method developed by Cukier et.al. [5, 6] and Schaibly and Shuler [48].
The following is a brief summary of eFAST for calculating Si and STi for a specific parameter. For a more extensive discussion of the method, see [6, 31, 44]. Assign a high frequency to parameter xi (perhaps ωi = 100) and low frequencies {ω~i} to the complementary set of parameters so that max{ω~i} ≤ ωi/2M, where M is the number of harmonics we will consider for each frequency. Generate a search curve through each parameter’s probability distribution by the transformation xi(s) = gi (sin(ωis)) where gi is the solution to , where pi is the pdf of xi and u = sin(ωis). This can be accomplished by taking , where is the inverse cumulative distribution function (ICDF) for pi. As s evolves, each parameter oscillates within its pdf with respect to its assigned frequency, causing corresponding oscillations in the output f(x(s)). The variance of the output is approximated by
Expressing the 2π-periodic function f(s) as a Fourier Series and applying Parseval’s theorem yields , where and .
The component of the variance due solely to xi is , provided there is no interference between these harmonics and harmonics of another assigned frequency. Since the harmonics rapidly converge to zero, we approximate D̂i by , where M is typically 4 or 6. The choice of max{ω~i} allows for interference effects between ωi and {ω~i} on these harmonics to be made arbitrarily small. The total effect due to the complementary set is approximated by , which approximates the variance caused by sole actions and interactions among all parameters except xi. The main effect of xi is defined as Si = Di/D, and is the percentage of variance due solely to xi. The total effect of xi is defined as STi = 1 − D~i/D and is the percentage of variance due both to the sole action of xi and its interactions with other parameters. Finally, this procedure is repeated NR times by introducing random phase shifts, , making the total number of model simulations N = NR × Ns × k, where Ns is the number of values sampled for each parameter per search curve. Si and STi are taken to be the means of these samples.
Following Marino et.al. [31], a dummy parameter is included in the analysis. The model is independent of this parameter, but a small percentage of the variance is nonetheless alloted to this parameter due to the above approximations. A two-sample t-test is used on the data generated by the search curves to determine which parameters have sensitivity indices significantly different from the dummy parameter.
In 2011, Xu and Gertner [60] demonstrated that second-order effects between parameters with assigned frequencies of ωj and ωk (ωj > ωk) can be estimated with , where . They suggest using M = 1 to calculate the second-order sensitivity to reduce the effects of inference error, although this does lead to an underestimate of the second-order effect. This equation can then be written as , resulting in the second-order sensitivity coefficient Sjk = Djk/D. This procedure can be generalized to calculate other higher-order coefficients. In practice, we assign a large ωj to one parameter as decribed above and assign a small unique frequency ωk (typically ωk = 2) to the other parameter. A second-order effect is also calculated between the parameter of interest and the dummy parameter, with a two-sample t-test used to determine if the second-order sensitivity Sjk is statistically significant.
D. Model Parameters
The model parameters are given in Table 4. Some of these were found in the literature and others simulated by analogy. Comments in the table distinguish these. Discussions of the dissociation and Michaelis constants are provided in [30]. To calculate the forward and backward reaction rate constants, we first choose a biologically reasonable value for one constant, and then relate this value to the other constant through the dissociation/Michaelis constant.
The carrying capacity of the plate (Nmax) can be estimated as follows: The dimensions of the plate are 1cm × 1cm. Thinking of each cell as being a sphere with diameter 10 μm, and assuming the AHPCs cannot be stacked on top of one another, we have that the number of cells that can be placed side by side (so diameters form a continuous straight line across the plate) is
Thus the total number of cells that can be placed on the plate in this fashion is
However, due to other considerations, such as the presence of other cells / ECM, neurites, and the fact that the cells are not perfect spheres in vitro, we take Nmax to be 1 × 10⁵cells/cm2. Finally, when performing simulations, one must convert ℓ̂1 to units of via the volume of an AHPC, estimated by
Footnotes
Publisher's Disclaimer: This is a PDF file of an unedited manuscript that has been accepted for publication. As a service to our customers we are providing this early version of the manuscript. The manuscript will undergo copyediting, typesetting, and review of the resulting proof before it is published in its final citable form. Please note that during the production process errors may be discovered which could affect the content, and all legal disclaimers that apply to the journal pertain.
References
- 1.Alvarez-Buylla A, Garcia-Verdugo JM. Neurogenesis in adult subventricular zone. J Neurosci. 2002;22(3):629–634. doi: 10.1523/JNEUROSCI.22-03-00629.2002. [DOI] [PMC free article] [PubMed] [Google Scholar]
- 2.Barkho BZ, Song H, Aimone JB, Smrt RD, Kuwabara T, Nakashima K, Gage FH, Zhao X. Identification of astrocyte-expressed factors that modulate neural stem/progenitor cell differentiation. Stem Cells Dev. 2002;15(3):407–421. doi: 10.1089/scd.2006.15.407. [DOI] [PMC free article] [PubMed] [Google Scholar]
- 3.Bonner JF, Connors TM, Silverman WF, et al. Grafted Neural Progenitors Integrate and Restore Synaptic Connectivity across the Injured Spinal Cord. Journal of Neuroscience. 2011;31(12):4675–4686. doi: 10.1523/JNEUROSCI.4130-10.2011. [DOI] [PMC free article] [PubMed] [Google Scholar]
- 4.Crauste F, Pujo-Menjouet L, Genieys S, Molina C, Gandrillon O. Adding self-renewal in committed erythroid progenitors improves the biological relevance of a mathematical model of erythropoiesis. Journal of Theoretical Biology. 2008;250:322–338. doi: 10.1016/j.jtbi.2007.09.041. [DOI] [PubMed] [Google Scholar]
- 5.Cukier RI, Fortuin CM, Shuler KE, Petschek AG, Schaibly JH. Study of the sensitivity of coupled reaction systems to uncertainties in rate coefficients. I. Theory. J Chem Phys. 1973;59(8):3873–3878. [Google Scholar]
- 6.Cukier RI, Levine HB, Shuler KE. Nonlinear Sensitivity Analysis of Multiparameter Model Systems. Journal of Computational Physics. 1978;26:1–42. [Google Scholar]
- 7.Dehay C, Kennedy H. Cell-cycle control and cortical development. Nature Rev Neurosci. 2007;8:438–450. doi: 10.1038/nrn2097. [DOI] [PubMed] [Google Scholar]
- 8.Diamant M, Rieneck K, Mechti N, Zhang XG, Svenson M, Bendtzen K, Klein B. Cloning and expression of an alternatively spliced mRNA encoding a soluble form of the human interleukin-6 signal transducer gp130. FEBS Lett. 1997;412:379–384. doi: 10.1016/s0014-5793(97)00750-3. [DOI] [PubMed] [Google Scholar]
- 9.Dingli D, Traulsen A, Pacheco JM. Compartmental Architecture and Dynamics of Hematopoeisis. PLoS One. 2007;2(4):e345. doi: 10.1371/journal.pone.0000345. [DOI] [PMC free article] [PubMed] [Google Scholar]
- 10.Duomic M, Marciniak-Czochra A, Perthame B, Zubelli JP. A structured population model of cell differentiation. SIAM J Appl Math. 2011;71(6):1918–1940. [Google Scholar]
- 11.Eriksson PS, et al. Neurogenesis in the adult human hippocampus. Nat Med. 1998;4(11):1313–1317. doi: 10.1038/3305. [DOI] [PubMed] [Google Scholar]
- 12.Fu KY, Dai LG, Chiu IM, et al. Sciatic Nerve Regeneration by Microporous Nerve Conduits Seeded With Glial Cell Line-Derived Neurotrophic Factor or Brain-Derived Neurotrophic Factor Gene Transfected Neural Stem Cells. Artificial Organs. 2011;35(4):363–372. doi: 10.1111/j.1525-1594.2010.01105.x. [DOI] [PubMed] [Google Scholar]
- 13.Fukada T, Yoshida Y, Nishida K, Ohtani T, Shirogane T, Hibi M, Hirano T. Signaling Through Gp130: Toward a General Scenario of Cytokine Action. Growth Factors. 1999;17(2):81–91. doi: 10.3109/08977199909103518. [DOI] [PubMed] [Google Scholar]
- 14.Gadient RA, Otten UH. Interleukin-6 (IL6)–a molecule with both beneficial and destructive potentials. Prog Neurobiol. 1997;52(5):379–390. doi: 10.1016/s0301-0082(97)00021-x. [DOI] [PubMed] [Google Scholar]
- 15.Gerhartz C, Dittrich E, Stoyan T, Rose-John S, Yasukawa K, Heinrich P, Graeve C. Biosynthesis and half-life of the interleukin-6 receptor and its signal transducer gp130. Eur J Biochem. 1994;223:265–274. doi: 10.1111/j.1432-1033.1994.tb18991.x. [DOI] [PubMed] [Google Scholar]
- 16.Graeve L, Korolenko TA, Hemmann U, Weiergräber O, Dittrich E, Heinrich P. A complex of the soluble interleukin-6 receptor and interleukin-6 is innternalized via the signal transducer gp130. FEBS Lett. 1996;399:131–134. doi: 10.1016/s0014-5793(96)01305-1. [DOI] [PubMed] [Google Scholar]
- 17.Gruol DL, Nelson TE. Physiological and pathological roles of interleukin-6 in the central nervous system. Mol Neurobiol. 1997;15(3):307–339. doi: 10.1007/BF02740665. [DOI] [PubMed] [Google Scholar]
- 18.Hammacher A, Simpson RJ, Nice EC. The interleukin-6 (IL-6) Partial Antagonist (Q159E,T162P)IL-6 Interacts with the IL-6 Receptor and gp130 but Fails to Induce a Stable Hexameric Receptor Complex. Journal of Biological Chemistry. 1996;271(10):5464–5473. doi: 10.1074/jbc.271.10.5464. [DOI] [PubMed] [Google Scholar]
- 19.Han Q, Bradshaw EM, Nilsson B, Hafler DA, Love C. Multidimensional analysis of the frequencies and rates of cytokine secretion from single cells by quantitative microengraving. Lab Chip. 2010;10:1391–1400. doi: 10.1039/b926849a. [DOI] [PMC free article] [PubMed] [Google Scholar]
- 20.Harper MM, Ye Y, Blong CC, Jacobson ML, Sakaguchi DS. Integrins contribute to initial morphological development and process outgrowth in rat adult hippocampal progenitor cells. J Mol Neurosci. 2010;40:269–283. doi: 10.1007/s12031-009-9211-x. [DOI] [PubMed] [Google Scholar]
- 21.Ihara S, Nakajima K, Fukada T, Hibi M, Nagata S, Hirano T, Fukui Y. Dual control of neurite outgrowth by STAT3 and MAP kinase in PC12 cells stimulated with interleukin-6. EMBO J. 1997;16:5345–5352. doi: 10.1093/emboj/16.17.5345. [DOI] [PMC free article] [PubMed] [Google Scholar]
- 22.Johnston MD, Edwards CM, Bodmer WF, Maini PK, Chapman SJ. Mathematical modeling of cell population dynamics in the colonic crypt and in colorectal cancer. PNAS. 2007;104(10):4008–4013. doi: 10.1073/pnas.0611179104. [DOI] [PMC free article] [PubMed] [Google Scholar]
- 23.Jostock T, Müllberg J, Ozbek S, Atreya R, Blinn G, Voltz N, Fischer M, Neurath MF, Rose-John S. Soluble gp130 is the natural inhibitor of soluble interleukin-6 receptor transsignaling responses. European Journal of Biochemistry. 2001;268:160167. doi: 10.1046/j.1432-1327.2001.01867.x. [DOI] [PubMed] [Google Scholar]
- 24.Kishimoto T. Interleukin-6: from basic science to medicine - 40 years in immunology. Annu Rev Immunol. 2005;23:1–21. doi: 10.1146/annurev.immunol.23.021704.115806. [DOI] [PubMed] [Google Scholar]
- 25.Krauss G. Biochemistry of Signal Transduction and Regulation. second edition. Wiley-VCH; Weinheim: 2001. [Google Scholar]
- 26.Lindmark EL, Diderholm E, Wallentin L, Siegbahn A. Relationship Between Interleukin 6 and Mortality in Patients with Unstable Coronary Artery Disease. JAMA. 2001;286:2107–2113. doi: 10.1001/jama.286.17.2107. [DOI] [PubMed] [Google Scholar]
- 27.Loeffler M, Pantel K, Wulff H, Wichmann HE. A mathematical model of erythropoiesis in mice and rats. Part 1: Structure of the model. Cell Tissue Kinet. 1989;22:13–30. doi: 10.1111/j.1365-2184.1989.tb00198.x. [DOI] [PubMed] [Google Scholar]
- 28.Lo W-C, Chou C-S, Gokffski KK, Wan FY-M, Landler AD, Calof AL, Nie Q. Feedback regulation in multistage cell lineages. Math Biosci Eng. 2009;6(1):59–82. doi: 10.3934/mbe.2009.6.59. [DOI] [PMC free article] [PubMed] [Google Scholar]
- 29.Lust JA, Donovan KA, Kline MP, Greipp PR, Kyle RA, Maihle NJ. Isolation of an mRNA encoding a soluble form of the human interleukin-6 receptor. Cytokine. 1992;4:96–100. doi: 10.1016/1043-4666(92)90043-q. [DOI] [PubMed] [Google Scholar]
- 30.Marciniak-Czochra A, Stiehl T, Ho AD, Wagner W. Modeling of asymmetric cell division in hematopoietic stem cells: Regulation of self-renewal is essential for efficient repopulation. Stem Cells Dev. 2009;18:377–386. doi: 10.1089/scd.2008.0143. [DOI] [PubMed] [Google Scholar]
- 31.Marino S, Hogue IB, Ray CJ, Kirschner DE. A methodology for performing global uncertainty and sensitivity analysis in systems biology. J Theor Biol. 2008;254:178–196. doi: 10.1016/j.jtbi.2008.04.011. [DOI] [PMC free article] [PubMed] [Google Scholar]
- 32.Marz P, Heese K, Dimitriades SB, Rose JS, Otten U. Role of interleukin-6 and soluble IL6 receptor in region-specific induction of astrocytic differentiation and neurotrophin expression. Glia. 1999;26:191–200. doi: 10.1002/(sici)1098-1136(199905)26:3<191::aid-glia1>3.0.co;2-#. [DOI] [PubMed] [Google Scholar]
- 33.Mihara M, Koishihara Y, Fukui H, Yasukawa K, Ohsugi Y. Murine anti-Il-6 monoclonal antibody prolongs the half-life in circulating blood and thus prolongs the bioactivity of human IL-6 in mice. Immunology. 1991;74(1):55–59. [PMC free article] [PubMed] [Google Scholar]
- 34.Mistry SK, Keefer EW, Cunningham BA, Edelman GM, Crossin KL. Cultured Rat Hippocampal Progenitors Generate Spontaneously Active Neural Networks. PNAS. 2002;99(3):1621–1626. doi: 10.1073/pnas.022646599. [DOI] [PMC free article] [PubMed] [Google Scholar]
- 35.Monje ML, Toda H, Palmer TD. Inflammatory blockade restores adult hippocampal neurogenesis. Science. 2003;30:1760–1765. doi: 10.1126/science.1088417. [DOI] [PubMed] [Google Scholar]
- 36.Müllberg J, Schooltink H, Stoyan T, Gunther M, Graeve L, Buse G, Mackiewicz A, Heinrich PC, Rose-John S. The soluble interleukin-6 receptor is generated by shedding. Eur J Immunol. 1993;23:473–480. doi: 10.1002/eji.1830230226. [DOI] [PubMed] [Google Scholar]
- 37.Oh J, Recknor JB, Recknor JC, Mallapragada SK, Sakaguchi DS. Soluble factors from neocortical astrocytes enhance neuronal differentiation of neural progenitor cells from adult rat hippocampus on micropatterned polymer substrates. J Biomed Mater Res A. 2009;91(2):575–585. doi: 10.1002/jbm.a.32242. [DOI] [PMC free article] [PubMed] [Google Scholar]
- 38.Oh J, Blong CC, McCloskey MA, Nilsen-Hamilton M, Sakaguchi DS. Astrocyte-derived interleukin-6 promotes specific neuronal differentiation of neural progenitor cells from adult hippocampus. J Neurosci Res. 2010;88(13):2798–2809. doi: 10.1002/jnr.22447. [DOI] [PMC free article] [PubMed] [Google Scholar]
- 39.van Ooyen A. Using theoretical models to analyse neural development. Nature Rev Neurosci. 2011;12:311–326. doi: 10.1038/nrn3031. [DOI] [PubMed] [Google Scholar]
- 40.Peters M, Müller A, Rose-John S. Interleukin-6 and Soluble Interleukin-6 Receptor: Direct Stimulation of gp130 and Hematopoiesis. Blood. 1998;92(10):3495–3504. [PubMed] [Google Scholar]
- 41.Recknor JB, Sakaguchi DS, Mallapragada SK. Directed growth and selective differentiation of neural progenitor cells on micropatterned polymer substrates. Biomaterials. 2006;27(22):4098–4108. doi: 10.1016/j.biomaterials.2006.03.029. [DOI] [PubMed] [Google Scholar]
- 42.Rivest S. Molecular insights on the cerebral innate immune system. Brain Behav Immun. 2003;17:13–19. doi: 10.1016/s0889-1591(02)00055-7. [DOI] [PubMed] [Google Scholar]
- 43.Salamon P, Sibani P, Frost R. Facts, Conjectures, and Improvements for Simulated Annealing. first edition. Society for Industrial and Applied Mathematics; Philadelphia: 2002. [Google Scholar]
- 44.Saltelli A, Bolado R. An alternative way to compute Fourier amplitude sensitivity test (FAST) Comput Stat Data Anal. 1998;26(4):445–460. [Google Scholar]
- 45.Saltelli A, Tarantola S, Chan KPS. A Quantitative Model-Independent Method for Global Sensitivity Analysis of Model Output. Technometrics. 1999;41(1):39–56. [Google Scholar]
- 46.Saltelli A, Chan K, Scott EM. Sensitivity Analysis. first edition. Wiley; Hoboken: 2000. [Google Scholar]
- 47.Saltelli A. Sensitivity Analysis in Practice: A Guide to Assessing Scientific Models. first edition. Wiley; Hoboken: 2004. [Google Scholar]
- 48.Schaibly JH, Shuler KE. Study of the sensitivity of coupled reaction systems to uncertainties in rate coefficients. II. Applications. J Chem Phys. 1973;59(8):3879–3888. [Google Scholar]
- 49.Schroers A, Hecht O, Kallen KJ, Pachta M, Rose-John S, Grotzinger J. Dynamics of the gp130 Cytokine Complex: A Model for Assembly on the Cellular Membrane. Protein Sci. 2005;14:783–790. doi: 10.1110/ps.041117105. [DOI] [PMC free article] [PubMed] [Google Scholar]
- 50.Seri B, et al. Cell types, lineage, and architecture of the germinal zone in the adult dentate gyrus. J Comp Neurol. 2004;478:359–378. doi: 10.1002/cne.20288. [DOI] [PubMed] [Google Scholar]
- 51.Singh A, Jayaraman A, Hahn J. Modeling regulatory mechanisms in IL-6 signal transduction in hepatocytes. Biotechnology Bioeng. 2006;95(5):850–862. doi: 10.1002/bit.21026. [DOI] [PubMed] [Google Scholar]
- 52.Song H, et al. Astroglia induce neurogenesis from adult neural stem cells. Nature. 2002;417:39–44. doi: 10.1038/417039a. [DOI] [PubMed] [Google Scholar]
- 53.Stiehl T, Marciniak-Czochra A. Characterization of stem cells using mathematical models of multistage cell lineages. Mathematical and Computer Modelling. 2011;53:1505–1517. [Google Scholar]
- 54.Su HX, Wu Y, Yuan QJ, et al. Optimal Time Point for Neuronal Generation of Transplanted Neural Progenitor Cells in Injured Spinal Cord Following Root Avulsion. Cell Transplantation. 2011;20(2):167–176. doi: 10.3727/096368910X522090. [DOI] [PubMed] [Google Scholar]
- 55.Taga T, Kashimoto T. Gp130 and the interleukin-6 family of cytokines. Annu Rev Immunol. 1997;15:797–819. doi: 10.1146/annurev.immunol.15.1.797. [DOI] [PubMed] [Google Scholar]
- 56.Tomlinson IPM, Bodmer WF. Failure of programmed cell death and differentiation as causes of tumors: Some simple mathematical models. PNAS. 1995;92:11130–11134. doi: 10.1073/pnas.92.24.11130. [DOI] [PMC free article] [PubMed] [Google Scholar]
- 57.Torres PM, Guilarducci CV, Franco AS, Araujo EGD. Sciatic conditioned medium increases survival, proliferation and differentiation of retinal cells in culture. International Journal of Developmental Neuroscience. 2001;20(1):11–20. doi: 10.1016/s0736-5748(02)00005-9. [DOI] [PubMed] [Google Scholar]
- 58.Touw I, van Gurp R, Schipper P, van Agthoven T, Lowenberg B. Introduction of the human interleukin-6 (IL-6) receptor in murine IL-3-dependent hematopoietic cells restores responsiveness to IL-6. Blood. 1992;79(11):2867–2972. [PubMed] [Google Scholar]
- 59.Vereyken EJF, Bajova H, Chow S, de Graan P, Gruol DL. Chronic interleukin-6 alters the level of synaptic proteins in hippocampus in culture and in vivo. E J Neurosci. 2007;25:3605–3616. doi: 10.1111/j.1460-9568.2007.05615.x. [DOI] [PubMed] [Google Scholar]
- 60.Xu C, Gertner G. Understanding and comparisons of different sampling approaches for the Fourier Amplitudes Sensitivity Test (FAST) Computational Statistics and Data Analysis. 2011;55:184–198. doi: 10.1016/j.csda.2010.06.028. [DOI] [PMC free article] [PubMed] [Google Scholar]