

Abstract
Imaging can potentially make a major contribution to the zebrafish phenome project, which will probe the functions of vertebrate genes through the generation and phenotyping of mutants. Imaging of whole animals at different developmental stages through adulthood will be used to infer biological function. Cell resolutions will be required to identify cellular mechanism and to detect a full range of organ effects. Light-based imaging of live zebrafish embryos is practical only up to ~2 days of development, due to increasing pigmentation and diminishing tissue lucency with age. The small size of the zebrafish makes possible whole-animal imaging at cell resolutions by histology and micron-scale tomography (microCT). The histological study of larvae is facilitated by the use of arrays, and histology’s standard use in the study of human disease enhances its translational value. Synchrotron microCT with X-rays of moderate energy (10-25 keV) is unimpeded by pigmentation or the tissue thicknesses encountered in zebrafish of larval stages and beyond, and is well-suited to detecting phenotypes that may require 3D modeling. The throughput required for this project will require robotic sample preparation and loading, increases in the dimensions and sensitivity of scintillator and CCD chips, increases in computer power, and the development of new approaches to image processing, segmentation, and quantification.
Introduction: The Zebrafish Phenome Project
A fundamental principle of genetics is that the structural, physiological or behavioral phenotype of an organism with a deficiency in a specific gene function informs us about the gene’s function(s). Phenotyping an organism is limited by the available methods, typically limited to the focus of the individual scientist and complicated by the often multiple functions of any given gene, as illustrated by pleiotropy [1, 2, 3, 4, 5]. The totality of possible phenotypes, the phenome [6• 7•] is a conceptual construct that, together with imaging, comprises the focus of this review. To address the functions of the more than 20,000 vertebrate genes, and inspired by the development of phenomics [8•, 9, 10,11, 12], the international zebrafish community is planning a “Zebrafish Phenome Project1”. Multiple methods of mutagenesis [13] will be used toward the goal of producing at least one mutant allele per gene in the next five years, and the mutants will then be phenotyped. At a March 2010 meeting sponsored by Sanger Center and the National Human Genome Research Institute at NIH, the zebrafish research community discussed potential phenotyping assays. These included physiological and behavioral assays, as well as fluorescence-based morphological assays that require live animals. Here, we focus on the assessment of phenotypes that change the morphological features of cells, tissues, and organs in whole, fixed zebrafish that are too pigmented and too thick for 3D imaging at cell resolutions using light. The issues discussed included methods of imaging, reproducibility of assays, and throughput of mutant production. Imaging features ideal for this project are listed in Table 1.
Table 1.
Ideal Features of Imaging for the Zebrafish Phenome Project
|
Zebrafish as a model for vertebrate biology and human disease
The zebrafish is a vertebrate model with compelling experimental features, including embryonic transparency, fecundity, and a sophisticated genetic tool box including genetic screens, morpholino knock-downs of virtually any gene during embryogenesis, and facile generation of fluorescently tagged transgenic animals [14, 15]. These advantages have made the zebrafish an excellent model for understanding development, evolution, and diseases such as cancer, aging, anemia, tissue regeneration, and cardiovascular disease [16, 17, 18, 19]. The exquisite transparency and small size of live, embryonic zebrafish make them as accessible to light-based imaging as any other vertebrate model. With age, however, the zebrafish body becomes less transparent, thicker, and increasingly pigmented. By adulthood, pigmented cells cover a majority of the surface of the fish. These characteristics preclude high-resolution light-based imaging. We review the most common and most powerful imaging modalities the research community has used for embryos (Table 2), and the advantages and disadvantages of each method by developmental stage of the zebrafish (Table 3). Our understanding of development and biology will benefit from integration of methods [20]. Despite its clear value after the affected cell types have been identified, electron microscopy will not be discussed as a candidate for high-throughput phenotyping because its small fields of view make it impractical to image whole zebrafish beyond embryonic ages.
Table 2.
Technical features of imaging modalities being considered for the Zebrafish Phenome Project.
| Technology | Resolution Limit | Maximum Sample Diameter | Radiation | References | Advantages | Disadvantages |
|---|---|---|---|---|---|---|
| Histology (2D) | 0.22 μm (determined by lens numerical aperture) | Usually ~0.9 × 5cm; available to | Visible Light | [49,53]; www.zfatlas.psu.edu | Standard translational tool, high 2D resolution, whole animal, online atlas, laser capture microdissection possible | 2D, destructive, step sections cover most of fish, but leaves most unseen |
| Confocal Microscopy (Scanning Laser) | ~0.4 μm | ~determined by N.A. of objective | Visible Light (laser spot) | [26, 27] | Resolution, gene specificity, elaborate 4D software developed | Limited penetration, small field of view, nonisotropic, slow, phototoxic |
| Selective Plane Illumination Microscopy (SPIM) | 5-10 μm | 1-5 mm | Visible Light (laser, or laser sheet) | [27,28] | Whole, live animals imaged quickly(SPIM; 6 sec/frame),up to ~500 μm depth, 6 μm resolution, gene specificity by fluorescence | Poor resolution for thicker specimens, not for pigmented specimens, nonisotropic, limited field of view |
| Optical Projection Tomography (OPT) | 11-26 μm | 1-10 mm | Visible Light | [41,43], http://www.fishnet.org.au/ | Whole, live animals imaged quickly, gene specificity with transgenics, online atlas | Poor resolution for thicker specimens, not for pigmented specimens, not cellular resolution, nonisotropic |
| Block Face Imaging (e.g. episcopic fluorescence image capture - EFIC) | Currently > 2 μm for whole animals | Large | Visible Light | [35-37] | Little distortion, resolution set by section thickness and surface imaging optics; used for human embryos and adults | Destructive; slowed by cycles of sectioning and imaging; generally nonisotropic; resolutions for whole vertebrate embryos not yet < 2 μm |
| Magnetic Resonance Microscopy | ≥19.5 μm | mm to cm | Magnetic Field | [38-40] | Excellent contrast, tissue resolution, isotropic, nondestructive | Low-throughput; not cellular resolution, few high field machines |
| Functional Optoacoustic Microscopy | ~6 μm | ~3 mm (deeper-> lower resolution) | laser light and ultrasound | [44,45] | Live animal in situ imaging, functional (e.g. oxygen saturation), fast | Poor resolution with thicker specimens nonisotropoic. |
| MicroCT (low-flux, parallel-beam, e.g. Lawrence Berkeley National Laboratory) | 10-15 nm | <40 nm | Soft X-ray | [59] | No special stains necessary, organellar resolution, isotropic, nondestructive | Small field of view; cryoimaging is difficult for objects of zebrafish embryo size; not usable for whole animals. |
| MicroCT (low flux, cone-beam, commercial) | ~1.1 μm (nominal, limited by spot size) | 1.15 mm | tube X-Ray | [57-61-62], http://www.xradia.com, http://www.skyscan.be/home.htm | Whole animal, adjustable field of view, isotropic, nondestructive | Fixed only, long scan times; only largest cells visualized |
| MicroCT (hi-flux, parallel-beam, third generation synchrotron) | ~1 μm | 1.5 / 2.9 mm (limited by scintillator resolution and CCD chip size) | synchrotron hard X-Ray | [56,58,60], http://www.aps.anl.gov/Xray_Science_Division/Xray_Microscopy_and_Imaging/ | Whole-animal, fast imaging, cellular resolution, isotropic, nondestructive | Fixed only, few facilities (will require national resource for high-throughput) |
| NanoCT (low flux, cone-beam, commercial) | 80-150 nm | ~11 mm | tube X-Ray | http://www.skyscan.be/home.htm | high resolution, available to single lab, isotropic, nondestructive | Fixed only, Small field of view, slow imaging |
| NanoCT (hi-flux, parallel-beam, third generation synchrotron) | ≤30 nm | ~1 mm | synchrotron hard X-Ray | http://nano.anl.gov/research/nanoprobe.html | High resolution, fast, isotropic | Fixed only, small field of view, will require national resource for high-throughput, sample may be damaged by huge flux |
Table 3.
Suitability of imaging modalities for imaging zebrafish at different developmental stages for the Zebrafish Phenome Project.
| Technology | Cell Resolution (≤ ~1 μm pixel or voxel dimension) | Throughput Potential for ZF Phenome Project (<1 minute/animal) | Whole Unpigmented embryos | Whole Pigmented Larvae (~1mm width) @ Cell Resolution | Whole Pigmented Juveniles (~3mm width @ Cell Resolution | Whole Pigmented Adults (~7mm width @ Cell Resolution | Isotropic Voxels | Comparable Human and Mouse Data |
|---|---|---|---|---|---|---|---|---|
| Histology (2D) | Yes | Yes | Yes | Yes (2D) | Yes (2D) | Yes(2D) | No | Yes |
| Confocal Microscopy (Scanning Laser) | Yes | No | Yes | No | No | No | No | No |
| Selective Plane Illumination Microscopy (SPIM) | Almost | Yes | Yes | No | No | No | No | No |
| Optical Projection Tomography (OPT) | No | Yes | Yes | No | No | No | No | No |
| Block-face reconstruction (e.g. episcopiec fluorescence image capture - EFIC) | Not yet | Unlikely | Yes | Yes | Yes | Yes | No | Yes |
| Magnetic Resonance Microscopy | No | No | Yes | No | No | No | Possible | Yes |
| Functional Optoacoustic Microscopy | No | Yes | No | No | No | No | No | Yes |
| MicroCT (low-flux, parallel-beam, Lawrence Berkeley National Laboratory) | Yes | No | No | No | No | No | Yes | Not yet |
| MicroCT (low flux, cone-beam, commercial) | Almost | No | Yes | Not yet | No | No | Yes | Yes |
| MicroCT (hi-flux, parallel-beam, Third-Generation Synchtrotrons) | Yes | Yes | Yes | Yes (currently in segments) | Yes (currently in segments) | Will require larger scintillator and CCD chips | Yes | Yes (indirect, through histology) |
| NanoCT (low flux, cone-beam, commercial) | Subcellular | No | No | No | No | No | Yes | Not yet |
| NanoCT (hi-flux, parallel-beam, Argonne National Labs) | Subcellular | No | No | No | No | No | Yes | Not yet |
Biological function and cellular mechanisms can be revealed by whole-animal morphological phenotyping
To understand why imaging is a key part of phenome projects, it is appropriate to address a fundamental question: “How is imaging related to gene function?” An awareness of the semantics of “function” and of contributory principles from genetics and pathology are necessary to understand the answer. Geneticists interested in gene function frequently study the phenotype of mutants or knock-downs. In this phenotype-driven research, genetic screens for mutant phenotypes are used to identify genes involved in any given function. For example, a genetic screen for morphologically abnormal Drosophila embryos led to the identification of genes that are necessary for embryogenesis, some of which were later found to play a role in human cancer (reviewed by [21]). Zebrafish genetic screens have been pursued for two decades [14], with contributory support from a cross-NIH zebrafish initiative (http://grants.nih.gov/grants/guide/pa-files/PAR-08-138.html).
Whole-organism phenotyping is essential to understanding the biological function of genes. Scientific definitions of gene functions include the molecular/biochemical, cellular, and biological. A specific example illustrates this point. The commonly used “golden” zebrafish are homozygous for a nonsense (presumably null) mutation in the potassium-dependent sodium-calcium exchanger, slc24a5. At 48 hours of development, they lack pigmentation, while wild-type fish have darkly pigmented cells in the eye and body [22]. Microscopic inspection of adult stages shows that the melanin-containing cells, the melanophores, are lighter in color but similar in number to wild-type. Fewer, smaller, and more lightly pigmented melanosomes were shown in golden embryos by electron microscopy of skin [23]. In this example, the molecular/biochemical gene function identified by cloning was ion exchange. The cellular mechanism – control of melanosome morphogenesis – was revealed by microscopic and ultrastructural morphology. However, only the whole animal, mutant morphological phenotype identifies the biological function of the golden gene as pigmentation within pigment cells of the whole animal. Whole-animal morphology of mutants, in cellular detail, is therefore central to understanding gene function.
Whole-animal imaging is necessary for the Zebrafish Phenome Project
Phenotypes caused by single gene deficiencies can cross organ systems in invertebrate and vertebrate model systems, including humans, and can affect different sets of organ systems at different developmental times [3, 1, 4]. Some organ systems, especially those having to do with sexual maturity, are most affected at reproductive ages. We therefore need to phenotype animals not only during embryogenesis, when primordial germ cell migration takes place, but also into juvenile stages when sexual differentiation is complete. Phenotyping juveniles and adults is relevant because humans with single gene deficiencies often survive into adolescence and adulthood. It is therefore informative for phenome projects of any model system to include analysis of the whole organism at different developmental ages.
Phenotyping at cell resolution is essential for detecting pathophysiological mechanisms
One hundred and fifty years ago, based on the discovery that all organisms are comprised of cells (the cell theory), Virchow proposed that disease is a cellular process [24••] that can often be characterized by the study of stained tissue sections at cell resolutions (classically, histology). This principle revolutionized medicine and forms the existing gold standard for diagnosis in anatomic pathology. Today, those criteria are supplemented by protein- and gene-specific assays [25].
Imaging whole zebrafish at cell resolutions presents different problems at embryonic vs. postembryonic stages of development (Tables 2, 3). In vivo, fluorescence-based imaging during days 1 and 2 of zebrafish development takes advantage of embryonic transparency. Imaging fluorescently-tagged proteins by laser confocal, two-photon, and sheet microscopy [reviewed by 13] has allowed the monitoring of biological processes such as cell movements and cell division in real time [26, 27•,28•, 29•, 30]. Some exciting, high-throughput methods involving microfluidic handling of embryos have been developed [31, 32•, 33]. But how might pigmented and larger fish be best imaged at cell resolutions? Block-face reconstructions have yielded exciting results for the whole human [34]. A derivative of that method based on fluorescence imaging of cut surfaces, episcopic fluorescence image capture (EFIC) has great promise, but has not yet proven capable of achieving resolutions at or below 1 μm, and is unlikely to approach the throughput needed for the zebrafish phenome project due to built-in limitation of having to alternate between cutting and imaging the entire surface for each of potentially thousands of sections through whole fish [35, 36, 37]. MRI has been used for other model systems [38, 39], can be used to image whole zebrafish through adulthood, provides unique contrast, can be used as a molecular probe, and can serve as a means of high-throughput phenotyping and as a reference scaffold for other imaging methods [40]. It is presently impractical to generate useful voxel resolutions of less than ~8 μm using MRI, which precludes the detection of small cell types. Optical projected tomography (OPT) was used to rapidly generate a labeled on-line atlas through the life-span of the zebrafish [41•, 42, 43], but does not reach cell resolution (Tables 2, 3). Optoacoustic imaging has the ability to derive functional information such as oxygen tension [44, 45•], but also cannot provide cell resolution through the full volume of an entire organism. In sum, a variety of in vivo imaging techniques have different advantages, but those that produce images of cell resolution have fields of view too small to cover the entire fish older than about 2 days of development (Table 2). We are left with only two methods to image whole, pigmented larval, juvenile and adult zebrafish at cell resolutions: 1) histology, which can yield 2D sections of ~0.25 μm in-plane pixel resolution, and 2) microCT, which yields isotropic, 3-dimensional volumes of ~1 μm voxel resolutions.
Histology
Histology is a standard and detailed way to relate mutant phenotypes to human disease. The principles of cellular pathology – based on the cell theory – serve as a foundation for modern medicine and tell us that disease processes are revealed by the study of tissues at cell resolutions [24, 46••]. Tissue sections allow us to identify a majority of cells, to determine whether and how cells and tissue may be abnormal, and to detect unusual cell types, foreign organisms, and/or unusual deposits or foreign matter. For example, the different possible causes of a human lung mass – types of cancer, a benign tumor, acute infection, chronic infection with a fungus, or foreign body reaction – can be easily distinguished by histology with no more than a standard hematoxylin and eosin stain. These distinctions are difficult to impossible without cell resolutions (pixels of about 1 μm2 or less), and motivate pathologist-driven quantitative histology for the mouse phenome project [47••].
Array technology facilitates histology for small fish [48•, 49•, 50], has been used for genetic screens [2], and greatly facilitated the creation of an online atlas by the Cheng lab’s atlas team at Penn State (www.zfatlas.psu.edu). Whole adults fit into a single cassette. Histology is a standard tool not only for human diagnosis [46••], but also for toxicity testing [51] and for the characterization of mouse mutants [52], facilitating comparisons between normal and diseased zebrafish [53], mice, and humans. These considerations make histology an essential tool for phenotypic screens, especially in support of translational research. The future development of automated and quantitative analysis of histological data may address the common absence of morphological data from systems biology analyses [54].
MicroCT
MicroCT is a tomographic technique by which a series of hundreds to over a thousand x-ray projection images are taken at each of multiple angles over at least 180° through a fixed, intact specimen, from which a 3-dimensional volume is computationally reconstructed [55•]. Contrast within the reconstructed volume is proportional to the attenuation of the X-rays that pass through the sample, and can be scaled by modulating the energy of the X-rays (measured in keV) and by altering the absorption of the sample using heavy metal stains (high atomic number, Z). MicroCT specimens can be left intact for reimaging as technology improves.
There are two types of microCT imaging relevant to the current discussion: commercial microCT and synchrotron-based microCT [Fig 1, reviewed by 56••]. Commercial scanners use a cone-beam imaging geometry in which polychromatic, low-flux X-rays emanate from a focal spot, whose size (“spot size”) is a tradeoff between resolution and X-ray flux. The so-called Feldkamp reconstruction algorithm converts a series of projection images generated by the scanner into stacks of aligned, digital, 2D slices. Isotropy of the voxels (cubic, rather than elongated rectangular shape) allows the digital volume to be viewed and re-sectioned in any orientation (e.g. coronal, sagittal, transverse, oblique) without loss of resolution. The size of the field of view is inversely proportional to resolution since any given length is distributed across the same number of pixels, so optimizing the balance between these factors is one of the challenges of this field. Cone beam microCT imaging achieves cell resolutions only for the smallest of animals, and at scanning speeds that extend over multiple hours. Only a portion of the X-ray spectrum in commercial X-ray tubes is of sufficient energy to traverse a larger specimen, contributing to artifact and longer scan times. Cone-beam microCT has been proposed as a potential high-throughput screening tool for phenotyping mouse embryos [57•], but neither the faster 27 μm voxel size scans, nor the alternative 8 μm voxel scans with a 6-fold slower scanning time will allow scoring of individual cell types. Even if commercial microCT reach cell resolutions for whole animals, their low X-ray flux is a barrier to throughput and their X-ray polychromicity precludes the use of phase contrast.
Figure 1. Comparison of Synchrotron Parallel Beam vs. Commercial Cone Beam MicroCT geometry.
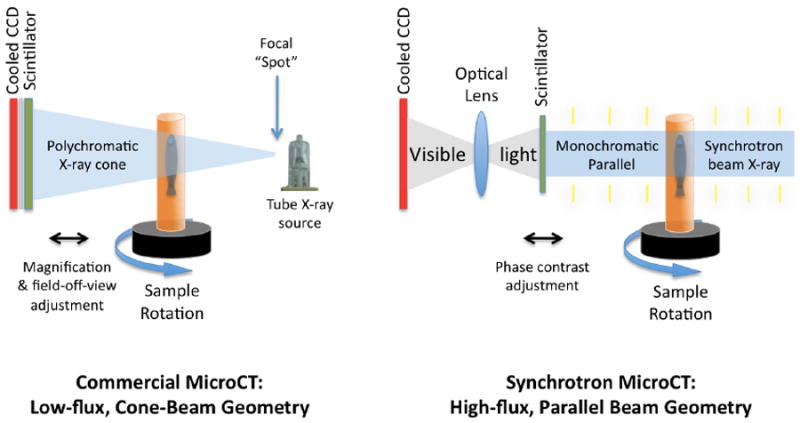
In cone beam microCT, the X-ray comes from a focal spot, for which diameter is inversely proportional to resolution and directly proportional to flux. The flux (brightness) is low. The cone shape of the beam allows magnification of the desired area by adjusting the relative position of the sample and scintillator to the focal spot, and can be used to focus a subarea of the specimen across the full area of the scintillator. These scintillators may be coupled by fiber optics to the cooled CCD. In synchrotron microCT, X-rays are of parallel geometry, monochromatic, phased, and of high flux. There is no geometric specimen magnification by the X-ray. Edge enhancement by phase contrast is made possible by phased monochromatic X-ray, and is adjusted by changing the sample-to-scintillator distance. The transmitted X-ray induces light in the scintillator, which is projected through optical lenses (e.g. 5x or 10x microscope objectives) whose magnification onto the cooled CCD determines optical magnification of the scintillator surface. For both types of microCT, the specimen is rotated over at least 180 degrees, commonly with one projection image taken every 0.1 to 0.3 degrees of rotation (yielding 1800 and 600 images, respectively).
Synchrotron microCT uses parallel-beam geometry and monochromatic, highly coherent X-rays [58• ] (Figure 1) whose energy can be customized to the size and composition of the subject. The coherence can be used for phase-contrast based edge enhancement, which is modulated by changing the distance between sample and sensor (Fig. 1) [56••, 58•]. Low-energy (“soft”) X-rays in the <1keV “water window” corresponding to the K shell absorption edges of carbon (284 eV) and oxygen (543 eV) can be used to image organelles within single cells within fields of view in the range of 15 μm [59•]. Higher-energy (“hard”) x-rays of 10 to 25 keV are needed to penetrate samples as large as zebrafish stained with a variety of heavy atoms whose absorption maxima lie within that higher range. The latter technology is available at third-generation synchrotrons such as the Advanced Photon Source at the U.S. Department of Energy’s Argonne National Labs in Argonne, IL, the European Synchrotron Radiation Facility in Grenoble, France, and Japan’s Spring-8. Their high flux (equivalent to brighter light in photography) allows for shorter exposure times, and therefore higher throughput. Unstained samples are scanned to image bone, as seen for a commercial scan of a zebrafish juvenile (Fig. 2). High-quality imaging of soft tissues requires the use of contrast agents containing heavy metals such as osmium, uranium, iodine, and tungsten [56, 60, 61•, 62••]. Increases in quantum efficiency and size of both scintillator and CCD chips, together with modifications to X-ray and light optics will bring us closer to the resolution, field of view, and speed needed for high-throughput imaging of zebrafish for the Zebrafish Phenome Project. Comparing results between microCT and histology will provide critical validation for each methodology, based on the 3D information content of microCT and the power of interspecies cross-referencing and availability of special stains in histology. Since microCT images have high resolution over the entire embryo, they may be a good scaffold with which to integrate data that lack anatomical context, or that have small fields of view.
Figure 2. Micron-Scale Computed Tomography (microCT).
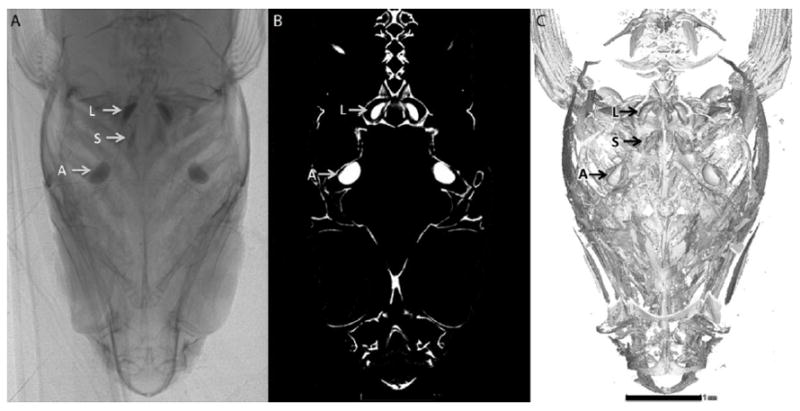
A series of processing steps allows 3D models to be generated from microCT data. Demonstrated here is the application of these steps to reconstruct a zebrafish’s skull and inner ear. (A) One of 600 x-ray projection images taken, over ~4 hours, through 180° of the head of an unstained, 60 dpf juvenile zebrafish wrapped in parafilm (one image every 0.3°). (B) One of 1500 digital, coronal 2D slices generated by applying the Feldkamp cone-beam reconstruction algorithm to these 600 images. (C) A screen-capture of part of a 3D model generated from these 1500 2D slices in a Volume Graphics software package known as VGStudio Max (Heidelberg, Germany). The arrows labeled L, S, and A, are the lapillus, sagitta, and asteriscus, which are found in the utricl, saccule, and lagena, respectively [67]. A similar comparison can be accessed at http://www.zfatlas.psu.edu/comparison.php?s[]=262&s[]=267&s[]=268. Scale bar, 1mm.
The zebrafish is the only well-developed vertebrate genetic model that is small enough to image the whole animal at cell resolutions using microCT. For existing chip dimensions of 2048 × 2048 pixels, assuming that animals can be scanned one section at a time at full width, resolution is limited by fields of view within which the width of the animal can fit (Table 4). The fields of view for synchrotron microCT at beamline 2-BM at Argonne National Laboratory are about 2.92 and 1.52 mm for 5x and 10x optics, respectively. Distributing 2048 pixels across those fields of view yields calculated voxel sizes on the order of about 0.753 and 1.43 μm for scans of larvae and juvenile zebrafish, respectively. This compares with pixel sizes of about 0.52, 12, and 22 μm associated with 20x, 10x and 5x magnification for scans of histological sections that were originally created at 0.252 μm pixel resolution with the model XT commercial scanner from Aperio technologies (Vista, CA; Cheng lab, unpublished). Presently, even the larger field of view at 2-BM is too small for mature mouse embryos of 8mm diameter.
Table 4.
Comparison of model system sizes.
| Structure | Greatest width (approximate)
|
|||||
|---|---|---|---|---|---|---|
| Human Adult | Mouse Adult | Mouse Embryo | Zebrafish Larva | Zebrafish Juvenile | Zebrafish Adult | |
| Body length | 180 cm | 7 cm | 15 mm | 4 mm | 14 mm | 3 cm |
| Body scanning width | 75 cm | 3.5 cm | 10 mm | *0.55 mm | *2.6 mm | 5.5 mm |
| Brain scanning width | 24 cm | 15 mm | 5.6 mm | 1 mm | 2 mm | 2 mm |
| Eye | 25 mm | 3.4 mm | 1.2 mm | 0.25 m | 1.1 mm | 2 mm |
| Red blood cell | 8 μm | 6.8 μm | 6.8 μm | 5 μm | 5 μm | 5 μm |
Challenges and Solutions
Image data from live and fixed fish need to be made available to the zebrafish community in a way that is integrated between morphological, behavioral and physiological assays and across model systems, including humans. Meeting this challenge will require the use of anatomic and phenotypic ontologies that cross model systems [9, 26, 42, 63], integration of data across imaging modalities [64], and integrating across multiple imaging modes, including those, such as electron microscopy, that will be used for more detailed study of detected cellular phenotypes [65]. Among the greatest deficiencies in phenomics today are 1) a shortage of annotators who have a wide range of knowledge of human and animal disease [66], 2) a high frequency of incorrect and inadequate phenotyping [8], and 3) a lack of a comprehensive set of tools for generating quantitative data associated with morphological abnormalities.
How critical is the challenge of throughput for the phenome project? Consider for the moment 10,000 mutant lines. Several ages need to be imaged per mutant, and at least 3 experimental and 3 control individuals imaged per age. For each animal tested, 3D reconstructions include thousands of slices through the animal in each orthogonal direction (transverse, coronal, and sagittal). A minimum analysis of just 15 images along one orientation yields 2,700,000 images (10,000 genes × 3 ages × 6 individuals per age × 15 slides/individual) for interpretation. Sample processing, sample loading, imaging, and computational reconstruction would have to keep up, and the rate of image analysis would be 2,700,000/(50 weeks/year × 5 days/week × 5 years) = 2,160 images per day. Even semi-quantitative assessment of morphological features used in pathology requires training, experience and reference materials. Pathologists are insufficient in number to interpret so many images, and variation in training, fatigue, and experience would be expected to introduce human error.
New computational methods for quantitative image analysis for both 2D histology and 3D analysis can ameliorate the problems of personnel and expertise. The translational relevance of interpretation is dependent upon medical and veterinary expertise. Individuals with that expertise know what types of patterns are important to use as diagnostic criteria, and those with some experience with programming or working with programmers know how to suggest realistic algorithms for software solutions. Likewise, programmers who can understand biological and pathologic vocabulary will more likely create usable solutions and make fewer errors caused by misunderstanding. Our experience in interdisciplinary environments supports the idea that individuals with cross-training in some combination of anatomy, pathology, model system genetics, programming, engineering and bioinformatics would likely be able to design and write high-throughput segmentation, pattern-recognition, morphometric, and analytical software with user-friendly interfaces for data mining and web-based community input (“crowdsourcing”). There is potential synergy between the computational approaches developed for histology, microCT, and live-animal imaging (Figure 3). We anticipate unique contributions to systems biology and that the derived tools will be usable across multiple model systems and fields of image-based inquiry.
Figure 3. Zebrafish Phenome Project Paradigm.
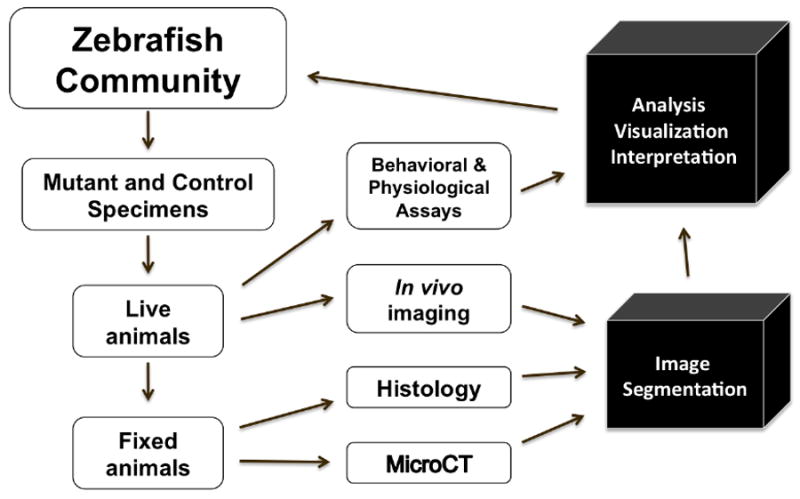
For the phenome project, mutant and control animals will be generated for live and fixed animal studies. The imaging data will benefit from segmentation software, as well as software to facilitate analysis, visualization, and integrated interpretation (black boxes). The output, as well as raw data, would then become available to the zebrafish and other research communities.
Acknowledgments
We acknowledge funding from NIH (R24RR017441, R01CA242956, and R01AR052535 to KC and RO1CA13468 to PLR). We also acknowledge encouragement and advice from Stephen Phillips (emeritus, Jefferson U), help with imaging on the Skyscan 1172 from Tim Sledz and Arun Tatiparthi of Micro Photonics (Allentown, PA), the work of Jean Copper and Steve Peckins in the Cheng lab, and discussions with G. Kindlmann at U Chicago, F. De Carlo and X Xiao of the Advanced Photon Source at the Argonne National Laboratory in Illinois, Sean Megason at Harvard, and Raghu Machiraju at Ohio State.
Footnotes
The term “zebrafish phenome project ” (http://www.blsmeetings.net/zebrafish/) is convenient. To distinguish phenotypes associated with gene deficiencies from those caused by diseases or chemicals, “zebrafish genetic phenome project”, while less practical, is more precise.
Publisher's Disclaimer: This is a PDF file of an unedited manuscript that has been accepted for publication. As a service to our customers we are providing this early version of the manuscript. The manuscript will undergo copyediting, typesetting, and review of the resulting proof before it is published in its final citable form. Please note that during the production process errors may be discovered which could affect the content, and all legal disclaimers that apply to the journal pertain.
References
- 1.Jeffery CJ. Multifunctional proteins: examples of gene sharing. Annals Med. 2003;35:28–35. doi: 10.1080/07853890310004101. [DOI] [PubMed] [Google Scholar]
- 2.Mohideen M-APK, Beckwith LG, Tsao-Wu GS, Moore JL, Wong ACC, Chinoy MR, Cheng KC. Histology-based screen for zebrafish mutants with abnormal cell differentiation. Dev Dyn. 2003;228:414–423. doi: 10.1002/dvdy.10407. [DOI] [PubMed] [Google Scholar]
- 3.Zou L, Sriswasdi S, Ross B, Missiuro PV, Liu J, Ge H. Systematic Analysis of Pleiotropy in C elegans Early Embryogenesis. PLoS Comput Biol. 2008;4:1–10. doi: 10.1371/journal.pcbi.1000003. [DOI] [PMC free article] [PubMed] [Google Scholar]
- 4.Larson TA, Gordon TN, Lau HE, Parichy DM. Defective adult oligodendrocyte and Schwann cell development, pigment pattern, and craniofacial morphology in puma mutant zebrafish having an alpha tubulin mutation. Developmental Biology. 2010;346:296–309. doi: 10.1016/j.ydbio.2010.07.035. [DOI] [PMC free article] [PubMed] [Google Scholar]
- 5.Wagner GP, Zhang J. The pleiotropic structure of the genotype-phenotype map: the evolvability of complex organisms. Nature Reviews Genetics. 2011;12:204–213. doi: 10.1038/nrg2949. [DOI] [PubMed] [Google Scholar]
- 6•.Lewontin RC. Genotype and phenotype. In: Keller EF, Lloyd E, editors. Keywords in Evolutionary Biology. Harvard University Press; 1992. pp. 137–144. This may be the first article using the term “phenome”. [Google Scholar]
- 7•.Mahner M, Kary M. What exactly are genomes, genotypes and phenotypes? And what about phenomes? J Theoretical Biol. 1996;186:55–63. doi: 10.1006/jtbi.1996.0335. This paper, containing a meticulous discussion of the definitions of genomes, genotypes and phenotypes, is a must-read by anyone interested in phenomics. [DOI] [PubMed] [Google Scholar]
- 8•.Butte AJ, Kohane IS. Creation and implications of a phenome-genome network. Nature Biotech. 2006;24:55–62. doi: 10.1038/nbt1150. This paper presents important considerations related to the study of phenomes. [DOI] [PMC free article] [PubMed] [Google Scholar]
- 9.Houle D, Govindaraju DR, Omholt S. Phenomes: the next challenge. Nature Rev Genetics. 2010;11:855–866. doi: 10.1038/nrg2897. [DOI] [PubMed] [Google Scholar]
- 10.Sozzani R, Benfrey PN. High-throughput phenotyping of multicellular organisms: finding the link between genotype and phenotype. Genome Biology. 2011;12:219. doi: 10.1186/gb-2011-12-3-219. ePub ahead of print. [DOI] [PMC free article] [PubMed] [Google Scholar]
- 11.Freimer N, Sabatti C. The human phenome project. Nature Genetics. 2003;34:15–21. doi: 10.1038/ng0503-15. [DOI] [PubMed] [Google Scholar]
- 12.Bogue MA, Grubb SC, Maddatu TP, Built CJ. Mouse Phenome Database (MPD) Nucl Acids Res. 2007;35:D643–D649. doi: 10.1093/nar/gkl1049. [DOI] [PMC free article] [PubMed] [Google Scholar]
- 13.Wen X-Y. Zebrafish: A renewed model system for functional genomics. Sci Found China. 2008;16:36–46. [Google Scholar]
- 14.Patton EE, Zon LI. The art and design of genetic screens: zebrafish. Nature Reviews Genetics. 2001;2:956–966. doi: 10.1038/35103567. [DOI] [PubMed] [Google Scholar]
- 15.Grunwald DJ, Eisen JS. Timeline: Headwaters of the zebrafish - emergence of a new model vertebrate. Nat Rev Genet. 2002;3:717–724. doi: 10.1038/nrg892. [DOI] [PubMed] [Google Scholar]
- 16.Amatruda JF, Shepard JL, Stern HM, Zon LI. Zebrafish as a cancer model system. Cancer Cell. 2002;3:229–231. doi: 10.1016/s1535-6108(02)00052-1. [DOI] [PubMed] [Google Scholar]
- 17.Gerhard GS. Small laboratory fish as models for aging research. Ageing Res Rev. 2007;6:64–72. doi: 10.1016/j.arr.2007.02.007. [DOI] [PubMed] [Google Scholar]
- 18.North TE, Zon LI. Modeling human hematopoietic and cardiovascular diseases in zebrafish. Dev Dyn. 2003;228:568–583. doi: 10.1002/dvdy.10393. [DOI] [PubMed] [Google Scholar]
- 19.Lieschke GJ, Currie PD. Animal models of human disease: zebrafish swim into view. Nat Rev Genet. 2007;8:353–367. doi: 10.1038/nrg2091. [DOI] [PubMed] [Google Scholar]
- 20.Ruffins SW, Jacobs RE, Fraser SE. Towards a Tralfamadorian view o the embryo: multidimensional imaging of development. Current Opin Neurobio. 2002;12:580–586. doi: 10.1016/s0959-4388(02)00366-5. [DOI] [PubMed] [Google Scholar]
- 21.St Johnson D. The art and design of genetic screens: Drosophila melanogaster. Nature Rev Genetics. 2002;3:176–188. doi: 10.1038/nrg751. [DOI] [PubMed] [Google Scholar]
- 22.Streisinger G, Walker C, Dower N, Knauber D, Singer F. Production of clones of homozygous diploid zebra fish (Brachydanio rerio) Nature. 1981;291:293–296. doi: 10.1038/291293a0. [DOI] [PubMed] [Google Scholar]
- 23.Lamason RL, Mohideen M-AP, Mest JR, Wong AC, Norton HL, Aros MC, Jurynec MJ, Mao X, Humphreville VR, Humbert, et al. SLC24A5, a putative cation exchanger, affects pigmentation in zebrafish and humans. Science. 2005;310:1782–1786. doi: 10.1126/science.1116238. Cloning of the zebrafish golden gene led to discovery of a coding polymorphism in humans responsible for much of the difference in skin color between West Africans and Europeans, through a fixed mutation in Europeans. This paper is a popular example of the unique contribution that zebrafish can make to our understanding human biology. [DOI] [PubMed] [Google Scholar]
- 24••.Virchow R. Die Cellular Pathologie. Berlin: August Hirschwald; 1858. A foundational document in the history of science and medicine, establishing the principle that the morphology of cells contribute critically to an understanding of abnormal function. [Google Scholar]
- 25.Dabbs DJ. Diagnostic Immunohistochemistry: Theranostic and Genomic Applications. Saunders; 2010. [Google Scholar]
- 26.Maitland KC, Saldua M, Olsovsky C. Extended Field of View Confocal Microscopy. Bio-Optics: Design and Application, OSA Technical Digest (CD) (Optical Society of America, 2011), paper JTuA15. http://www.opticsinfobase.org/abstract.cfm?URI=BODA-2011-JTuA15.
- 27•.Megason SG, Fraser SE. Digitizing life at the level of the cell: high-performance laser-scanning microscopy and image analysis for in vivo imaging of development. Mech Dev. 2003;120:1407–1420. doi: 10.1016/j.mod.2003.07.005. This is a scholarly work describing the history of imaging with a focus on in vivo imaging. The paper reviews the state of the art, including power and limitations of confocal (including two-photon) imaging, and the range of commercial and academic software for analysis of 4D datasets. The paper contains compelling confocal-based 4D images, the first discussion of “in toto” imaging of multicellular organisms, including the zebrafish, and how it can be expected to benefit systems biology. [DOI] [PubMed] [Google Scholar]
- 28•.Huisken J, Swoger J, Del Bene F, Wittbrodt J, Stelzer EHK. Optical Sectioning Deep Inside Live Embryos by Selective Plane Illumination Microscopy. Science. 2004;305:1007–1009. doi: 10.1126/science.1100035. This paper reviews alternative methods of 3D imaging of large samples, describes the use of sheet-based microscopy, called SPIM here, as performed on GFP medaka (skeletal/cardiac muscle) and Drosophila (moesin) [DOI] [PubMed] [Google Scholar]
- 29•.Keller PJ, Schmidt AD, Wittbrodt J, Stelzer EHK. Reconstruction of Zebrafish Early Embryonic Development by Scanned Light Sheet Microscopy. Science. 2008;322:1065–1069. doi: 10.1126/science.1162493. This is the first reported use of light sheet microscopy for zebrafish, and contains some striking movies of zebrafish development. [DOI] [PubMed] [Google Scholar]
- 30.Olivier N, Luengo-Oroz MA, Duloquin L, Faure E, Savy T, Veilleux I, Solinas X, Debarre D, Bourgine P, Santos A, et al. Cell lineage reconstruction of early zebrafish embryos using label-free nonlinear microscopy. Science. 2010;329:967–971. doi: 10.1126/science.1189428. [DOI] [PubMed] [Google Scholar]
- 31•.Pardo-Martin C, Chang TY, Koo BK, Gilleland CL, Wasserman SC, Yanik MF. High-throughput in vivo vertebrate screening. Nat Methods. 2010;7:634–636. doi: 10.1038/nmeth.1481. This paper describes a fascinating chip-based screening method was developed for zebrafish. [DOI] [PMC free article] [PubMed] [Google Scholar]
- 32•.Petzold AM, Bedell VM, Boczek NJ, Essner JJ, Balciunas D, Clark KJ, Ekker SC. SCORE imaging: specimen in a corrected optical rotational enclosure. Zebrafish. 2010;7:149–154. doi: 10.1089/zeb.2010.0660. A description of a capillary imaging-based method based on a plastic tubing that has a refractive index close to that of water. Updated versions of this method will form the basis of future imaging of transgenic mutants mutagenized with a fluorescent-gene containing gene breaking transposon. [DOI] [PMC free article] [PubMed] [Google Scholar]
- 33.Wielhouwer EM, Ali S, Al-Afandi A, Blom MT, Olde Riekerink MB, Poelma C, Westerweel J, Oonk J, Vrouwe EX, Buesink W, et al. Zebrafish embryo development in a microfluidic flow-through system. Lab Chip. 2011;11:1815–1824. doi: 10.1039/c0lc00443j. [DOI] [PubMed] [Google Scholar]
- 34.Temkin B, Acosta E, Malvankar A, Vaidyanath S. An interactive three-dimensional virtual body structures system for anatomical training over the internet. Clin Anat. 2006;19:267–274. doi: 10.1002/ca.20230. [DOI] [PubMed] [Google Scholar]
- 35.Rosenthal J, Mangal V, Walker D, Bennett M, Mohun TJ, Lo CW. Rapid high resolution three dimensional reconstruction of embryos with episcopic fluorescence image capture. Birth Defects Res Part C: Embryo Today: Reviews. 2004;72:213–289. doi: 10.1002/bdrc.20023. [DOI] [PubMed] [Google Scholar]
- 36.Yamada S, Samtani RR, Lee ES, Lockett E, Uwabe C, Shiota K, Anderson SA, Lo CW. Developmental Atlas of the Early First Trimester Human Embryo. Dev Dyn. 2009;239:1585–1595. doi: 10.1002/dvdy.22316. [DOI] [PMC free article] [PubMed] [Google Scholar]
- 37.Roy D, Steyer GJ, Gargesha M, Stone ME, Wilson DL. 3D Cryo-Imaging: A Very High-Resolution View of the Whole Mouse. Anat Rec: Adv Integrative Anat & Evol Biol. 2009;292:342–351. doi: 10.1002/ar.20849. [DOI] [PMC free article] [PubMed] [Google Scholar]
- 38.Benveniste H, Blackband S. MR microscopy and high resolution small animal MRI: applications in neuroscience research. Prog Neurobiol. 2002;67:393–420. doi: 10.1016/s0301-0082(02)00020-5. [DOI] [PubMed] [Google Scholar]
- 39.Petiet AE, Kaufman MH, Goddeeris MM, Brandenburg J, Elmore SA, Johnson GA. High-resolution magnetic resonance histology of the embryonic and neonatal mouse: A 4D atlas and morphologic database. Proc Natl Acad Sci. 2010;105:12331–12336. doi: 10.1073/pnas.0805747105. [DOI] [PMC free article] [PubMed] [Google Scholar]
- 40.Kabli S, Alia A, Spaink HP, Verbeek FJ, De Groot HJM. Magnetic Resonance Microscopy of the Adult Zebrafish. Zebrafish. 2006;3:431–439. doi: 10.1089/zeb.2006.3.431. [DOI] [PubMed] [Google Scholar]
- 41•.Bryson-Richardson RJ, Berger S, Schilling TF, Hall TE, Cole NJ, Gibson AJ, Sharpe J, Currie PD. FishNet: an online database of zebrafish anatomy. BMC Biol. 2007;5:34–41. doi: 10.1186/1741-7007-5-34. This paper describes an impressive effort that resulted in a detailed web-based atlas of the zebrafish using OPT. [DOI] [PMC free article] [PubMed] [Google Scholar]
- 42.Vinegoni C, Fexon L, Fumene-Feruglio P, Pivovarov M, Figueiredo J-L, Nahrendorf M, Pozzo A, Sbarbati A, Weissleder R. High Throughput Transmission Optical Projection Tomography Using Low Cost Graphics Processing Unit. Optics Express. 2010;17:22320–22332. doi: 10.1364/OE.17.022320. [DOI] [PMC free article] [PubMed] [Google Scholar]
- 43.McGinty J, Taylor HB, Chen L, Bugeon L, Lamb JR, Dallman MJ, French PMW. In vivo fluorescence lifetime optical projection tomography. Biomed Opt Ex[51-53]press. 2011;2:1340–1350. doi: 10.1364/BOE.2.001340. [DOI] [PMC free article] [PubMed] [Google Scholar]
- 44.Zhang H, Maslov K, Stoica G, Wang LV. Functional photoacoustic microscopy for high-resolution and noninvasive in vivo imaging. Nat Biotechnol. 2006;24:848–851. doi: 10.1038/nbt1220. A general introduction of functional photoacoustic microscopy. [DOI] [PubMed] [Google Scholar]
- 45•.Ntziachristos V. Going deeper than microscopy: the optical imaging frontier in biology. Nature Methods. 2010;7:603–614. doi: 10.1038/nmeth.1483. An excellent recent review of in vivo imaging methods, including optoacoustic imaging, many of which have been used for zebrafish. [DOI] [PubMed] [Google Scholar]
- 46••.Kumar K, Abbas AK, Fausto N, Aster J. Robbins & Cotran: Pathologic Basis of Disease. Saunders; 2010. This is the most commonly used textbook of pathology for medical students, surveys known causes and cellular mechanisms of human disease, and covers the principles of anatomic pathology that underlie the value of whole-animal imaging at cell resolution. [Google Scholar]
- 47••.Sundberg JP, Sundberg BA, Schofield P. Integrating mouse anatomy and pathology ontologies into a phenotyping database Tools for data capture and training. Mamm Genome. 2008;19:413–419. doi: 10.1007/s00335-008-9123-z. It is proposed here that mouse databases of phenotypes contain photomicrographic data and quantitation of histological phenotypes, graded by pathologists. [DOI] [PMC free article] [PubMed] [Google Scholar]
- 48•.Tsao-Wu GS, Weber CH, Budgeon LR, Cheng KC. Agarose embedded tissue arrays for histologic and genetic analysis. Biotechniques. 1998;25:614–618. doi: 10.2144/98254st02. This is a description of the first genetic screen based on histology in a vertebrate; four out of six mutations detected affected more than one organ system. [DOI] [PubMed] [Google Scholar]
- 49•.Sabaliauskas NA, Foutz CA, Mest JR, Budgeon LR, Sidor A, Gershenson J, Joshi S, Cheng KC. High-throughput zebrafish histology. Methods. 2006;39:246–254. doi: 10.1016/j.ymeth.2006.03.001. This is a summary of histology methods for zebrafish, including fixation and larval arrays, with a trouble-shooting guide. [DOI] [PubMed] [Google Scholar]
- 50.Cheung NKM, Hinton DE, Au DWT. Development of high-throughput embryo histoarray for quantitative molecular profiling in uniformly orientated medaka (Oryzias latipes) embryos. Comp Biochem Physiology C Toxicology Pharmacology. 2011 doi: 10.1016/j.cbpc.2011.05.010. In Press. [DOI] [PubMed] [Google Scholar]
- 51.Di Giulio RT, Hinton DE, editors. The Toxicology of Fishes. CRC Press; 2008. [Google Scholar]
- 52.Sundberg JP, Boggess D. Systematic Approach to Evaluation of Mouse Mutations. CRC Press; 1999. [Google Scholar]
- 53.Menke AL, Spitsbergen JM, Wolterbeek APM, Woutersen RA. Normal anatomy and histology of the adult zebrafish. Tox Path. 2011;000:1–16. doi: 10.1177/0192623311409597. [DOI] [PubMed] [Google Scholar]
- 54.Kherlopian AR, Song T, Duan Q, Neimark MA, Po MJ, Gohagan JK, Laine AF. A review of imaging techniques for systems biology. BMC Systems Biol. 2008;2:71–82. doi: 10.1186/1752-0509-2-74. [DOI] [PMC free article] [PubMed] [Google Scholar]
- 55•.Stock SR. MicroComputed Tomography: Methodology and Applications. CRC Press; 2009. An excellent book overview of microCT. [Google Scholar]
- 56••.Betz O, Wegst U, Weide D, Heethhoff M, Helpen L, Lee WK, Cloetens P. Imaging applications of synchrotron X-ray phase-contrast microtomography in biological morphology and biomaterials science. I. General aspects of the technique and its advantages in the analysis of millimetre-sized arthropod structure. J Microscopy. 2007;227:51–71. doi: 10.1111/j.1365-2818.2007.01785.x. This paper clearly describes the differences between types of microCT and compares synchrotron microCT with histology. Also cored are technical issues and concepts including energy, flux, scintillators, light vs. x-ray optics, the relative roles of absorption and phase contrast, factors that go into resolution, visualization software, and shows results of state-of-the-art imaging at ID 19 at the ESRF in Grenoble as of 2007, in the course of studying osmium-stained microarthropods. [DOI] [PubMed] [Google Scholar]
- 57•.Johnson JT, Hansen MS, Wu I, Healy LJ, Johnson CR, Jones GM, Capecchi MR, Keller C. Virtual histology of transgenic mouse embryos for high-throughput phenotyping. PLoS Genet. 2006;2:0471–0477. doi: 10.1371/journal.pgen.0020061. This is a first demonstration of the potential of microCT for high-throughput phenotyping. Midgestation, osmium-stained mice were imaged in a GE small animal scanner for ~12 and 2 hours, at 8 and 27 μm resolutions respectively. Transgenic neural phenotypes were detected. Common usage of the term “histology” assumes an ability to visualize and to type individual cells, which is not possible as used here. [DOI] [PMC free article] [PubMed] [Google Scholar]
- 58•.La Riviere PJ, Clark D, Rojek A, Vargas P, Xiao X, DeCarlo F, Kindlmann G, Cheng K. Optimizing synchrotron micro-CT for high-throughput phenotyping of zebrafish Developments in X-ray Tomography VII. In: Stock SR, editor. Proc of SPIE. Vol. 7804. 2010. pp. 1–8. This paper discusses issues related to the optimization of high throughput synchrotron micro-CT of zebrafish, including the use of phase contrast. [Google Scholar]
- 59•.Larabell CA, Nugent KA. Imaging cellular architecture with X-rays. Curr Opin Struct Biol. 2010;20:623–631. doi: 10.1016/j.sbi.2010.08.008. This paper reviews the history, methods and technological details of 3D reconstruction methods in the ultrastructural range covered by electron microscopic tomography and cryo-nanoCT, including their own work with soft X-ray tomography of yeast. [DOI] [PMC free article] [PubMed] [Google Scholar]
- 60.Mizutani R, Takeuchi A, Uesugi K, Takekoshi S, Osamura RY, Suzuki Y. X-Ray Microtomographic Imaging of Three-Dimensional Structure of Soft Tissues. Tissue Eng Part C Methods. 2008;14:359–363. doi: 10.1089/ten.tec.2008.0274. [DOI] [PubMed] [Google Scholar]
- 61•.Metscher BD. MicroCT for developmental biology: A versatile tool for high-contrast 3D imaging at histological resolutions. Dev Dyn. 2009;238:632–640. doi: 10.1002/dvdy.21857. This paper describes imaging of chick embryos using different soft-tissue stains, using the commercial MicroXCT from Xradia Inc. [DOI] [PubMed] [Google Scholar]
- 62••.Metscher MicroCT for comparative morphology: simple staining methods allow high-contrast 3D imaging of diverse non-mineralized animal tissues. BMC Physiol. 2009;9:11–25. doi: 10.1186/1472-6793-9-11. This is another microCT paper demonstrating use of commercial microCT with soft-tissue stains imaging by tomographic X-ray imaging of a fascinating array of aquatic and land animals. The potential power of the magnification possible using cone-beam commercial microCT is illustrated with a 300 can get cell resolutions. [DOI] [PMC free article] [PubMed] [Google Scholar]
- 63.Vasquez SX, Hansen MS, Bahadur AN, Hockin MF, Kindlmann GL, Nevell L, Wu IQ, Grunwald D, Weinstein DM, Jones GM, et al. Optimization of volumetric computed tomography for skeletal analysis of model genetic organisms. Anat Rec. 2008;291:475–487. doi: 10.1002/ar.20670. [DOI] [PMC free article] [PubMed] [Google Scholar]
- 64.Neues F, Arnold WH, Fischer J, Beckmann F, Gaengler P, Epple M. The skeleton and pharyngeal teeth of zebrafish (Danio rerio) as a model of biomineralization in vertebrates. Mat-wiss u Werkstofftech. 2006;37:427–431. [Google Scholar]
- 65.Schieber NL, Nixon SJ, Webb RI, Oorschot VMJ, Parton RG. Modern approaches for ultrastructural analysis of the zebrafish embryo. Chapter 18. Methods Cell Biol. 2010;96:425–442. doi: 10.1016/S0091-679X(10)96018-4. [DOI] [PubMed] [Google Scholar]
- 66.Barthold S, Borowsky A, Brayton C, Bronson R, Cardiff R, Griffey S, Ince T, Nitikin A, Sundberg J, Valli V. From whence will they come? A perspective on the acute shortage of pathologists in biomedical research. J Vet Diag Invest. 2007;19:455–456. doi: 10.1177/104063870701900425. [DOI] [PubMed] [Google Scholar]
- 67.Platt C. Zebrafish inner ear sensory surfaces are similar to those in goldfish. Hearing Res. 65:133–140. doi: 10.1016/0378-5955(93)90208-i. [DOI] [PubMed] [Google Scholar]