Abstract
The strain image contrast of some in vivo breast lesions changes with increasing applied load. This change is attributed to differences in the nonlinear elastic properties of the constituent tissues suggesting some potential to help classify breast diseases by their nonlinear elastic properties. A phantom with inclusions and long-term stability is desired to serve as a test bed for nonlinear elasticity imaging method development, testing, etc. This study reports a phantom designed to investigate nonlinear elastic properties with ultrasound elastographic techniques. The phantom contains four spherical inclusions and was manufactured from a mixture of gelatin, agar and oil. The phantom background and each of the inclusions has distinct Young’s modulus and nonlinear mechanical behavior. This phantom was subjected to large deformations (up to 20%) while scanning with ultrasound, and changes in strain image contrast and contrast-to-noise ratio (CNR) between inclusion and background, as a function of applied deformation, were investigated. The changes in contrast over a large deformation range predicted by the finite element analysis (FEA) were consistent with those experimentally observed. Therefore, the paper reports a procedure for making phantoms with predictable nonlinear behavior, based on independent measurements of the constituent materials, and shows that the resulting strain images (e.g., strain contrast) agrees with that predicted with nonlinear FEA.
Keywords: elastography, phantoms, nonlinear hyperelasticity, finite element methods
1. Introduction
Elastography is an imaging technique that estimates elastic parameters of materials and soft tissues. This modality is typically implemented with either ultrasound (Ophir et al 1991) or MRI (Muthupillai et al 1995). Most of the work in this field deals with small amplitude deformations (dynamic or quasi-static). Therefore, essentially linear elastic behavior is assumed. However, most biological tissues demonstrate nonlinear stress-strain relationships for sufficiently large deformations (Fung 1993) and there is evidence suggesting that nonlinear behavior is unique to breast tissue type (including tumors).
The initial investigations of breast tissue elasticity (Krouskop et al 1998, Wellman 1999) demonstrated that different breast tissues and tumors present distinguishable nonlinear stress-strain relationships (hereafter we refer to the nonlinear stress-strain relation as to elastic nonlinearity). Wellman (1999) evaluated breast tissue samples with an indentation test applying up to 10% strain. They found, for example, that fibroadenoma and invasive ductal carcinoma (IDC) have similar elastic moduli, but differ regarding the elastic nonlinearity. Krouskop et al (1998) measured the Young’s modulus of breast tissues by pre-loading the samples at 1% and 20% strain. The percent change in stiffness in their case was also larger for the malignant tissues when compared to benign tumors, glandular and fat tissues. More recently, Samani’s group has done extensive work (O’Hagan and Samani 2009) to determine hyperelastic properties of ex vivo breast tissue samples. Several hyperelastic models were used to fit the stress-strain curves, and the parameters obtained from each model were statistically compared. The results provided in these ex vivo studies strengthens the hypothesis that tissue nonlinearity might be a new parameter for breast lesion differentiation.
There are also reports in the literature of simulations and experiments investigating the effects of elastic nonlinearity on elasticity imaging. For example, Varghese et al (2000) simulated strain images using an analytical plane strain approach to evaluate change in contrast and contrast-to-noise ratio (CNR) due to the increase in the Young’s modulus with the applied deformation for either the inclusion or the background. They indicated that the CNR could be enhanced or diminished depending on the deformation between a pair of frames or the preload applied.
Skovoroda et al (1999) attempted to differentiate materials based on the nonlinear stress-strain analysis, but assumed intrinsic material linear stress-strain behavior under large deformations. Erkamp et al (2004a) recognized that the strain contrast between the parts of a phantom with distinct nonlinear behavior changed for increasing applied strain. They used stress-strain data as input to nonlinear finite element analysis (FEA) to compare simulated ultrasonic strain images with their phantom data. Nitta and Shiina (2002a) obtained a nonlinear parameter of tissues embedded in gelatin phantoms using strains up to 20%. They assumed the stress-strain curve to be exponential and transformed the values of strain obtained into Young’s modulus through FEA implementation using the incremental surface pressure obtained with a pressure sensor. In related work, Nitta and Shiina (2002b) created “nonlinear elasticity” images that show tissue nonlinear stiffening by assuming stress is uniaxial and constant, and the stress-strain law is quadratic. Thus their images may be thought of as rescaled strain-slope images.
Hall et al (2003) provided the first clear in vivo evidence for differential nonlinear stiffening among tissues by demonstrating changing contrast of some in vivo breast lesions with increasing applied load and attributing those changes to differences in the nonlinear elastic properties of the constituent tissues. The work of Oberai et al (2009) was the first in vivo attempt to differentiate breast tissues, based on estimates of their nonlinear behavior, using ultrasound strain images at lower (1%) and higher (10%) preload. One example of fibroadenoma and one of invasive ductal carcinoma were presented, and the secant moduli and nonlinearity obtained through the reconstruction were similar to results from mechanical tests of excised tissue samples from other work (Krouskop et al 1998). In Oberai et al (2009), the authors recommended that higher values of overall strain, perhaps at least 20%, should be employed (compared to that presented in their study). The problem they noted is that, assuming the tumor is stiffer than surrounding healthy tissues, the background media will deform much more than the tumor resulting in small deformation of the tumor itself, and that makes it difficult to estimate the nonlinearity parameter of the tumor. The inverse reconstruction in Oberai et al (2009) used the algorithm proposed by Gokhale et al (2008) that measure the nonlinear parameter obtained from the Veronda-Westmann hyperelastic model (Veronda and Westmann 1970). Their approach is robust since it is an inverse problem based on the mechanical constitutive laws, and displacement data at low and high applied strain.
Acoustic radiation force experiments have also been used to investigate elastic nonlinearity. Measurements of the speed of shear waves propagating in phantoms with different levels of initial deformation was also reported as a means of estimating the nonlinear behavior of those materials (Catheline et al 2003). Sinkus et al (2006) studied the second harmonics of the time-dependent shear displacement in an attempt to extract nonlinear behavior, but their work involved very small deformations where the differences in nonlinear behavior among tissues appears to be quite small.
A useful approach to characterizing and “optimizing” methodologies for studying nonlinear tissue elasticity is through tissue-mimicking phantom experiments. The phantom reported in Erkamp et al (2004a) was composed of an upper part made of plain gelatin which has linear elastic behavior at large (≤ 20%) strain (Hall et al 1997, Pavan et al 2010) and the bottom part of plain agar which has nonlinear elastic behavior at large strain (Hall et al 1997, Pavan et al 2010). Plain agar is a brittle material meaning that it is inclined to crack when subjected to relatively large deformations, as was recognized in Erkamp et al (2004a). To overcome this limitation, the authors came up with a creative geometry so the phantom would not crack at modest (i.e., 12%) deformation. A larger problem is that pure agar and pure gelatin do not bond well to each other. Although Erkamp’s study demonstrated the change in strain image contrast with applied deformation due to differences in nonlinear behavior, theirphantom materials and manufacturing methods are unsatisfactory due to likely long-term instability in water content among the phantom components (water will likely migrate from the agar to the gelatin resulting in swelling of the gelatin and changing the elastic properties of both materials) and poor bonding between components resulting in separation of the ‘target’ from the ‘background’ at high stress points. Largely due to the presence of complex motion at interfaces among components and the irregular geometry, Erkamp’s results were only qualitatively similar to finite element simulation, though their results were sufficient for proof of concept.
Poly(vinyl alcohol) cryogels (PVA-C) are materials which can have mechanical and acoustic parameters similar to the tissue, and have been employed to manufacture ultrasound phantoms (Surry et al 2004, King et al 2011). The degree of nonlinearity and small strain shear modulus depend on complex function of the polymer concentration, number of freeze-thaw cycles, and thawing rate (Pazos et al 2009). Therefore, PVA-C has potential as a candidate material for elasticity imaging phantoms. The drawback of using PVA-C in manufacturing a heterogeneous phantom, as pointed by Mehrabian et al (2010), is the difficulty of controlling its properties, since the temperature distribution within the phantom during the multiple freeze-thaw cycles depends on phantom geometry. Therefore, the final hyperelastic properties will also depend on the geometry, and for larger phantoms nonuniformity is likely.
Given the effort required to produce a complex nonlinear elastic phantom, it is important that the materials exhibit long-term stability, bond well to each other and that it is possible to independently manipulate their acoustic and nonlinear elastic properties. Ideally, these properties can be adjusted to mimic tissue, such as normal and abnormal breast, and can be manufactured into anthropomorphic shapes, like breasts, to adequately challenge elasticity imaging systems. The development of the prototype materials has been reported (Pavan et al 2010). These materials are mixtures of agar and gelatin gels and oil droplet dispersions are used to provide further control of the small-strain shear modulus and the nonlinear parameter of the material. The main goal of the present paper is to demonstrate the use of these materials (Pavan et al 2010) to manufacture a phantom containing spherical targets with predictable nonlinear behavior. The phantom was subject to large deformations (up to 20%) while scanning with ultrasound, and the resulting strain images agree with those predicted with nonlinear 3D-FEA in a quantitative analysis.
2. Materials and methods
2.1. Phantom production
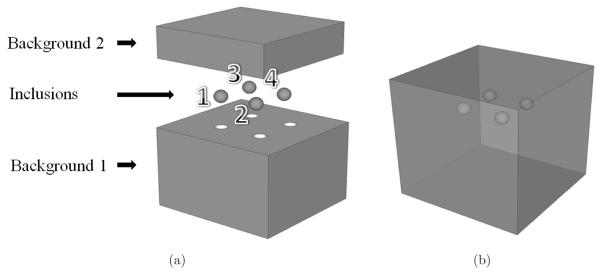
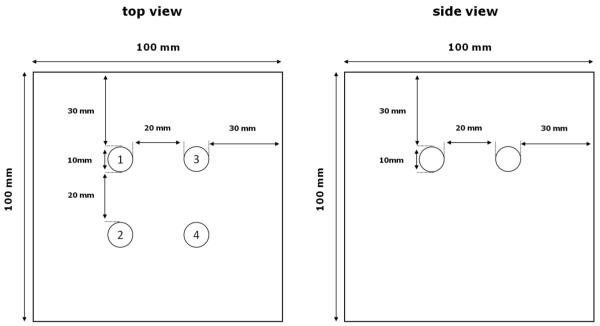
Methods to manufacture phantoms containing spherical inclusions arranged in a coplanar array were previously developed and reported (Kofler et al 2001, Madsen et al 2005b). The present work employed these techniques to produce a phantom containing four spherical inclusions reliably bonded to the background material. Each of these spheres was manufactured using a different gel composition, resulting in inclusions with unique stiffness and nonlinearity. To accomplish this, the background was manufactured in two steps, on consecutive days, and the parts composing it have the same material composition. Figure 1(a) shows a 3D depiction of the parts which compose the phantom and figure 1(b) shows its final visualization. The upper part of the background is denoted as “Background 2” and the bottom part as “Background 1”. Figure 2 shows diagrams of the phantom geometry.
Figure 1.
Three dimensional depiction of the phantom. (a) Parts that composed the phantom; (b) the phantom in its final form.
Figure 2.
Diagram showing the phantom geometry.
The background material is an agar-gelatin mixture containing 60% agar solution and 40% gelatin solution, by volume. The agar-gelatin materials composing the inclusions were manufactured employing the same gelatin concentration (2.93% byweight) as the background. Maintaining uniform gelatin concentration prevents osmotic effects from causing water absorption or loss by the spheres (Madsen et al 1991). The agar-gelatin materials were produced according to the method previously described (Madsen et al 2005a).
One sphere (inclusion 1 in table 1) is a dispersion of oil droplets in the agar-gelatin material (50% oil by volume), while the other three spheres contain no oil and differ from the background material in dry weight agar concentration. Formalin, which is 37% formaldehyde, was added for cross linking the gelatin consequently increasing its melting point and stiffness (Hall et al 1997). Liquid Germall-Plus® (International Specialty products, Wayne, NJ, USA) was added (1.5 g/100 mL solution) to prevent fungal and bacterial contamination. Glass beads were used in the materials containing no oil dispersions as acoustic scattering sources, increasing, therefore, ultrasonic attenuation and backscatter. The weight percents of the component materials in the phantom are shown in table 1.
Table 1.
The composition of the agar-gelatin (in weight percent) used to make the phantom background and the four spherical inclusions. In all of these materials, the weight percent of gelatin is 2.93%, of formalin is 0.15%, and of Germall-Plus is 1.45%. Note that the table does not include 2.7cc (liquid) Ultra Ivory® detergent (Procter and Gamble, Cincinnati, Ohio, USA) per liter of the agar-gelatin (plus 50% oil, by volume, in inclusion 1).
| Sample | Agar (%) | Glass beads (%) |
|---|---|---|
| Background | 0.58 | 0.19 |
| Inclusion 1 | 2.24 | 0 |
| Inclusion 2 | 1.32 | 0.39 |
| Inclusion 3 | 1.09 | 0.39 |
| Inclusion 4 | 0.92 | 0.39 |
To manufacture the inclusion 1, the agar-gelatin gel was poured into safflower oil and gently stirred with an appropriate spoon. A surfactant (Ultra Ivory ® - Proctor and Gamble Company, Cincinnati, OH, USA) was added so that emulsification was sufficient to produce microscopic oil droplets that would not separate from the aqueous gel during either the congealing process or experiments. For more details on the production of these oil-in-gel materials, the reader is encouraged to consult (Madsen et al 2003, 2005b).
At the time of production of each material in the phantom, a cylindrical test sample of that material was also made for independent quasi-static mechanical measurements of elastic properties. The cylinders are 2.6 cm in diameter and 1.0 cm in height.
The phantom was created using information about the nonlinear behavior of agar-gelatin mixtures and agar-gelatin with oil emulsification (Pavan et al 2010), and manufactured following procedures to assure predictable elastic properties and reliable bonding between the parts composing it (Madsen et al 2005a, Madsen et al 2003).
Agar gel is a three dimensional crosslinked network formed during its congealing process. The network is formed by double helix fibrils that are connected to each other (Labropoulos et al 2002). This structure is related to the the agar gel rheological characteristics (Labropoulos et al 2002) and intrinsic hyperelasticity (Pavan et al 2010). In gelatin-agar mixtures, increasing the agar concentration does not greatly affect the nonlinear behavior (Pavan et al 2010) but increases the small-strain shear modulus (Hall et al 1997). The oil dispersion material decreases both the nonlinear behavior (Pavan et al 2010) and the Young’s storage modulus (Madsen et al 2003, Pavan et al 2010) of the material. Inclusion 1 was manufactured to be stiffer than the background at small deformations and present a lower nonlinear behavior. The other inclusions were manufactured to be stiffer than the background but with similar nonlinear behavior.
The phantom contains four spherical inclusions each with distinct Young’s modulus and, unlike the phantom reported by (Erkamp et al 2004a), each with nonlinear mechanical behavior that is different from that of the background material. This phantom was undamaged following large deformations (up to 20%) while scanning with ultrasound, and strain image contrast, and contrast-to-noise ratio (CNR) changes were investigated as a function of applied deformation.
2.2. Elastic measurements
Quasi-static mechanical tests were performed on each of the test cylinders representing phantom component materials. An EnduraTEC 3200 ELF system (EnduraTEC Systems Corporation, Minnetonka, MN, USA) with a 1kg load cell and Teflon® platens (larger than the sample surface) was employed. Cyclic 1 Hz compressive loading was applied parallel to the cylinder axis. The same oil used to store the materials was used to lubricate the platens during the tests to minimize friction between the platens and the sample.
After the upper platen established contact with the sample, the platen was lowered to the mean level of oscillation amplitude at a rate of 0.04 mm/s. The platen remained at the mean level for 5 s. In the next step, the sample underwent a sinusoidal compression at the desired amplitude and frequency for 5 s before starting data acquisition. These procedures were done to “precondition” the sample (Fung 1993, Hall et al 1997) and obtain consistent load-displacement measurements. Force and displacements data were then acquired.
These data were used as input to the FEA simulation, as described in Appendix A. The loading cycle of the stress-strain curve was chosen for this purpose. Large oscillatory deformations (compressions up to 25%) were employed to determine the elastic nonlinear properties of each material.
2.3. Phantom experiment
To evaluate the change in contrast and CNR with applied deformation, radiofrequency (RF) echo data were acquired during uniaxial loading and unloading of the phantom. This deformation was performed using a compression plate attached to the ultrasound transducer with the transducer active elements lying in the plane of the contact surface of the compression plate (see figure 3). The plate extended beyond the top surface of the phantom during the loading and unloading. The bottom of the phantom rested on a fixed plate parallel to the compression plate. The center of the ultrasound image field was located over one of the spheres and the data acquisition procedure was repeated for each sphere. Deformations of up to 20% of the phantom initial height were employed. The frame rate was adjusted to acquire frames every (approximately) 1.5% incremental deformation, during a load-unload cycle.
Figure 3.
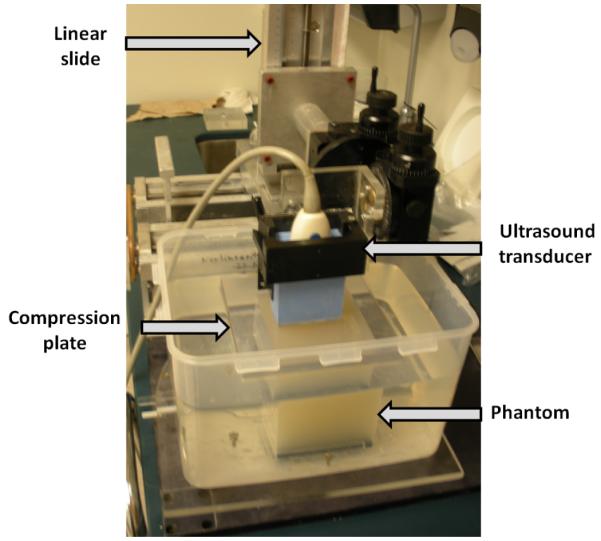
Photograph of the experimental setup to obtain the RF echo data during loading and unloading of the phantom.
The experiment was performed using a Siemens SONOLINE Antares (Siemens Medical Solutions USA, Inc. Malvern, PA) ultrasound scanner, which has a 40MHz sampling rate, using the VFX9-4 linear array excited with 8.89MHz pulses.
2.3.1. Incremental displacement and strain estimation
The motion experienced by a specific region of the phantom between a pair of frames of RF echo signals was estimated using a modified block matching motion tracking algorithm (Jiang and Hall 2007). Incremental axial (parallel to the ultrasound beam direction) strain was calculated using linear regression windows to estimate the gradient of the displacement map (Kallel and Ophir 1997). The motion was calculated between pairs of frames separated by approximately 1.5% frame-average strain. This frame pairing strategy has been shown to work very well for motion tracking in phantoms and soft tissues (Jiang et al 2007).
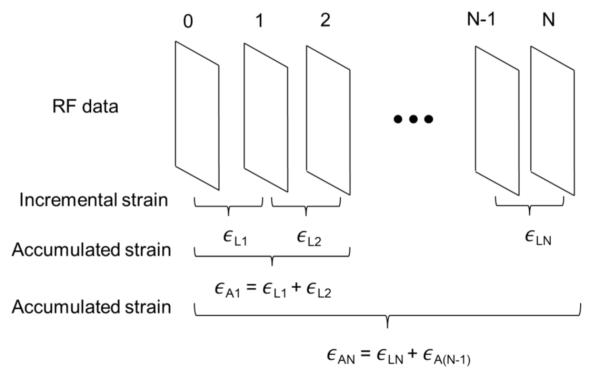
Multicompression elastography performs strain imaging over multiple small-strain increments, and accumulating these small strains can improve the strain image quality(Varghese and Ophir 1996, Lubinski et al 1999). In our analysis, the accumulated strain image contrast is compared to the incremental strain image contrast and to the contrast in strain images obtained from FEA simulations. Accumulated axial strain images were created by simply summing (pixel by pixel) the motion-compensated incremental strains (described below) obtained while loading the phantom. Figure 4 illustrates the difference in estimating the incremental and accumulated strain.
Figure 4.
Schematic representation of how the incremental and accumulated strain were obtained. In this illustration ∈LN is the incremental strain and ∈AN is the accumulated strain at the Nth frame.
2.3.2. Motion compensation
The phantom was deformed uniaxially to create incremental strains. Deforming the phantom results in reorganization of the scatterers and an apparent motion of the spherical inclusions toward the transducer. Therefore, to perform pixel-by-pixel image analysis on the sequence of strain images, the motion must be tracked and compensated for.
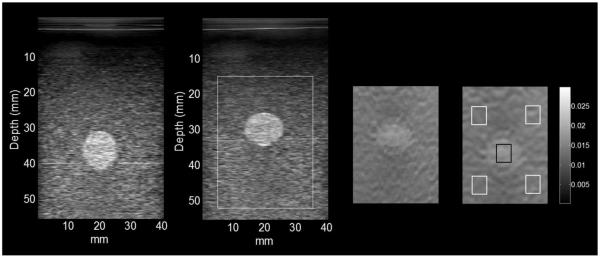
The current strain image frame was motion-compensated by warping its coordinate system into the coordinate system of the strain image calculated for the first step of the loading process (~1.5%) using the accumulated displacements calculated up to that point. A 2D linear interpolation procedure was adopted to accomplish the warping process. Figure 5 illustrates the process of strain image motion compensation.
Figure 5.
Images from left to right are: the B-mode image at initial contact with the transducer, the B-mode image at 18.4% strain, the incremental strain images in the original coordinates and after 18.4% strain, and the incremental strain image at 18.4% strain with motion compensation. The regions of interest for contrast analysis are shown in the strain image on the far right. The background ROIs were placed near the corners to diminish the influence of the stress concentration on the contrast and the CNR. The ROIs adopted were the same for the FEA simulations and experimental results.
2.4. Statistical analysis
Two parameters commonly used to evaluate elastograms are the contrast, and contrast-to-noise ratio (CNR). The observed contrast (C0) is defined as the ratio of the strain experienced by the background to that of the inclusion ; axial strain is the parameter commonly measured in ultrasound elastography
| (1) |
The CNR is a summary measure that quantifies the detectability of the inclusion in the elastogram
| (2) |
where and are the variance in strain estimates in the background and inclusion, respectively.
Contrast and CNR were computed for each image and used to compare equivalent images obtained from the experiments with the tissue-mimicking phantom and those created with equivalent 3D-FEA simulations. The regions of interest (ROI’s) used for image analysis are represented on the motion compensated strain image in figure 5. Experimental results for contrast (Eq. (1)) and CNR (Eq. (2)) are the average of values calculated for the four ROIs, and the error bars are the standard deviation from these four estimates.
3. Results
3.1. Contrast and CNR during loading/unloading cycle
3.1.1. Inclusion 1
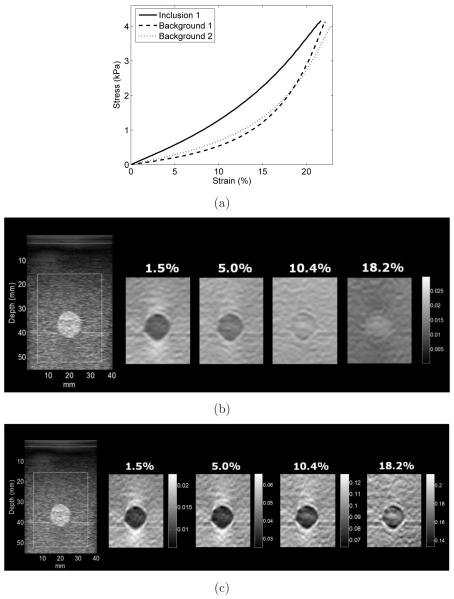
Loosely speaking, the incremental and accumulated strain measured in this study is inversely proportional to elastic tangent and secant shear modulus (evaluated from zero strain to current load level) values, respectively. The stress-strain curves from mechanical testing of the background and inclusion 1 test cylinders are shown in figure 6(a). The values for secant and tangent modulus at low andhigh applied strain are shown in table 2. These values were obtained from the materials’ stress-strain data (values for the background were the average from the two samples). As demonstrated in figure 6(a), the tangent shear modulus at small strain (i.e. instantaneous slope of the stress-strain curve near zero strain) is steeper for inclusion 1 than for the background material suggesting high contrast incremental strain images at small strain. But, the stress-strain curve for inclusion 1 has less curvature than those of the background materials suggesting changing tangent shear modulus and strain image contrast with applied deformation because of elastic nonlinearity.
Figure 6.
(a) Stress-strain data of the inclusion 1 and backgrounds 1 and 2. In (b) and (c) are B-mode (left) and four strain images for inclusion 1. Incremental strain images are shown in (b) for different amounts of preload (axial strain in percent) displayed with the same dynamic range. Accumulated strain images are shown in (c) at the same deformation shown in (b) but with different dynamic range for each image. The strain image contrast changes with the applied deformation.
Table 2.
The small (~1%) strain shear modulus and the secant and tangent moduli at high (~21%) strain from mechanical testing of each component material.
| Elastic Properties | Bkg | Incl 1 | Incl 2 | Incl 3 | Incl 4 |
|---|---|---|---|---|---|
| Tangent (Secant) modulus at small strain (1%) (kPa) | 4.7 | 12.0 | 23.3 | 15.8 | 10.7 |
| Secant modulus at ~21% (kPa) | 15.1 | 18.0 | 94.3 | 62.8 | 47.4 |
| Tangent modulus at ~21% (kPa) | 52.3 | 37.8 | 346 | 225 | 182 |
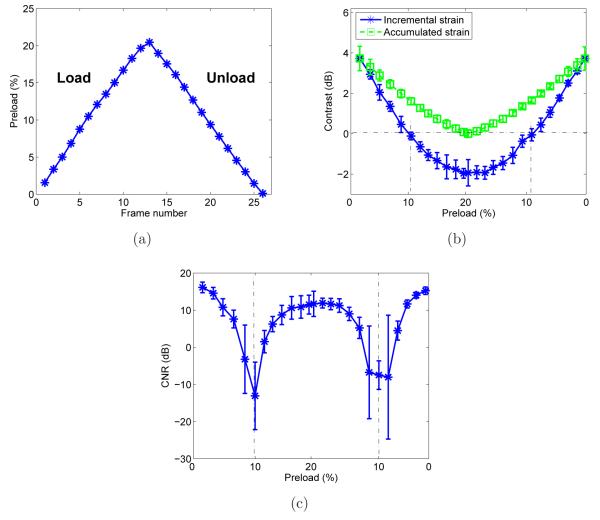
B-mode and incremental (~1.5%) strain images at varying preload of the oil-in-gel inclusion (inclusion 1) are shown in figure 6(b). The values appearing above each strain image indicate the accumulated frame-averaged axial strain (preload; see figure 7(a)). At low preload the inclusion is stiffer (darker) than the background. At modest (~10%) preload, inclusion 1 is barely visible and at large (~18%) preload the inclusion is less stiff (lighter) than the background. This is consistent with tangent shear modulus values obtained through mechanical testing results (see figure 6(a)). This observation is also confirmed by the contrast and CNR calculated using the incremental strain images versus preload shown in figures 7(b) and 7(c), respectively. The dash-dot lines on the contrast graph shows the points (~10% preload) where the inclusion and the background presented the same stiffness (strain image contrast → 0dB) which also corresponds to the lowest calculated CNR values. For higher preload the contrast became negative resulting in higher CNR (the inclusion was visible again). Accumulated strain images are shown in figure 6(c) where contrast in the accumulated strain images approaches zero at ~18% strain, consistent with nearly equal secant shear modulus for inclusion 1 and the background (see table 2).
Figure 7.
Quantitative results obtained for inclusion 1 using the ROI’s represented in figure 5 showing: (a) accumulated average strain for each frame (b) contrast in the incremental strain image and the accumulated strain image during load and unload and (c) CNR calculated from the incremental strain image data.
3.1.2. Inclusions 2, 3 and 4
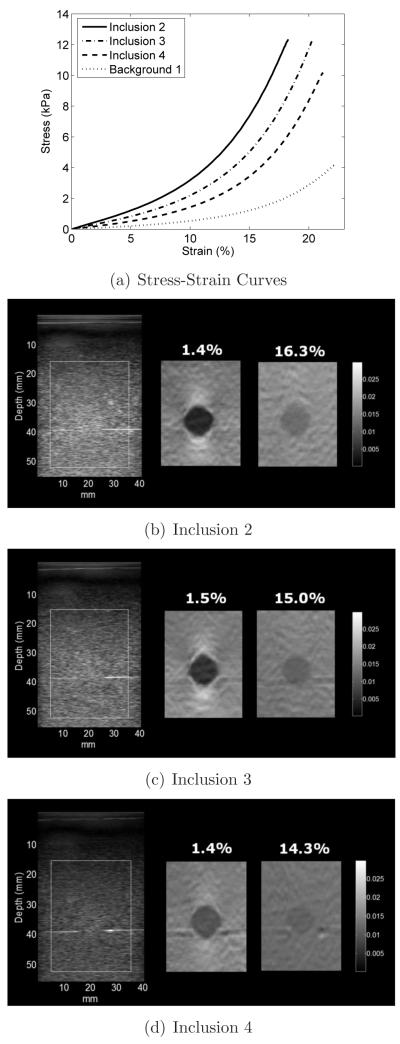
The stress-strain curves from mechanical testing of the background 1 and inclusion 2, 3 and 4 test cylinders are shown in figure 8(a). The tangent (or secant) shear modulus at small strain (1%) calculated for inclusions 2, 3 and 4, shown in table 2, suggests that three different levels of contrast at low preload in the respective strain images. Of note, at near zero strain, the tangent and secant modulus values are comparable.
Figure 8.
(a) Stress-strain data of the inclusions 2, 3, and 4 and background 1. (b), (c) and (d) B-mode (left) and incremental strain images for inclusions 2, 3 and 4. The images in the center and right side are incremental strain images for small ( 1.5%) and large (~15%) preload, respectively.
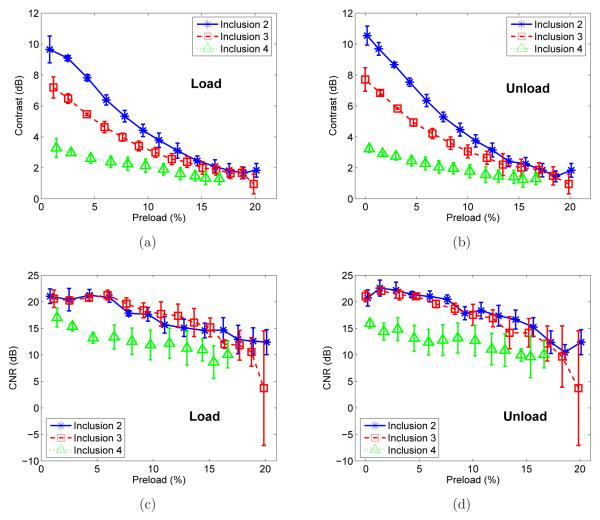
The stress-strain curves for these inclusions have similar curvature compared to the background material, but deformation-dependent strain image contrast is still expected. Figures 8(b), 8(c) and 8(d) show B-mode images and incremental strain images for inclusions 2, 3 and 4. Two incremental (~1.5%) strain images are shown for each inclusion: one at low preload (~1.5% accumulated strain) and one at high preload (~15% accumulated strain). The contrast decreased for all three targets, however, none of the spheres became less stiff than the background (negative contrast). This observation is also consistent with mechanical testing results (see table 2) and with plots of incremental strain image contrast versus preload (Figures 9(a) and 9(b)) which show distinct contrasts at low preload that decreases for each inclusion and approaches a similar value (~2dB) with increasing applied strain. The CNR plots (Figs. 9(c) and 9(d)) for inclusions 2, 3 and 4 show that the CNR for each inclusion was always above 0dB indicating the inclusions could be visualized at applied strains up to 20%. The small differences in contrast and CNR obtained while loading and unloading might be explained by hysteresis in stress-strain load-unload curves. However, further discussion on this topic is beyond the scope of this paper.
Figure 9.
The contrast in the incremental strain images versus preload for inclusions 2, 3 and 4 in loading (a) and unloading (b). CNR of the incremental strain images versus preload are shown in loading (c) and unloading (d).
3.2. Comparison to idealized FEA simulations
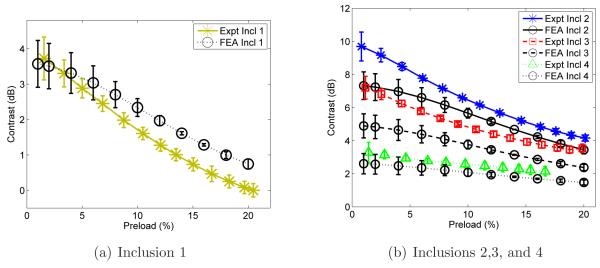
3D FEA simulations were performed using the Veronda-Westmann hyperelastic model (Veronda and Westmann 1970) and compared to experimentally measured strain contrast values. Figure 10 shows plots of accumulated strain image contrast versus preload comparing experimental results to FEA-predicted contrast (see Appendix A) based on the material stress-strain measurements (shown in figure 6(a) and figure 8(a)). Uncertainties among experimentally-measured contrast values were measured from intensity values of the four ROI’s in the background (see figure 5) and displayed as error bars. The error bars on the FEA curves are the expected range of values (two standard deviations centered around the mean value) obtained from the simulation using stress-strain data from the two background samples (see figure 1), while the points indicate contrast obtained using the mean values for background 1 and background 2.
Figure 10.
Comparison between the FEA simulations and the experimental accumulated axial strain contrasts versus percent preload obtained for the (a) inclusion 1 and (b) inclusions 2, 3 and 4.
Figure 10(a) shows the plot for inclusion 1 demonstrating good agreement between simulation and experiment (predicted strain image contrast within 1 dB of the experimental values at all deformations). Figure 10(b) shows the plots for inclusions 2, 3 and 4. The simulations for the inclusions 2 and 3 underestimates the experimental accumulated strain image contrast by about 2 dB at low deformations ([lessorsimilar]3%) and by about 1 dB for larger deformations. The accumulated strain image contrast for inclusion 4 is underestimated by about 0.5 dB for all deformations.
4. Discussion
4.1. Contrast and CNR changing during loading/unloading cycle
The incremental and accumulated strain image contrasts (figures 6 and 7) suggest that the background stiffness increased with the applied strain faster than that of inclusion 1. This was expected based on the higher stress-strain nonlinearity of the background compared to the inclusion 1 (see figure 6(a)). The phantom was designed to have the background stiffen faster than this inclusion causing the incremental strain image contrast to decrease and then invert (changing from dark to bright compared to the background). The contrast reversal is clearly demonstrated in figure 6(b) and its affect on CNR is shown in figure 7(c).
The stress-strain data for inclusions 2, 3 and 4 (figure 8(a)) and the tangent (or secant) moduli shown in table 2 illustrate that these inclusions present distinct stiffness at low applied strain. Since the nonlinear behavior of these inclusions and the background were similar, one might think that the strain image contrast for each of these inclusions would be constant regardless of preload. However, the strain images in figure 8 and the contrast graphs in figures 9(a) and 9(b) show that the contrast decreased for higher preload for all three inclusions. The deformation-dependent incremental strainimage contrast is consistent with that reported by Hall et al (2003) and the nonlinear modulus reconstructions reported by Oberai et al (2009) for some breast tissues. In those cases, the fibroadenoma strain images had high contrast for low applied strains and low contrast at high strains, consistent with the nonlinear reconstructions suggesting that fibroadenomas, compared to the surrounding tissues, had different strain shear moduli but about the same nonlinear behavior.
The explanation provided by Oberai et al (2009) was simple and is consistent with our observations. Assume for the moment that the overall strain in the background was 1% and that the stress experienced by the inclusion was almost the same as the stress in the background. Assume also that the inclusion is ten times stiffer than the background. The strain experienced by the inclusion is lower (approximately 0.1%) than that in the background (ignoring the details of contrast transfer efficiency). Now consider what happens when the strain experienced by the background is 15% (as in figure 8). Again assume that the incremental stress in the inclusion and background are the same. The fact that the background was softer permits it to experience higher strains, and since it has a nonlinear stress-strain relationship, it stiffens more than the inclusion. Since the background has stiffened relative to the inclusion, its modulus is now closer to that of the inclusion and they undergo strains that are more similar (lower strain image contrast) than at lower preload. This behavior was the observed in figures 9(a) and 9(b) where inclusion 2 (harder) presented the largest decrease in strain image contrast while inclusion 4 (softer) presented the lowest change in contrast. At 15% overall strain, the average strain calculated for inclusions 2, 3 and 4 were, 8%, 9.6% and 11.8%, respectively.
It is worthwhile to compare the results obtained with inclusions 1 and 4. These materials have similar elastic modulus at small strain (12.0kPa v 10.7kPa) but very different nonlinearity. Because of differences in the nonlinearity of the background and inclusion 1, they have similar elastic modulus at 10% strain and therefore inclusion 1 provides zero contrast at that deformation. However, since inclusion 4 has nonlinearity similar to the background, it retains negative contrast relative to the background at the maximum applied (20%) strain.
4.2. Comparison to idealized FEA simulations
Good agreement was found in accumulated strain image contrast between 3D FEA simulation and experiment. For each inclusion, the image contrast difference was quite small (i.e. maximum difference is less than 2 dB and the average difference is approximately 0.5 dB).
Recall that hyperelastic strain energy functions (see Appendix A) were obtained by fitting uniaxial stress-strain data in a least-squares sense to a Veronda-Westmann model (Veronda and Westmann 1970). It is known that errors resulting from a least-square fitting exist (Ogden et al 2004). This is one contribution to the discrepancies between experiments and FEA simulation presented in this manuscript, though subtle differences between the FEA model and the actual phantom such as simulated and actual boundary conditions, might also play a role. Overall, the experimental strain image contrast were accurately estimated with the FEA simulations governed by experimentally-obtained stress-strain curves of the same materials (physics of hyperelastic solids) (differences between measured and predicted of less than 2 dB).
From the results shown, we verified that increasing agar concentration does not greatly affect the nonlinear behavior of the materials, but oil dispersions with these materials provides further control of their nonlinearity and small-strain shear modulus. The material composition of each part of the phantom can be easily controlled and were confirmed by the contrast and CNR analysis. Although PVA-C is a another phantom material that can have mechanical and acoustic properties similar to soft tissues, and which the degree of nonlinearity and Young’s modulus can be controlled (Pazos et al 2009), it is more difficult to use in constructing complicated phantoms. In Mehrabian et al (2010), the authors reconstructed the nonlinear behavior of a heterogeneous PVA-C phantom based on photos of the phantom taken when it was subjected to zero and 31.6% compression. While all the mechanical parameters of the PVA-C can be well controlled, the procedure to achieve properties depends on a more laborious procedure involving multiple (well controlled) freeze-thaw cycles. Therefore, in a heterogeneous phantom, controlling material properties can be more tricky because of the freeze-thaw cycles and its dependence on phantom geometry.(Mehrabian et al 2010)
5. Conclusion
This paper presented an experimental approach to evaluate changes in contrast and CNR between inclusion and background for large deformations (up to 20%) when the stress-strain relationship for the materials is nonlinear. This work illustrates that nonlinear elasticity phantoms are relatively easy to manufacture and their mechanical properties can be accurately predicted from independent measurements of the constituent materials.
The change in contrast over a large deformation range predicted by the FEA simulations was consistent with that experimentally observed. An inclusion with lower nonlinearity than the background demonstrated strain image contrast inversion. Stiffer inclusions presented faster decrease in contrast than softer inclusions when both have the same nonlinear behavior as the background. These differences can all be explained by analyzing the relative nonlinear behavior of the constituent materials.
Acknowledgments
We are grateful for the financial support from the Brazilian foundations CAPES and FAPESP (for the first author) and NIH grants R01CA100373 and R21CA133488.
Appendix A. Nonlinear finite element analysis and material model
Finite element method (FEM) is a mature numerical technique for solving partial differential equations. It has been widely used in the field of elastography to study theory and evaluate algorithms. In this study, nonlinear FEM simulations were used to obtain nonlinear displacement and strain fields under large deformations. We assume all phantom materials are incompressible and hyperelastic. Linear tetrahedral element available in the FEBio package was used to simulate all incompressible hyperelastic models. An open source software package (FEBio version 1.4) (Maas et al 2012) was used to perform these nonlinear FEM simulations. The linear tetrahedral element is a 3D element defined by 4 nodes, each with three degrees of freedom. An open source mesh generator, Tetgen (Si and Gärtner 2011, Si et al 2010), was used to generate the FEA computing mesh used in this manuscript.
Computer models of the TM phantom were virtually 3D replicates of the geometry shown in figure 2. Displacement boundary conditions were used during all simulations. More specifically, vertical displacements up to 20% of the height were uniformly applied onto the top edge, while the bottom edge was assumed to be fixed in the vertical direction and free to slip along the horizontal direction. All lateral sides were not subject to any prescribed displacement conditions.
For each material investigated, the uniaxial stress-strain curve obtained through mechanical testing (see figures 6(a) and 8(a)) was fit to a Veronda-Westmann model of the potential (strain) energy.(Veronda and Westmann 1970) This constitutive model has been used, for example, to characterize phantom materials (Pavan et al 2010) similar to those used in the present manuscript and for in vivo breast tissues (Oberai et al 2009). In the Veronda-Westmann model the strain energy is given by an exponential form
| (3) |
where C1 and C1 are, respectively, the first and second Veronda-Westmann coefficients, I1 and I1 are, respectively, the first and second invariant of the right Cauchy-Green tensor. Incompressibility requires the volumetric strain function U(J) = 0 and the
Table A1.
Veronda-Westmann coefficients used in the FEA simulations for all phantom materials.
| Sample | C1 (Pa) | C2 |
|---|---|---|
| Background 1 | 221 | 6.1 |
| Background 2 | 420 | 4.1 |
| Inclusion 1 | 2209 | 1.9 |
| Inclusion 2 | 541 | 6.6 |
| Inclusion 3 | 930 | 6.1 |
| Inclusion 4 | 1416 | 6.6 |
determinant of the deformation gradient J = 1. Table A1 shows the Veronda-Westmann coefficients used in the FEA simulation obtained from the fitting the stress-strain data for each phantom component material to this model.
Footnotes
PACS numbers: 62.20.-x, 83.60.Df, 83.80.Kn
References
- Catheline S, Gennisson JL, Fink M. The Journal of the Acoustical Society of America. 2003;114:3087. doi: 10.1121/1.1610457. [DOI] [PubMed] [Google Scholar]
- Erkamp RQ, Emelianov SY, Skovoroda AR, O’Donnell M. IEEE Transactions on Ultrasonics, Ferroelectrics and Frequency Control. 2004a;51(5):532–539. [PubMed] [Google Scholar]
- Fung YC. Biomechanics: mechanical properties of living tissues. Springer-Verlag; New York: 1993. [Google Scholar]
- Gokhale NH, Barbone PE, Oberai AA. Inverse Problems. 2008;435(4):045010. [Google Scholar]
- Hall TJ, Bilgen M, Insana MF, Krouskop TA. IEEE Transactions on Ultrasonics, Ferroelectrics and Frequency Control. 1997;44(6):1355–1365. doi: 10.1109/58.585210. [DOI] [PubMed] [Google Scholar]
- Hall TJ, Zhu Y, Spalding CS. Ultrasound in Medicine & Biology. 2003;29(3):427–435. doi: 10.1016/s0301-5629(02)00733-0. [DOI] [PubMed] [Google Scholar]
- Jiang J, Hall TJ. Physics in Medicine and Biology. 2007;52(13):3773–3790. doi: 10.1088/0031-9155/52/13/008. [DOI] [PubMed] [Google Scholar]
- Jiang J, Hall TJ, Sommer AM. Ultrasound in Medicine & Biology. 2007;33(4):643–652. doi: 10.1016/j.ultrasmedbio.2006.11.005. [DOI] [PMC free article] [PubMed] [Google Scholar]
- Kallel F, Ophir J. Ultrasonic Imaging. 1997;19(3):195–208. doi: 10.1177/016173469701900303. [DOI] [PubMed] [Google Scholar]
- King DM, Moran CM, McNamara JD, Fagan AJ, Browne JE. Ultrasound in Medicine & Biology. 2011;37(5):813–826. doi: 10.1016/j.ultrasmedbio.2011.02.012. [DOI] [PubMed] [Google Scholar]
- Kofler JM, et al. Ultrasound in Medicine & Biology. 2001;27(12):1667–1676. doi: 10.1016/s0301-5629(01)00473-2. [DOI] [PubMed] [Google Scholar]
- Krouskop TA, Wheeler TM, Kallel F, Garra BS, Hall T. Ultrasonic Imaging. 1998;20(4):260–274. doi: 10.1177/016173469802000403. [DOI] [PubMed] [Google Scholar]
- Labropoulos KC, Niesz DE, Danforth SC, Kevrekidis PG. Carbohydrate Polymers. 2002;50(4):393–406. [Google Scholar]
- Lubinski MA, Emelianov SY, O’Donnell M. IEEE Transactions on Ultrasonics, Ferroelectrics and Frequency Control. 1999;46(1):97–107. doi: 10.1109/58.741428. [DOI] [PubMed] [Google Scholar]
- Maas SA, Ellis BJ, Ateshian GA, Weiss JA. Journal of Biomechanical Engineering. 2012;134:011005. doi: 10.1115/1.4005694. [DOI] [PMC free article] [PubMed] [Google Scholar]
- Madsen EL, Blechinger JC, Frank GR. Medical Physics. 1991;18(3):549–554. doi: 10.1118/1.596659. [DOI] [PubMed] [Google Scholar]
- Madsen EL, Frank GR, Hobson MA, Shi H, Jiang J, Varghese T, Hall TJ. Physics in Medicine and Biology. 2005b;50:5983. doi: 10.1088/0031-9155/50/24/015. [DOI] [PMC free article] [PubMed] [Google Scholar]
- Madsen EL, Frank GR, Krouskop TA, Varghese T, Kallel F, Ophir J. Ultrasonic Imaging. 2003;25(1):17–38. doi: 10.1177/016173460302500102. [DOI] [PubMed] [Google Scholar]
- Madsen EL, Hobson MA, Shi H, Varghese T, Frank GR. Physics in Medicine and Biology. 2005a;50(23):5597–5618. doi: 10.1088/0031-9155/50/23/013. [DOI] [PMC free article] [PubMed] [Google Scholar]
- Mehrabian H, Campbell G, Samani A. Physics in Medicine and Biology. 2010;55:7489. doi: 10.1088/0031-9155/55/24/007. [DOI] [PubMed] [Google Scholar]
- Muthupillai R, Lomas DJ, Rossman PJ, Greenleaf JF, Manduca A, Ehman RL. Science. 1995;269(5232):1854. doi: 10.1126/science.7569924. [DOI] [PubMed] [Google Scholar]
- Nitta N, Shiina T. Japanese Journal of Applied Physics. 2002a;41:3572–3578. [Google Scholar]
- Nitta N, Shiina T. Electronics and Communications in Japan Part III-Fundamental Electronic Science. 2002b;85(12):9–18. [Google Scholar]
- Oberai AA, Gokhale NH, Goenezen S, Barbone PE, Hall TJ, Sommer AM, Jiang J. Physics in Medicine and Biology. 2009;54(5):1191–1207. doi: 10.1088/0031-9155/54/5/006. [DOI] [PMC free article] [PubMed] [Google Scholar]
- Ogden R, Saccomandi G, Sgura I. Computational Mechanics. 2004;34:484–502. [Google Scholar]
- O’Hagan JJ, Samani A. Physics in Medicine and Biology. 2009;54(8):2557–2569. doi: 10.1088/0031-9155/54/8/020. [DOI] [PubMed] [Google Scholar]
- Ophir J, Cespedes I, Ponnekanti H, Yazdi Y, Li X. Ultrasonic Imaging. 1991;13(2):111–134. doi: 10.1177/016173469101300201. [DOI] [PubMed] [Google Scholar]
- Pavan TZ, Madsen EL, Frank GR, Carneiro AAO, Hall TJ. Physics in Medicine and Biology. 2010;55:2679–2692. doi: 10.1088/0031-9155/55/9/017. [DOI] [PMC free article] [PubMed] [Google Scholar]
- Pazos V, Mongrain R, Tardif JC. Journal of the Mechanical Behavior of Biomedical Materials. 2009;2(5):542–549. doi: 10.1016/j.jmbbm.2009.01.003. [DOI] [PubMed] [Google Scholar]
- Si H, Gärtner K. International Journal for Numerical Methods in Engineering. 2011;85(11):1341–1364. [Google Scholar]
- Si H, Gärtner K, Fuhrmann J. Computational Mathematics and Mathematical Physics. 2010;50(1):38–53. [Google Scholar]
- Sinkus R, Bercoff J, Tanter M, Gennisson JL, El Khoury C, Servois V, Tardivon A, Fink M. IEEE Transactions on Ultrasonics, Ferroelectrics and Frequency Control. 2006;53(11):2009–2018. doi: 10.1109/tuffc.2006.141. [DOI] [PubMed] [Google Scholar]
- Skovoroda AR, Lubinski LA, Emelianov SY, O’Donnell M. IEEE Transactions on Ultrasonics, Ferroelectrics and Frequency Control. 1999;46(3):523–535. doi: 10.1109/58.764839. [DOI] [PubMed] [Google Scholar]
- Surry KJM, Austin HJB, Fenster A, Peters TM. Physics in Medicine and Biology. 2004;49:5529. doi: 10.1088/0031-9155/49/24/009. [DOI] [PubMed] [Google Scholar]
- Varghese T, Ophir J. Ultrasonic imaging. 1996;18(3):193–214. doi: 10.1177/016173469601800303. [DOI] [PubMed] [Google Scholar]
- Varghese T, Ophir J, Krouskop TA. Ultrasound in Medicine & Biology. 2000;26(5):839–851. doi: 10.1016/s0301-5629(00)00199-x. [DOI] [PubMed] [Google Scholar]
- Veronda DR, Westmann RA. Journal of Biomechanics. 1970;3(1):111–124. doi: 10.1016/0021-9290(70)90055-2. [DOI] [PubMed] [Google Scholar]
- Wellman P. PhD thesis. Harvard University; 1999. Tactile imaging. [Google Scholar]


